Provided by the author(s) and University College Dublin Library in accordance with publisher policies. Please cite the published version when available.
Title Effects of increasing design traffic load on performance and life-cycle cost of bridges Authors(s) Hanley, Ciarán; Frangopol, Dan M.; Kelliher, Denis; Pakrashi, Vikram
Publication date 2016-06-07
Publication information Bittencourt, T.N., Frangopol, D.M., Beck, A. (eds.). Maintenance, Monitoring, Safety, Risk and Resilience of Bridges and Bridge Networks - Proceedings of the 8th International Conference on Bridge Maintenance, Safety and Management, IABMAS 2016
Conference details IABMAS: 8th International Conference on Bridge Maintenance, Safety and Management, Foz do Iguaçu, Paraná, Brazil, 26-30 June, 2016
Publisher CRC Press - Taylor & Francis Group
Item record/more information http://hdl.handle.net/10197/10516
Publisher's statement This is an Accepted Manuscript of a book chapter published by Routledge/CRC Press in Maintenance, Monitoring, Safety, Risk and Resilience of Bridges and Bridge Networks on [7 June 2016, available online:
https://www.crcpress.com/Maintenance-Monitoring-Safety-Risk-and-Resilience-of-Bridges-and-Bridge/Bittencourt-Frangopol-Beck/p/book/9781138028517
Downloaded 2021-01-12T02:07:22Z
The UCD community has made this article openly available. Please share how this access benefits you. Your story matters! (@ucd_oa)
Effects of increasing design traffic load on performance and life-cycle
cost of bridges
Ciar´an Hanley
Dynamical Systems & Risk Laboratory (DSRL), School of Engineering, University College Cork, Ireland
Dan M. Frangopol
Dept. of Civil and Environmental Engineering, Center for Advanced Technology for Large Structural Systems (ATLSS Center), Lehigh University, 117 ATLSS Drive, Bethlehem, PA 18015-4729, USA
Denis Kelliher
Research Unit for Structures & Optimisation (RUSO), School of Engineering, University College Cork, Ireland
Vikram Pakrashi
Dynamical Systems & Risk Laboratory (DSRL), School of Engineering, University College Cork, Ireland
ABSTRACT: Due to the onerous and expensive nature of preventative and essential maintenance of existing bridge infrastructure, it is prudent to look into methods of improving the life-cycle safety and cost of newly constructed bridges at the design phase. In an effort to acheive economy in material quantities and initial cost, the structural capacity of these bridges is often at the required minimum target level. This paper investigates the effects that increased design traffic loading have on the initial construction cost and whether that could be balanced by a reduced requirement for financial intervention in the mid to later stages of the bridge’s design-life. This is achieved by conducting a life-cycle performance and cost assessment on a reinforced concrete slab bridge that is designed to increasing standard traffic loads.
1 INTRODUCTION
Preserving a functional and serviceable civil infras-tructure network requires complex methods to de-vise optimum strategies to schedule expensive pre-ventative and essential maintenance of existing bridge stock (Estes and Frangopol 2001). Quantification of structural safety and redundancy for bridges is an im-portant process in network maintenance management (Akg¨ul and Frangopol 2003, Frangopol and Nakib 1991, Weninger-Vycudil et al. 2015) and is strongly dependent on the effects of live loading (Nowak et al. 1993, Nowak 1993). A review of the national bridge stock in six European countries showed that the ma-jority of bridges were built in the post-war period of 1945–1965 ( ˇZnidariˇc et al. 2011), while in the United States, the average age of the national bridge stock is 42 years, 11% of which is said to be structurally deficient and 25% said to be “functionally obsolete” (ASCE 2013). Often, there has not been sufficient funds for owners of bridge stock to replace, intervene,
or even prioritise investment (Ellingwood 2005, Fran-gopol and Liu 2007, FranFran-gopol 2011, FranFran-gopol and Soliman 2016, Pakrashi et al. 2011, Frangopol and Bocchini 2012).
While new bridge structures conform to and benefit from the acknowledgement of epistemic and aleatory uncertainties (Ang and Tang 2007) through norma-tive documents (Cornell 1969, Benjamin and Lind 1969, Shah 1969, Lind 1972, Rosenblueth and Esteva 1972), it is prudent to look into methods of improv-ing the life-cycle safety and cost of newly constructed bridges at the design phase. At this stage, design traf-fic loading is typically specified in normative codes as a function of bridge geometry, with section capacities being designed accordingly (Dawe 2003). In practice, the structural capacity is minimised at the ultimate limit state in an effort to reduce material quantities and initial construction costs. Achieving such econ-omy is often accomplished at the expense of struc-tural robustness from a life-cycle perspective. This paper investigates to what extent design traffic
load-ing has on life-cycle safety and cost assessments for bridge structures. The effects that increased design traffic loading would have on the initial construction cost of a more robust bridge could be balanced by a delayed deterioration to the minimum performance threshold and, consequently, a reduced requirement for financial intervention in the mid to later stages of the bridge’s design-life.
In this paper, a brief summary of the major bridge design and assessment standards used in the UK & Ireland will be presented, and the effect of the vari-ous definitions of normative traffic loading, and thus minimum flexural capacity, will be shown on the per-formance indicators, in this case the reliability in-dexβ (Ditlevsen and Madsen 1996, Melchers 1999, Pakrashi and Hanley 2015), of a simply supported re-inforced concrete slab bridge. An 80 year life-cycle reliability assessment is presented for the five itera-tions of the bridge design, as well as an associated life-cycle cost assessment that is required to keep the bridge above a minimum acceptable performance threshold, defined as the target reliability index βT.
It will be shown how a small relative increase in the flexural capacity at the design stage, and thus initial construction cost, results in a significant offset in the expect cost of failure, and thus the total expected life-cycle cost.
2 EVOLUTION OF NORMATIVE TRAFFIC
LOADING
Prior to the latter 19th century, traffic loading on bridges was not of primary concern to the bridge builder, as this load was considered light relative to the self-weight of the structure itself (Henderson 1954). It was only subsequent to the emergence of the traction engine that the effect of traffic loading on bridges became an important design criteria. The evo-lution of normative traffic load specifications in the UK and Ireland in an 80 year period (Dawe 2003) has, in some instances, resulted in an almost doubling the flexural load effects betweenBS 153(BSI 1937),
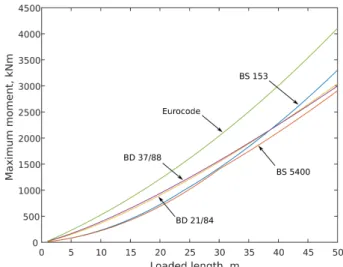
BS 5400 (BSI 1978), BD 21/84 (Highways Agency 1984), BD 37/88 (Highways Agency 1988) and the introduction of the Eurocode (CEN 1994). The ef-fects on changes in the design standards on the in-duced bending moment of a simply supported bridge can be seen in Figure 1.
BS 153–Standard specification for girder bridges
(BSI 1937) recommendeded the use of a standard loading train (SLT) with a unit load of 1 ton/axle, and 15 units to be applied per 10 ft of lane width, and a 10 ft headway between vehicles. Additionally, it was specified to apply a uniformly distributed load (UDL) of 4.02 kN/m2 (84 lb/ft2) to account for pedestrians and light traffic. Further revisions of this standard in-troduced what is now known as ‘abnormal’ loading, with the previous loading being referred to as ‘nor-mal’ loading, as well as the increase in applied units
Figure 1: Maximum bending moment with increasing spans for changing live load definitions
from 15 to 22 to account for general traffic increases. Furthermore, computational ease was improved with the introduction of a standard loading curve (SLC) to replace the standard loading train. The SLC specified a UDL as a function of span, with a higher UDL for shorter spans to account for the increased likelihood of a single span being fully loaded by trucks. Addi-tionally, a knife-edge load was to be applied across the lane width of 39.4 kN/m (2700 lb/ft) at a location within the span to produce the worst shear force ef-fect.
The introduction of BS 5400–Steel, concrete, and composite bridges (BSI 1978) in 1978 transitioned standards to the limit-state philosophy, whereby par-tial factors could be applied to both load and re-sistance variables (Allen 1975). Part 2 of the stan-dard dealt with the application of traffic loads, and recommended partial factors based on engineering judgement at the time, due to the absence of proba-bilistic information. The SLC from BS 153 was re-tained, except with a constant UDL of 30 kN/m/lane up to a span of 30 m. For simply supported spans, this resulted in a maximum midspan bending moment slightly less than that prescribed inBS 153, for which a divergence begins from the 30–50 m span range.
BD 21–The assessment of highway bridges and structures (Highways Agency 1984) was introduced in 1984 revise some provisions ofBS 5400for shorter spans. Specifically, the furthest departure was the elimination of a constant UDL for spans under 30 m, to be replaced by a curve that was fully variant with span length, and defined by a single formula as a func-tion of length. The SLC was developed under the as-sumption that shorter spans are more likely to be fully laden with convoys of large vehicles than larger spans, and thus envelopes were made of the worst load ef-fects for a variety of spans, and a new single SLC was derived from the results. The effect of the elimina-tion of a constant UDL for spans under 30 m can be seen through the deviation between maximum bend-ing moments forBS 5400 andBD 21/84in Figure 1.
Due to the general expected increase in total weight of European vehicles, the SLC ofBD 21/84 was up-dated in BD 37–Loads for highway bridges (High-ways Agency 1988) to account for a 40 tonne gross weight vehicle, as opposed to that ofBD 21/84which accounted for 38 tonnes. The effect of this code is seen in greater prominence for spans above 50 m, but produces a minimal change in flexural load effects fromBD 21/84(Figure 1).
The development of EN 1991-2: Eurocode 1: Ac-tions on structures. Traffic loads on bridges (CEN 1994) introduced four separate load models to ac-count for the vertical load being applied to bridges, with Load Model 1 (LM1), corresponding to what has been referred to as normal loading, for spans be-tween 5–200 m, and a carriageway width of up to 42 m. LM1 was derived from real European traffic data, and specified an ultimate load exceedence rate of 5% in 50 years, or a return period of 1000 years (Bruls et al. 1996). LM1 departed from previous representa-tions of normal traffic loading by eliminating the SLC defined UDL and invariant KEL, and replacing them with a series of constant UDL’s, invariant with span length, in adjacent lanes and a tandem axle system of point loads. As can be seen from the comparison of bending moments in Figure 1, LM1 of Eurocode
results in the most onerous of load effects of the pre-sented normative standards.
3 DEVELOPMENT OF BRIDGE MODELS
In the assessment of civil engineering structures, a true representation of the structural safety can only be obtained through probabilistic methods which can ac-count for load, material, and model uncertainties. The reliability index β is a measure of structural safety, which is a function of the probability of failure Pf
and can be expressed as:
β=−Φ−1(Pf) (1)
where Φ is the standard normal cumulative distri-bution function. The probability of failure Pf is the
probability of violation of a specified limit-state g = 0, and for structural safety assessments can be ex-pressed as:
Pf =P(R−S≤0) =P[g(R, S)≤0]
=P[g(X)≤0] (2) whereR is the resistance/capacity of the element un-der consiun-deration, andS represents the applied load. In this assessment, the flexural performance function
g was analysed, and so the flexural capacityMu was
tested against the bending moment effects of the self-weight of the bridge MDL, the superimposed dead
load of the road surfaceMSDL, and the various
bend-ing moments produced by changbend-ing traffic load spec-ificationsMLL.
g=R−S=Mu−MDL−MSDL−MLL (3)
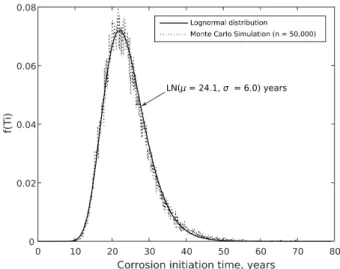
Figure 2: Probability density function of corrosion initiation time using lognormal distribution and Monte Carlo Simulation
For computational efficiency, the limit state equa-tions are expressed in parametric form (Akg¨ul and Frangopol 2004a), whereby the random variablesXij
and the deterministic parameters Yij are decoupled,
and groups ofYiare combined into deterministic
con-stant coefficients Cij in the limit state equations. For
the three bridges under consideration (RC slab, RC beam, PS beam), the limit state equation for flexural failure is defined as:
gm = C01Asfyγmλd−C02 A2 sfy2γm fc ! −C03λc−C04λs−C05λLL (4)
where the random variables Aps, As, fc, fpu, fy, and
the uncertainty factorsλxandγmare defined in Table
1, and the deterministic constant coefficients Cij are
functions of the deterministic parameters defined in Table 2.
The probabilistic load model used in this paper was developed by Chryssanthopoulos et al. (1997) and Cooper (1997), and was derived as a static load model with a UDL and two axle loads, factored by a sta-tistically defined variable λP rob with a Gumbel
dis-tribution; extrapolated from WIM data on motorway bridges in the UK.
The corrosion model used in the lifetime assess-ment of the bridges was based on a uniform reduc-tion in flexural steel area, assumed here to be caused by chloride only (Akg¨ul and Frangopol 2005a). The time to initiation of corrosion Ti is commonly
ob-tained using Fick’s 2nd law of diffusion (Akg¨ul and Frangopol 2004b, Akg¨ul and Frangopol 2005b, Ken-shel and O’Connor 2009):
Ti = C2 4Dc erf−1 C s−Ccr Cs −2 (5) where C is the concrete cover to flexural reinforce-ment (mm);Ccr is the critical chloride concentration
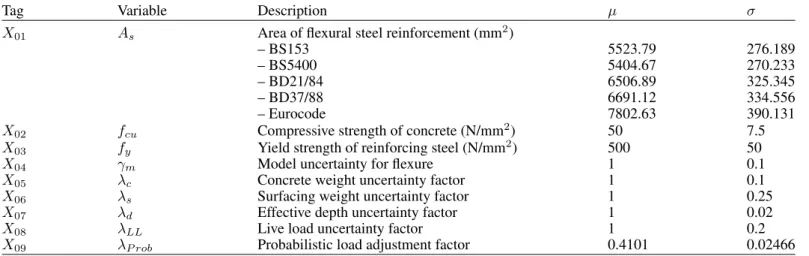
Table 1: Random variables for assessment (All RV’s have lognormal distributions, with the exception ofλP rob, which has a Gumbel
distribution)
Tag Variable Description µ σ
X01 As Area of flexural steel reinforcement (mm2)
– BS153 5523.79 276.189
– BS5400 5404.67 270.233
– BD21/84 6506.89 325.345
– BD37/88 6691.12 334.556
– Eurocode 7802.63 390.131
X02 fcu Compressive strength of concrete (N/mm2) 50 7.5
X03 fy Yield strength of reinforcing steel (N/mm2) 500 50
X04 γm Model uncertainty for flexure 1 0.1
X05 λc Concrete weight uncertainty factor 1 0.1
X06 λs Surfacing weight uncertainty factor 1 0.25
X07 λd Effective depth uncertainty factor 1 0.02
X08 λLL Live load uncertainty factor 1 0.2
X09 λP rob Probabilistic load adjustment factor 0.4101 0.02466
Table 2: Deterministic parameters for assessment
Tag Par. Description Value Y01 b Width of section considered (mm) 1000
Y02 bL Notional lane width (m) 3.2
Y03 d Effective depth of section (mm) 724
Y04 L Span length (m) 16
Y05 hc Height of concrete slab (mm) 800
Y06 ts Thickness of road surface (mm) 100
Y07 ρc Self-weight on concrete (kN/m3) 25
Y08 ρs Self-weight of surface (kN/m3) 24
is the chloride diffusion coefficient (mm2/year); and erf is the error function. In this analysis, Ccr, Cs,
andDcare treated as random variables with a
lognor-mal distribution; with values (µ, σ) of (0.037,0.0056), (0.15,0.015), and (110,12.1), respectively (Enright and Frangopol 1998). Once the time to corrosion ini-tiation is determined, time-variant flexural steelAs(t)
area can be found as:
As(t) = π 4 n X j=1 [D0,j−∆Dj(t)]2, ∆Dj(t) =rcorr(t−Ti) (6)
whereD0,jis the initial diameter of the steel bars and
strands; ∆Dj(t) is the amount of section lost after
timet;nis the number of bars; andrcorr is the rate of
corrosion of the flexural steel. While rcorr is a
func-tion of the constant rate in time icorr and the
corro-sion coefficient value Ccorr, here rcorr (mm/year) is
modelled as random variable with a lognormal dis-tribution, with a meanµand standard deviationσ of 0.0762 and 0.0223 for the RC bridges (Akg¨ul and Frangopol 2005b), and 0.0571 and 0.017 for the PC bridge (Akg¨ul and Frangopol 2004b).
4 LIFE-CYCLE COST MODEL (FRANGOPOL
ET AL. 1997)
The life-cycle cost model used in this assessment was developed by Frangopol et al. (1997) to optimise the
inspection and repair of deteriorating structures, the procedure of which is briefly summarised here. The expected total life-cycle cost CET is the sum of the
various cost components of the structure; initial con-structionCT, routine preventative maintenanceCP M,
inspectionsCIN S, repairCREP, and failureCF. CET =CT +CP M+CIN S+CREP +CF (7)
The initial construction costCT is taken as a function
of the volume of concrete and steel in the section, and can be expressed as:
CT =CCAcL+CSAsL (8)
whereCC andCSis the unit cost of concrete and steel
per m3, respectively; Ac and As is the area of
con-crete and steel in the section, respectively; and L is the length of the section being considered. In order to account for the reduction ofAs away from the
po-sition of maximum bending moment, it is suggested to factorAsby 0.75 (Lin and Frangopol 1996).
How-ever, as this model does not consider the effect and cost of shear reinforcement, the total value ofAswill
be accounted for to simulate the cost of shear rein-forcement.
The cost of lifetime preventative maintenanceCP M
is described as the linear combination of the cost of preventative maintenance at year one Cmain, and the
age of the structure at the time of the preventative maintenance t. To account for future costs, CP M is
the sum of the net present value costs of each occur-rence of routine preventative maintenance:
CP M = t X i=1 Cmain,i 1 (1 +r)ti (9)
whereris the net discount rate.
The total expected inspection costCIN S is defined
as: CIN S= m X i=1 Cins 1 (1 +r)ti (10)
wheremis the number of inspections; andCinsis the
cost of the inspection method used (Mori and Elling-wood 1994), which is a function of the detectable damage intensity η and cost of an ideal inspection
αins, which is to be taken as a fraction of the initial
costCT.
In the development of this model, Frangopol et al. (1997) have shown that the number of inspectionsm
have a significant influence onCET, as this variable
has a direct influence on the number of repair activi-ties carried out, which reduces the overall probability of failurePf and thus the expected cost of failureCF.
To establishCREP andCF, an event tree can be
con-structed whereby for each inspection, a decision can be taken on whether to initiate a repair activity or not. A constraint imposed on the model is that if damage
η is detected during any inspection, a repair activity must be carried out. This decision is thus based on the probability of detecting damage at the time of an inspection, or the probability of damage not being de-tected. For simplicity, in this assessment it is assumed that each repair activity returns the bridge to its initial reliability indexβi. Thus, for each node of the event
tree, the decision on whether to conduct a repair activ-ity or not will directly influence the failure probabilactiv-ity at the following node on the event tree for the next in-spection.
The lifetime failure probabilityPf,lif eof the bridge
for any number ofminspections can be defined as:
Pf,lif e=
2m
X
i=1
Pf,lif e,iP(Bi) (11)
where P(Bi) is the probability that any path on the
event tree occurs, andPf,lif e,iis the maximum failure
probability for that path. The expected total cost of repair is then defined as:
CREP =
2m X
i=1
Crep,iP(Bi) (12)
whereCrep,iis the net present value repair cost at each
node, as a function of the effect of the repair activity
erep.
Finally, the expected failure costCF is defined as:
CF =CfPf,lif e (13)
where the failure cost Cf is a function of the initial
costCT, in this assessment assumed to be 50,000CT.
5 RESULTS
5.1 Life-Cycle Reliability Assessment
A reinforced concrete (RC) slab bridge was designed for the five design traffic loads discussed previously, with the model being constrained to change only the minimum required flexural steel area As to account
for the changing flexural capacity demands (Table 1).
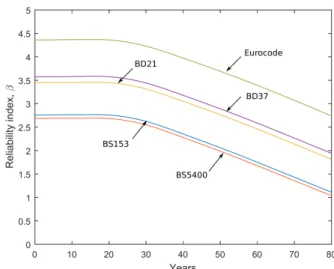
Figure 3: Life-cycle reliability index for RC slab bridge for var-ious normative codes
The life-cycle performance was evaluated through a time-dependent reliability analysis, considering the time-variant degradation ofAsdue to the uniform
cor-rosion model. Using equation 5, the time to corcor-rosion initiationTiwas evaluated using a Monte Carlo
simu-lation of 50,000 samples, and fitting a lognormal dis-tribution as a good estimate (Enright and Frangopol 1998). The mean value ofTi for this RC slab bridge
was 24.1 years. The loss of cross-sectional area of flexural steel specified under each design load was de-termined using equation 6 and used to determine the time-dependent reliability index (Figure 3).
It is evident that the design code that produced the most adverse bending moment (Eurocode) and thus demanded the largest flexural capacity yields the greatest life-cycle performance, with the opposite be-ing true for the least onerous code,BS 5400. Addition-ally, it can be seen that the five codes considered pro-duce life-cycle β curves that are bunched into three different ‘bands’, which generally follow the time pe-riod with which they were developed, and thus the philosophy regarding structural design at these times; from allowable stress-based design of BS 153 to the more sophisticated Eurocode, derived from proba-bilistic code calibration.
5.2 Life-Cycle Cost Assessment
The objective of the life-cycle cost model used here is to minimiseCET while ensuring a minimum level of
structural performance at all times, and then to deter-mine the optimum inspection and repair strategy that achieves this goal. The structural performance is in-dicated through β and Pf, with a minimum
perfor-mance indicator being the target reliability indexβT.
In this assessment, βT is set at a value of 2.5, which
corresponds to aPf of 0.0062. As the expected cost of
failureCF is a function of the lifetime probability of
failurePf,lif e, andPf,lif eis heavily related to the
num-ber of inspections m conducted, it has been shown by Frangopol et al. (1997) thatCF can be minimised
Figure 4: Variation in total expected life-cycle cost against in-creasing number of inspections for each design load
by an optimum number of inspections mopt. This is
because only after an inspection can a repair activ-ity be carried out; an activactiv-ity which will improve β
and lowerPf. Thus, asmincreases, the likelihood of
failure and thusPf,lif eandCF are reduced. However,
there exists a diminishing returns point whenPf,lif e
is low enough to keep CF as a minor component of CET, and for increasing values ofm,CET rises with
the expected cost of inspectionCIN S.
The effect of more onerous traffic load require-ments onCET, as well as the effect of increased
in-spectionsm is shown in Figure 4. In the figure, there exists a gulf between CET for the earlier codes, BS 153andBS 5400, and that for the more modern codes;
BD 21, BD 37, and Eurocode. Despite the required increase in CT for the modern codes, the values of CET are significantly lower, and less dependent on the
number of inspections carried out. This is explained by the effective reduction inCF due to the improvedβ
provided by the increasedAs demanded by the
mod-ern codes. The effect that this increased As has on CET can be seen in Figure 5. It is clear that while there
is very little relative change inCT, there is a
signifi-cant reduction inCET to the point where the number
of inspectionsmloses significant importance. The effect of increasing values ofmandAsonCET
and CF can be visualised in the 3D surface plots in
Figures 6 & 7, respectively. It can be seen in Figure 7 thatCF, and consequentlyPf,lif e, lower to a near zero
point for 10 inspections underEurocodedesignedAs.
It is clear from these figures that the increased demand ofAs, and thus the small relative increase inCT, has a
greater influence onCET than the inspection regime.
This contention can be borne out by evaluating the repair strategies for each bridge, based on the number on inspections that return a minimum value ofCET.
From Figures 4–6, this can be seen to result inmoptof
9, 9, 5, 5, & 2 forBS 153 & Eurocode, respectively. In assessing the repair options available, two strate-gies were adopted: to repair the structure to its origi-nal state after each inspection, and to repair the
struc-Figure 5: Diminishing total expected failure cost for increasing area of steel and increasing number of inspections
Figure 6: Effects of increasing inspections and area of steel on total expected life-cycle cost
Figure 7: Effects of increasing inspections and area of steel on total expected failure cost
Figure 8: Effect of non-optimum repair strategy onβfor uniform interval inspection for each design load
Figure 9: Effect of optimum repair strategy onβ for uniform interval inspection for each design load
ture to its original condition at a time where it would fall below βT before the next scheduled inspection.
For both these strategies, a uniform inspection inter-val was asssumed. In this model, it was assumed that once chloride induced corrosion began in the original structure, it would continue to act onAs immediately
after repair. The result of the first strategy can be seen in Figure 8. Here the bridge is repaired prematurely for those designed under modern standards, resulting in a misallocation of resources, but is seemingly ap-propriate for the bridges designed by the less onerous standards. It is evident from Figure 9 that the second repair strategy results in a more sensible schedule of repair activities, to the point where theEurocode de-signed bridge will maintain a level aboveβT for the
80 year assessment period, under the presented de-terioration model. Furthermore, bridges designed un-derBD 21andBD 37require only one repair activity, whereas those designed underBS 183andBS 5400 re-quire 8 and 9, respectively. This is further evidence of apparent life-cycle cost savings available with a small increase in the initial investment in the structure.
6 CONCLUSIONS
A structural reliability analysis was conducted on a RC slab bridge to assess the effect of changing def-initions of normative traffic loading on safety clas-sifications of the structure. It was observed that ear-lier codes produced less onerous flexural load effects and, as such, resulted a reduced demand for flexu-ral capacity. It was shown that bridges produced un-der loading prescribed by moun-dern standards produced bridges with a higher β assessed under a probabilis-tic load model, and resulted in a significantly reduced expected life-cycle cost, despite the increased initial construction costs due to a higher minimum require-ment for flexural reinforcerequire-ment. This increased initial cost was seen to be significantly offset with a lower expected cost of failure, which is a function of the probability of failure and thus the reliability indexβ.
This gives rise to the question as to whether there is an optimum point at which the initial cost can be in-creased to minimise the total expected life-cycle cost, and is there further variables that can be optimised at the design stage for bridges. Furthermore, the practi-cal ways such a philosophy can be adopted in norma-tive standards are unanswered; be it through refine-ments of partial factors for resistance variables such as the area of steelAsor the compressive strength of
concrete fc, or through the a more holistic increase
in safety factors regarding the applied traffic load-ing. Despite these remaining issues, it is clear from the presented results that there is scope for significant savings through a more conservative approach at the design stage.
ACKNOWLEDGEMENTS
The authors would like to gratefully acknowledge the financial support from theIrish Research Council. REFERENCES
Akg¨ul, F. & D. M. Frangopol (2003). Rating and Reliability of Existing Bridges in a Network.Journal of Bridge Engineer-ing 8(6), 383–393.
Akg¨ul, F. & D. M. Frangopol (2004a). Computational Platform for Predicting Lifetime System Reliability Profiles for Dif-ferent Structure Types in a Network.Journal of Computing in Civil Engineering 18(2), 92–104.
Akg¨ul, F. & D. M. Frangopol (2004b). Lifetime Performance Analysis of Existing Prestressed Concrete Bridge Super-structures.Journal of Structural Engineering 130(12), 1889– 1903.
Akg¨ul, F. & D. M. Frangopol (2005a). Lifetime Performance Analysis of Existing Reinforced Concrete Bridges. I: The-ory.Journal of Infrastructure Systems 11(2), 122–128. Akg¨ul, F. & D. M. Frangopol (2005b). Lifetime Performance
Analysis of Existing Reinforced Concrete Bridges. II: Appli-cation.Journal of Infrastructure Systems 11(2), 129–141. Allen, D. (1975). Limit States Design – A Probabilistic Study.
Canadian Journal of Civil Engineering 1974(2), 36–49. Ang, A. H.-S. & W. H. Tang (2007). Probability Concepts in
Envi-ronmental Engineering(2nd ed.). New York, NY, USA: Wi-ley.
ASCE (2013). 2013 Report Card for America’s Infrastructure. American Society of Civil Engineers, Reston, VA, USA. Benjamin, J. R. & N. C. Lind (1969). A Probabilistic Basis for a
Deterministic Code*.ACI Journal Proceedings 66(11), 857– 865.
Bruls, A., J.-A. Calgaro, H. Mathieu, & M. Prat (1996). ENV 1991 Part 3: The main models of traffic loads on road bridges; Background studies. InIABSE Colloquium: Basis of design and actions on structures; Background and applica-tion of Eurocode 1, Delft, Netherlands, pp. 215–228. IABSE. BSI (1937). BS 153, Part 3: British standard specification for girder bridges - Loads and stresses. British Standards Insti-tution, London, UK.
BSI (1978). BS 5400, Part 2: Steel, concrete and composite bridges - Specification for loads. British Standards Institu-tion, London, UK.
CEN (1994). EN 1991-2: Eurocode 1: Actions on structures. Traffic loads on bridges.
Chryssanthopoulos, M. K., T. V. Micic, & G. M. E. Manzoc-chi (1997). Reliability evaluation of short span bridges. In P. C. Das (Ed.),Safety of Bridges, London, UK, pp. 110–128. Thomas Telford Ltd.
Cooper, D. I. (1997). Development of short span bridge-specific assessment live loading. In P. C. Das (Ed.),Safety of Bridges, London, UK, pp. 64–89. Thomas Telford Ltd.
Cornell, C. A. (1969). A Probability-Based Structural Code*. ACI Journal Proceedings 66(12), 974–985.
Dawe, P. (2003).Traffic Loading on Highway Bridges. Thomas Telford Ltd.
Ditlevsen, O. & H. O. Madsen (1996). Structural Reliability Methods. New York, NY, USA: Wiley.
Ellingwood, B. R. (2005). Risk-informed condition assessment of civil infrastructure: state of practice and research issues. Structure and Infrastructure Engineering 1(1), 7–18. Enright, M. P. & D. M. Frangopol (1998). Probabilistic
anal-ysis of resistance degradation of reinforced concrete bridge beams under corrosion.Engineering Structures 20(11), 960– 971.
Estes, A. C. & D. M. Frangopol (2001). Minimum expected cost-oriented optimal maintenance planning for deteriorating structures: application to concrete bridge decks.Reliability Engineering & System Safety 73(3), 281–291.
Frangopol, D. M. (2011). Life-cycle performance, management, and optimisation of structural systems under uncertainty: ac-complishments and challenges.Structure and Infrastructure Engineering 7(6), 389–413.
Frangopol, D. M. & P. Bocchini (2012). Bridge network perfor-mance, maintenance and optimisation under uncertainty: ac-complishments and challenges.Structure and Infrastructure Engineering 8(4), 341–356.
Frangopol, D. M., K.-Y. Lin, & A. C. Estes (1997). Life-Cycle Cost Design of Deteriorating Structures.Journal of Struc-tural Engineering 123(10), 1390–1401.
Frangopol, D. M. & M. Liu (2007). Maintenance and manage-ment of civil infrastructure based on condition, safety, op-timization, and life-cycle cost.Structure and Infrastructure Engineering 3(1), 29–41.
Frangopol, D. M. & R. Nakib (1991). Redundancy in highway bridges.Engineering Journal 28(1), 45–50.
Frangopol, D. M. & M. Soliman (2016). Life-cycle of structural systems: recent achievements and future directions.Structure and Infrastructure Engineering 12(1), 1–20.
Henderson, W. (1954). British Highway Bridge Loading.ICE Proceedings: Engineering Divisions 3(3), 325–350.
Highways Agency (1984). DMRB, Vol. 3, Section 4, Part 3: BD 21 - The assessment of highway bridges and structures. High-ways Agency, London, UK.
Highways Agency (1988). DMRB, Vol. 1, Section 3, Part 14: BD 37 - Loads for highway bridges. Highways Agency, London,
UK.
Kenshel, O. & A. O’Connor (2009). Assessing chloride induced deterioration in condition and safety of concrete structures in marine environments.Revue europ´eenne de g´enie civil 13(5), 593–613.
Lin, K.-Y. & D. M. Frangopol (1996). Reliability-based op-timum design of reinforced concrete girders. Structural Safety 18(2-3), 239–258.
Lind, N. C. (1972). The Design of Structural Design Norms. Journal of Structural Mechanics 1(3), 357–370.
Melchers, R. E. (1999).Structural Reliability Analysis and Pre-diction(2nd ed.). New York, NY, USA: Wiley.
Mori, Y. & B. R. Ellingwood (1994). Maintaining Reliability of Concrete Structures. II: Optimum Inspection/Repair.Journal of Structural Engineering 120(3), 846–862.
Nowak, A. S. (1993). Live load model for highway bridges. Structural Safety 13(1-2), 53–66.
Nowak, A. S., H. Nassif, & L. DeFrain (1993). Effect of Truck Loads on Bridges. Journal of Transportation Engi-neering 119(6), 853–867.
Pakrashi, V. & C. Hanley (2015). Performance-Based Design of Structures and Methodology for Performance Reliability Evaluation. In A. A\”it-Mokhtar and O. Millet (Eds.), Struc-ture Design and Degradation Mechanisms in Coastal Envi-ronments, Chapter 6, pp. 247–284. London, UK: ISTE Ltd. Pakrashi, V., J. Kelly, & B. Ghosh (2011). Sustainable
Prioritisa-tion of Bridge RehabilitaPrioritisa-tion Comparing Road User Cost. In Transportation Research Board (TRB) 90th Annual Meeting, Washington, D.C., U.S.A.
Rosenblueth, E. & L. Esteva (1972). Reliability Basis for Some Mexican Codes.ACI Special Publication 31, 1–42.
Shah, H. C. (1969). The Rational Probabilistic Code Format*. ACI Journal Proceedings 66(9), 690–697.
Weninger-Vycudil, A., C. Hanley, S. Deix, A. O’Connor, & V. Pakrashi (2015). Cross-asset management for road in-frastructure networks. Proceedings of the ICE - Trans-port 168(5), 442–456.
ˇ
Znidariˇc, A., V. Pakrashi, E. J. O’Brien, & A. O’Connor (2011). A review of road structure data in six European countries. Proceedings of the ICE - Urban Design and Planning 164(4), 225–232.