BAC and Crash Responsibility of
Injured Older Drivers:
This publication is distributed by the U.S. Department of Transportation, National Highway Traffic Safety Administration, in the interest of information exchange. The opinions, findings, and conclusions expressed in this publication are those of the authors and not necessarily those of the Department of Transportation or the National Highway Traffic Safety Administration. The United States Government assumes no liability for its contents or use thereof. If trade or manufacturers’ names or products are mentioned, it is because they are considered essential to the object of the publication and should not be construed as an endorsement. The United States Government does not endorse products or manufacturers.
Suggested APA Format Citation:
Blomberg, R. D, Thomas, F. D., Long, W., Sifrit, K. J., & Korbelak, K. T. (2014, September). BAC and crash responsibility of injured older drivers: An analysis of trauma center data. (Report No. DOT HS 812 062). Washington, DC: National Highway Traffic Safety Administration.
Technical Report Documentation Page
1. Report No.
DOT HS 812 062 2. Government Accession No. 3. Recipient Catalog No.
4 Title and Subtitle
BAC and Crash Responsibility of Injured Older Drivers: An Analysis of Trauma Center Data
5 Report Date
September 2014
6 Performing Organization Code
257
7. Author(s)
Blomberg, R. D, Thomas, F. D., Long, W.,*Sifrit, K. J.,** & Korbelak, K. T. 8 Performing Organization Report No.
257-1
9 Performing Organization Name and Address
Dunlap and Associates, Inc. 110 Lenox Avenue
Stamford, CT 06906-2300
10 Work Unit No. (TRAIS)
11 Contract or Grant No.
DTNH22-09-D-00138 (Task Order 0004)
12 Sponsoring Agency Name and Address
Behavioral Safety Research
National Highway Traffic Safety Administration 1200 New Jersey Avenue SE.
Washington, DC 20590
13 Type of Report and Period
Covered
Final Report 07/12/10 – 02/11/13
14 Sponsoring Agency Code
15 Supplementary Notes
*Dr. Long is with Legacy Emanuel Hospital in Portland, OR.
**Dr. Kathy Sifrit was the Contracting Officer’s Technical Representative (COTR)
16 Abstract
This study examined the distribution of blood alcohol concentrations (BACs) in injured drivers 65 and older and the
relationship of older-driver BAC to driving record and crash responsibility. Researchers conducted a retrospective examination of 11 years of data from the Oregon Trauma Registry. The data showed substantial differences in BAC reporting by age for trauma patients in general, and for those treated because of injuries sustained as a driver in a crash. All patients 65 and older, including crash-involved drivers, had a significantly lower rate of BAC testing than did all other age groups. The Trauma Registry data showed that approximately 10% of all BAC tested, crash-involved drivers over 65 had measurable (positive) BACs. Of those who tested positive, BACs in excess of the illegal per se limit were common; 60.3% had BACs at or above .160 g/dL. Results also showed older drivers with positive BACs at the time of their crashes had notably worse driving records than their crash-involved peers with negative BACs (<0.02). A responsibility analysis revealed that in nearly all cases crash responsibility was attributed to older drivers when those drivers had positive BACs. The much higher responsibility level of older drivers with positive BACs highlights the influence that alcohol produces above and beyond the effects of aging alone. Overall, the study results suggest that drivers over 65 are less likely than their younger counterparts to test positive for alcohol after a crash that requires treatment at a trauma center. When older drivers do test positive, however, their BACs are generally high -- well above the illegal per se limit for driving. Moreover, the strong relationship between older drivers’ BAC and their prior driving records and crash responsibility highlight the need to focus more attention on countermeasures for drinking drivers 65 and older.
17 Key Words
ii
ACKNOWLEDGEMENTS
The authors thank managers and staff at the Legacy Emanuel Hospital and the Legacy Laboratory in Portland, Oregon, for their participation in the design and execution of this
research. We particularly appreciate the efforts of Juan Millan, M.D., in setting up the laboratory procedures. Thanks also go to the people at the Oregon Department of Human Services and the Oregon Department of Motor Vehicles who provided input data for the various analyses.
Although this study could not have been accomplished without the assistance of these people, the findings and conclusions cited here are those of the authors and are not intended to represent the positions of any of the cooperating agencies or people.
Executive Summary Background and Objectives
Many studies have examined the effects of alcohol consumption on older adults, and some have addressed alcohol’s effects on older driver crash risk. Research has generally shown that alcohol is less likely to be a factor in crashes for older drivers compared to younger drivers. While prior studies addressed important facets of the impact of alcohol on older driver safety, a number of research questions remain. The present research focused on filling some of these gaps by addressing the following research questions:
• What proportion of older drivers admitted to hospital trauma centers have positive blood alcohol concentrations?
• What is the average BAC level among those with positive BACs?
• Is the number of previous crashes similar among older drivers with and without positive BAC levels?
• Is the ratio of at-fault to not-at-fault drivers similar between older drivers with and without positive BACs?
Method
The study involved a retrospective examination of the BACs of people admitted to trauma centers in Oregon. The study focused on: (1) ascertaining the prevalence of alcohol in crash-involved older drivers; (2) comparing the driving records and crash culpability of older drivers with and without elevated BACs; and (3) comparing BAC levels of older drivers who were in traffic crashes to other reference groups such as younger crash-involved drivers and older patients admitted for injuries due to falls.
Study Sample. The study sample included 83,841 people 18 and older treated by a trauma unit in Oregon and recorded in the Oregon Trauma Registry for the years 2000 through 2010. Patients 65 and older comprised 15,900 (19.0%) of this total.
Procedure. Researchers identified patients 65 and older from the Trauma Registry, documented characteristics such as the circumstance of their injury (e.g., driver in a crash, falls), and their BACs (if recorded). Researchers compiled additional data for a subsample of 660
iv Results
BACs. Not all Trauma Registry patients’ records included BAC measures. Table ES-1 shows substantial differences in the percentage of trauma patients with recorded BACs by age group. Less than 2/3 of Trauma Registry records for drivers 65 and older included BACs, substantially lower than the percentage for other adult trauma patients.
Table ES-1
BAC Reporting by Age
Age
Percentage of Trauma Patients
With BAC
Reported Total Patients
Percentage of Drivers With BAC
Reported Total Drivers
18-20 75.5 7,329 77.5 1,739
21-34 78.8 23,689 84.4 4,921
35-49 76.7 20,892 82.3 3,854
50-64 69.9 16,031 74.8 2,970
65+ 53.2 15,900 65.7 2,160
Older drivers with recorded BACs were somewhat less likely to have positive BACs as compared to patients of similar age treated for fall-related injuries (see Table ES-2).
Table ES-2
Age 65 and Older Percentage Alcohol Positive by Circumstance of Injury Injury Circumstance Alcohol Positive Percentage Group n
Driver in Crash 10.1 1,392
Fall 13.3 4,135
Total 12.5 5,527
Note: These data include only patients with recorded BACs.
Table ES-3 shows the average BACs for drivers and fall victims 65 and older who had positive BACs. The mean BACs were similar across circumstances of injury with drivers having a mean of .185 grams per deciliter (g/dL). This mean was higher than that for the 18- to 20-year-old drivers in the study (who could not legally drink), but lower than the means for drivers in the middle age groups. Roughly 60% of the drivers over 65 who tested positive for alcohol (about 6% of all injured drivers over 65 with reported BACs) had BACs above .160. The other injury circumstances for older patients showed similar distributions with most patients whose alcohol tests were positive having high BACs. The distribution of BACs for drivers in the study sample was similar to that found for data drawn from the Fatality Analysis Reporting System (FARS) for Oregon and the United States as a whole.
Table ES-3
Age 65 and Older Mean BACs for Alcohol Positive Patients by Injury Circumstance
Injury Circumstance n M SD SE 95% CI for M
Driver in Crash 141 .185 .096 .008 [.169, .201]
Fall 551 .193 .091 .004 [.185, .200]
Total 692 .191 .092 .004 [.184, .198]
Driving record. Researchers compared the driving records of people over 65 with positive BACs, a subset of people tested with and without measurable BACs, and a selection of those with no BAC reported in the Trauma Registry. For most drivers, the records included events that occurred both before and after the crashes that resulted in treatment at the trauma center. Among the group with positive BACs, 62.1% had at least 1 conviction compared to only 36.8% of the tested group with no measurable BAC and 36.6% of the group that had no BAC reported. Analysis of data for those older drivers with BAC reported showed drivers at BACs of .120 and higher had a much greater likelihood of having a conviction on their records than those at lower BACs.
Among the positive BAC group, 53% had at least 1 suspension on their records compared to 26.4% of the group with no measurable BAC and 20.7% of those with no BAC reported. Of those drivers with positive BACs, a higher BAC was associated with a much greater likelihood of having at least 1 recorded suspension. Speeding violations also showed an association with increased driver BAC, but crashes did not.
Crash responsibility. Table ES-4 shows the relationship between driver BAC and crash responsibility based on information from the police crash report without reference to the driver’s BAC. The researcher judged almost all (96.0%) of the drivers with positive BACs (.02 and above) as responsible for their crashes compared to 77.8% of the drivers with negative BACs (<0.020) and 78.4% of drivers with no BAC reported.
Table ES-4
Age 65 and Older Percentage Crash Responsible by BAC Category
BAC Category Responsible
Negative BAC 77.8
vi
Results also showed older drivers with positive BACs at the time of their crashes had notably worse driving records than their crashes involved peers without a measurable BAC. While this should not come as a surprise to anyone conversant with prior research on alcohol and highway safety, it supports the notion that alcohol cannot be ignored as a factor in older drivers’ crashes.
Crash responsibility was largely attributable to an older driver when that driver had a positive BAC. Moreover, elevated responsibility levels of older drivers with positive BACs as compared to those without a measurable BAC highlight effects of alcohol that extend beyond the effects of aging alone.
Overall, the study results suggest that trauma center staff is less likely to test BACs in drivers over 65 than their younger counterparts after crashes that requires treatment at trauma centers. Among those whose BAC were recorded, drivers over 65 were less likely than their younger counterparts to test positive for alcohol. However, when older drivers did test positive, their BACs were generally high, well above the illegal per se limit for driving. Moreover, the strong relationship between older drivers’ BACs, poor prior driving records, and high crash responsibility highlight the need to focus more attention on developing countermeasures for drinking drivers 65 and older.
TABLE OF CONTENTS
Acknowledgements ... ii
Executive Summary ... iii
Introduction and Background ... 1
Literature Review... 2
Retrospective Study of the Oregon Trauma Registry ... 3
Method ... 3
IRB Reviews and Approvals ... 3
Study Sample ... 3
Data Sources ... 3
Results ... 4
FARS data for comparison... 11
Driver Records ... 12
Convictions, suspensions, and revocations ... 14
Responsibility Analysis ... 19 General Discussion ... 26 Limitations ... 27 References ... 28 Appendix ... 29
viii
LIST OF TABLES
Table ES-1 BAC Reporting by Age ... iv
Table 1. Number of Patients in Trauma Registry by Age Category ... 5
Table 2. BAC Reporting by Age for All Trauma Patients and Injured Drivers ... 6
Table 3. Age 65 and Older Percentage Alcohol Positive by Circumstance of Injury ... 8
Table 4. Percentage of Drivers Testing Positive for Alcohol by Age Group ... 9
Table 5. Percentage 65 and Older With Positive BAC by Injury Circumstance and BAC Category ... 9
Table 6. Percentage of Drivers With Positive BAC by Age Group and BAC Category ... 10
Table 7. Age 65 and Older Mean BACs for Alcohol Positive Patients by Injury Reason ... 10
Table 8. Mean BACs for Drivers by Age Group ... 11
Table 9. FARS 2000-2009 Percentage of BAC-Positive Oregon Drivers Involved in Fatal Crashes ... 12
Table 10. FARS 2000-2009 Percentage of BAC-Positive United States Drivers Involved in Fatal Crashes ... 12
Table 11. Percentage of Drivers by BAC Category With at Least One Conviction ... 14
Table 12. Mean Number of Traffic Convictions on Record by BAC Level ... 14
Table 13. Percentage of Drivers With at Least One Suspension on Record by BAC Level ... 15
Table 14. Mean Number of Suspensions on Record by BAC Level ... 16
Table 15. Percentage of Drivers With at Least One Mention of DUI by BAC Level ... 16
Table 16. Mean Number of DUI Mentions on Record by BAC Level ... 17
Table 17. At Least One Speeding Conviction on Record by BAC Level ... 17
Table 18. Percentage of Drivers With at Least One Crash on Record by BAC Level ... 18
Table 19. Mean Number of Crashes on Record by BAC Level ... 18
Table 20. Percentage ofof Male and Female Drivers at Each BAC Level for Crash Report Data ... 21
Table 21. Percentage of Crash Types in Crash Reports ... 22
Table 22. Percentage of Crashes by Time of Day ... 23
Table 23. Percentage of Drivers by Terhune Scale Responsibility Codes ... 23
Table 24. Percentage of Drivers in 100-Point Responsibility Measure Categories ... 23
Table 25. Percentage Responsible by BAC Category ... 24
Table 26. 100-Point Responsibility Scale Means by BAC Category ... 25
LIST OF FIGURES
Figure 1. BAC category by age group………7
1
Introduction and Background
This study consisted of a literature review that focused on alcohol use by drivers 65 and older and a retrospective study of the data in the Oregon Trauma Registry informed by the literature review. The study was primarily concerned with:
• Ascertaining the prevalence of alcohol in crash-involved older drivers admitted to a trauma center;
• Comparing the driving records and crash culpability of older drivers with elevated blood alcohol concentrations (BACs) to those of older crash-involved drivers without
measurable BACs; and
• Comparing BACs of older drivers who were in traffic crashes to other reference or “control” groups including non-crash-involved older patients (e.g., admitted for falls) and younger drivers admitted to trauma centers after crashes.
The objective of the study was to determine the level of alcohol in the systems of drivers 65 and older injured as a result of vehicle crashes in which they were driving. The study
addressed the following research questions:
• What proportion of older drivers admitted to hospital trauma centers has positive BACs?
• What is the average BAC among those with positive BACs?
• Is the number of previous crashes similar among older drivers with and without positive BACs?
• Is the ratio of at fault to not at fault drivers similar between older drivers with and without positive BACs?
Literature Review
In preparation for the study, researchers examined sources for research documents that detailed findings related to older drivers and alcohol. Topics included the general health effects of alcohol for older adults, the impact of alcohol on older driver vehicle crashes, and the effects on older drivers of legislation limiting the BAC at which driving is illegal per se. Databases that were searched included:
• TRIS, • PsycInfo, • PubMed, • Scopus,
• Academic Search Premier, • ABI/Inform Global, • NTIS, and
• NHTSA’s Behavioral Research Library.
After an initial search of the databases, a researcher reviewed the abstracts of selected documents and identified those relevant to the study.
Many studies have examined the impact of alcohol consumption on older adults, and some examined alcohol’s role in motor vehicle crashes relative to driver age. Research has generally shown that alcohol is less likely to be a factor in older driver crashes compared to younger driver crashes (Kim et al., 2010; Peck et al., 2008; Wilke, Puschel, & Edler, 2009). Research has, however, shown older drivers to be more likely to drive impaired due to the effects of psychoactive medications or mixing such medications with alcohol (Moore, Whiteman, & Ward, 2007; Moos, Brennan, Schutte, & Moos, 2010; Rapoport et al., 2009). Most relevant to the current study, two prior studies (Safih et al., 1999, and Selway et al., 2008) examined the BACs of older drivers admitted to trauma centers. Safih et al. (1999) found that 5.9% of older drivers admitted to the studied trauma centers had BACs over the illegal per se limit. Selway et al. (2008) found that 8.5% of all older patients and approximately 5.5% of those injured in motor vehicle crashes admitted to the studied trauma centers tested positive for alcohol.
While these prior studies addressed important facets of the impact of alcohol on older driver safety, a number of research questions remained unanswered. The present research efforts were therefore focused on filling some of these gaps.
3
Retrospective Study of the Oregon Trauma Registry
This study involved a retrospective examination of the BACs of people admitted to trauma centers in Oregon. The study focused on: (1) ascertaining the prevalence of alcohol in crash-involved older drivers; (2) comparing the driving records and crash culpability of older drivers with elevated BACs to those of BAC-tested older crash-involved drivers without
measurable BACs; and (3) comparing BAC levels of older drivers who were in traffic crashes to other reference groups such as non-crash-involved older patients (e.g., admitted for falls) and younger drivers admitted to trauma centers after crashes.
Researchers selected a retrospective study for trauma patients because of the relatively low numbers of injured drivers 65 and older in any single year’s admissions. Attempting a large-scale prospective study in trauma centers would have required multiple years of sampling that would have extended beyond the time and resources of this study. Moreover, the Oregon Trauma Registry maintained by the Oregon Department of Human Services (DHS) was available and contained data (including BAC measurements) collected and recorded for the 11 years from 2000 to 2010.
Method IRB Reviews and Approvals
Before DHS could release any Trauma Registry data, its Institutional Review Board (IRB) required a full review of the retrospective study design and methods. Project staff
submitted required forms documenting the study methods presented below and met with the IRB to review and explain the protocol. The DHS IRB approved the submission package and agreed to release the necessary Trauma Registry data subject to the researchers’ agreement to adhere to all prevailing Oregon confidentiality requirements. The Legacy Hospital IRB also reviewed and approved the study protocol based on the same materials submitted to the DHS IRB.
Study Sample
The study sample participants included all people 18 and older treated by a trauma center in Oregon and recorded in the Oregon Trauma Registry for the years 2000 to 2010. While the study focused on crash-involved drivers 65 and older, researchers used distributions of BACs for other age groups and other trauma injury circumstances for comparison purposes.
Data Sources
Trauma Registry Data. The statewide Oregon Trauma Registry managed by the DHS captured data on all patients, including those injured in a traffic crash, treated at trauma centers in the State. A BAC based on a blood draw was part of the standard data record whenever possible and was a specific State requirement for patients injured as drivers in a traffic crash. Researchers limited their examination to the 2000 – 2010 timeframe because it represented a period with no major changes in the structure of the database, criteria for inclusion in the
database, or measurement of BAC. Also, data prior to 2000 were not considered since the traffic environment may have changed substantially.
Driver Records Requests. One of the research questions dealt with whether the crash and violation history of older drivers differed as a function of BAC at the time of their crashes. To address this question, research staff used information from the Trauma Registry to access driver records (abstracts of driving history) from the Oregon Department of Motor Vehicles’ (DMV) electronic files on a subset of the total study sample. The study assigned each participant a unique identification number. Researchers then sent this information to the DMV in an Excel file on an encrypted data storage device. No medical or other information from the Trauma Registry accompanied this information and study identification numbers. All personnel involved with the information request strictly adhered to State confidentiality requirements. The DMV searched their records and securely transmitted the driver records and participant number information with identifying information redacted back to study staff following their standard procedures that complied fully with State confidentiality requirements. Researchers then combined the driver records data with the Trauma Registry data. This combined file, which researchers indexed only by study identification number, allowed researchers to examine driver crash and violation records relative to older drivers’ BAC information found in the Trauma Registry.
Police Crash Report Requests. Another research question dealt with a possible link between elevated BAC and older driver crash fault and/or crash circumstances. To address this question, researchers reviewed police crash reports for the specific crashes that resulted in the subset of older drivers’ admission to the trauma centers. Researchers used relevant driver and crash information (e.g., date, time, and location of the crash) from the Trauma Registry to access police crash reports from the DMV files. DMV agreed to provide the needed records in
accordance with prevailing State procedures and requirements including statutory payment for the service. The State provided all records in paper form with all personal identification information redacted as per DMV’s standard operating procedure and Oregon regulations.
Results
Results from this study addressed the BAC distributions of those injured, prior driver records as a function of BAC, crash responsibility as a function of BAC, and a comparison with distributions from NHTSA’s Fatality Analysis Reporting System (FARS).
5
center) causing the system to create a new entry even though the person was being treated for injuries related to the same event. Also, some people received multiple treatments for the same event (e.g., a person returned a week after the event with new symptoms). Researchers identified these duplicate cases and removed those that provided redundant information. The final dataset included 83,841 registry entries with patient age information. Table 1 shows the number of patients in the final trauma registry dataset by age groupings created for this study. A person could still appear in the database more than once if he or she had been injured in multiple events that required separate treatment admissions.
Table 1.
Number of Patients in Trauma Registry by Age Category
Age Total Group n Percentage of Total
18-20 7,329 8.7 21-34 23,689 28.3 35-49 20,892 24.9 50-64 16,031 19.1 65+ 15,900 19.0 Total 83,841 100.0
Researchers examined data for patients 65 and older by the injury circumstance that resulted in their admission to a trauma center as determined from the trauma registry record for the patient. The classification of injury circumstances included:
• Driver in a crash;
• Motorcycle driver in a crash on a roadway;
• Bicycle rider/driver in a crash on a roadway;
• Pedestrian involved in a crash on or near a roadway
• Motor vehicle passenger (including motorcycle passengers) involved in a crash;
• Unknown vehicle occupant location in a traffic crash;
• Fall;
• Other trauma (e.g., stabbing, gunshot, blunt trauma, ATV rider, recreational motorcycle riding off-road);
• Suicide; and
• Other medical conditions or unknown reason for admission.
Males greatly outnumbered females across reasons for entry into a trauma center for all age groups except for those 65 and older. Over 70% of patients 64 and younger were male compared to 51% males for the 65 and older group. With regard to drivers, the difference across the age groups was less pronounced; 63% of drivers 64 and younger were male compared to 56% males for the 65 and older group.
BAC data in the Trauma Registry. Not every patient admitted to trauma centers had a BAC measure reported in the registry. Analysis of the rate of BAC reporting by age group showed substantial differences in BAC reporting by age for trauma patients in general, χ2(4, N = 83841) = 3,583.13, p < 0.001, and for those treated because of injuries sustained as a driver in a
crash, χ2(4, N = 15644) = 369.69, p < 0.001 (Table 2). All patients 65 and older as well as drivers in the same age range had a significantly lower rate of BAC testing than did all other age groups (ps < 0.05).1
Table 2.
BAC Reporting by Age for All Trauma Patients and Injured Drivers
Age Percentage of
Trauma Patients With BAC
Reported
Total Patients Percentage of Drivers With BAC
Reported Total Drivers 18-20 75.5 7,329 77.5 1,739 21-34 78.8 23,689 84.4 4,921 35-49 76.7 20,892 82.3 3,854 50-64 69.9 16,031 74.8 2,970 65+ 53.2 15,900 65.7 2,160 Total 71.4 83,841 78.7 15,644
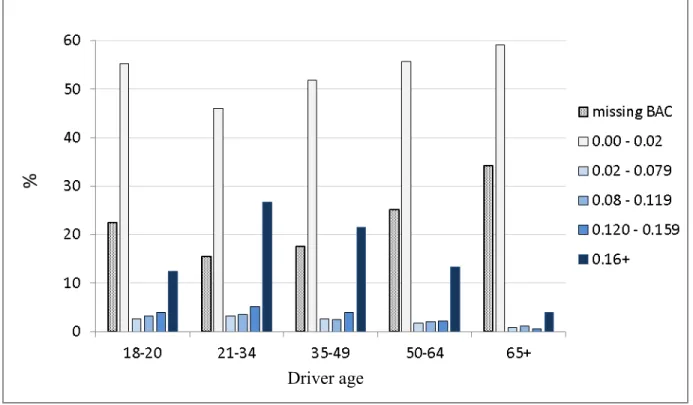
Figure 1 presents BAC category by age for drivers admitted for crash injuries. Note that this figure includes those with missing BAC data. Given the difference in percentages of missing data among age groups, please take the level of missing data into account when interpreting the findings that follow.
7
Figure 1. Percentage of drivers by reported BAC and age group.
Researchers intended to limit the examination of BAC measurements to only those taken within 3 hours of the event that led to admission in order to avoid the possibility of significant elimination of alcohol from the patient’s blood between the time of crash and the blood draw. Unfortunately, most trauma registry entries did not contain the time of injury; they only included the date of injury, arrival date, and arrival time at the treatment center. Researchers therefore decided to include only BAC data for which the injury date was the same as the arrival date at the trauma center, or if the date of injury was the day prior to the arrival date and the arrival time at the trauma center was before 3 a.m. This approach likely led to the inclusion of some BAC measurements that exceeded the desired 3-hour window after the event that led to admission, and may have resulted in some underestimation of BACs.
An investigation into the data and BAC measurement protocols at the treatment centers revealed that BACs below .020 g/dL (grams per deciliter) but above .000 were likely to indicate “no detectable alcohol” since they fell within the error limits of some locations’ measurement equipment and/or likely resulted from imprecise collection, processing, and assay protocols. Therefore, analysts considered any BAC below .0202 as essentially a .000, or negative, BAC and those .020 and greater as positive BACs for all analyses. Prior researchers have used this
approach to define BACs (e.g., Selway, Soderstrom, & Kufera, 2008).3 Analyses excluded BACs that exceeded .599 since such high BACs are likely not valid or represent extreme outliers that
2 Oregon statute § 813.300(4) defines a BAC as “‘percent by weight’ of alcohol … based on grams of alcohol per
100 cubic centimeters of blood,” but reported here as grams per deciliter or g/dL.
3 Much research, including the study by Selway et al. (2008), refers to unmeasurable and measurable BACs as
negative and positive BACs, respectively.
might skew the results. For this report, BACs less than .020 were termed “negative,” and those .020 and greater were considered “positive.”
Positive BAC, injury circumstance, and age. Table 3 displays the percentages of patients 65 and older who had positive BACs for each of the coded injury circumstances. The overall chi square test was statistically significant, χ2(9, N = 7,868) = 59.85, p < 0.001, indicating differences in the rates of positive BACs by injury circumstance. The only group that differed significantly from the alcohol positive drivers, who had 10.1% with positive BACs, was the passengers at 3.1% (p < 0.05). Since the study focused on drivers 65 and older in crashes, later tables in this report only present that circumstance of injury and falls, the most frequent circumstance, for comparison purposes.
Table 3.
Age 65 and Older Percentage Alcohol Positive by Circumstance of Injury
Circumstance of Injury Alcohol Positive Percent Total Group n*
Driver in a crash 10.1 1,392
Motorcycle driver in a crash 10.3 175
Bicycle rider in a crash 5.3 114
Pedestrian in a crash 11.2 356
Motor vehicle passenger in a crash 3.1 426
Fall 13.3 4,135
Other trauma 13.0 469
Suicide 13.8 87
Vehicle occupant (unknown location) in a crash 8.0 586
Other/unknown circumstance 9.4 128
Total 11.5 7,868
9
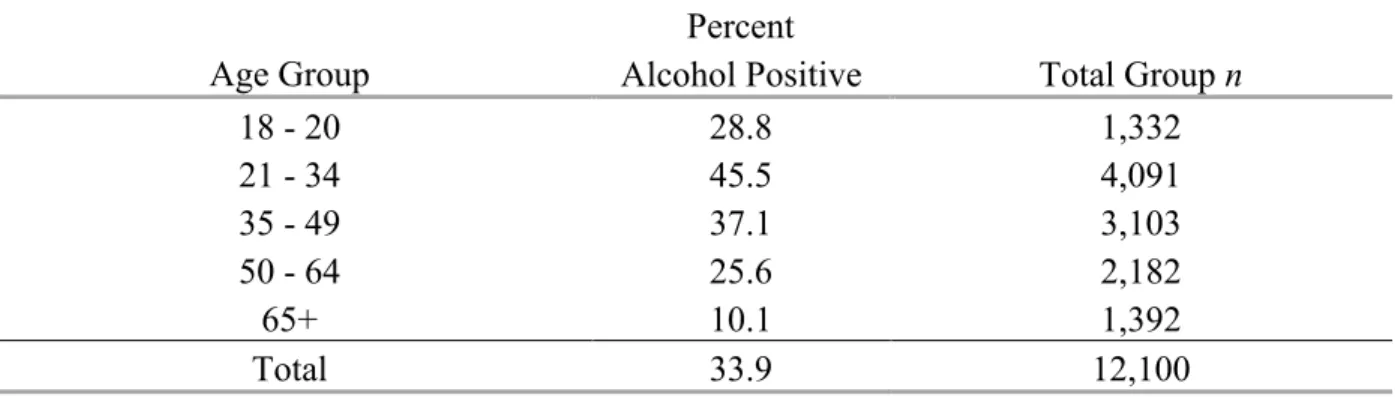
Table 4 shows the percentages of alcohol positive drivers by age group. The overall chi square test was significant, χ2(4, N= 12,100) = 695.17, p < 0.001. The percentage of drivers with positive BACs was significantly lower for those 65 and older than for each other age group, including those 18 to 20 years old, who were too young to drink legally.
Table 4.
Percentage of Drivers Testing Positive for Alcohol by Age Group
Age Group Alcohol Positive Percent Total Group n
18 - 20 28.8 1,332 21 - 34 45.5 4,091 35 - 49 37.1 3,103 50 - 64 25.6 2,182 65+ 10.1 1,392 Total 33.9 12,100
Table 5 displays the distribution of BACs for those patients 65 and older who had positive BACs by the two injury circumstances of interest. As shown in the table, a large
percentage of positive BACs were above .160 for both injury circumstances. The groups did not differ significantly on this measure, χ2(3, N= 692) = 5.65, p = 0.130.
Table 5.
Percentage 65 and Older With Positive BAC by Injury Circumstance and BAC Category BAC Category
Injury Circumstance .020 - .079 .080 - .119 .120 - .159 .160 +
Driver in Crash 12.1 18.4 9.2 60.3
Fall 12.0 11.4 12.7 63.9
Table 6 presents BAC distributions for drivers with positive BACs by age group. The overall Chi Square statistic was significant, χ2(12, N= 4,096) = 51.75, p < 0.001, indicating differences in the distributions by age group. The oldest group did not differ significantly from other groups for the .020-.079, .120-.159, and .160+ BAC categories. However, the .080 – .119 BAC category included a significantly larger proportion of drivers 65 and older than drivers in the 21-34 and 35-49 age groups.
Table 6.
Percentage of Drivers with Positive BAC by Age Group and BAC Category BAC Category Age Group .020 - .079 .080 - .119 .120 - .159 .160 + 18 - 20 11.7 14.4 18.0 55.9 21 - 34 8.3 9.0 13.4 69.4 35 - 49 8.5 8.1 12.8 70.6 50 - 64 8.8 10.4 11.1 69.8 65+ 12.1 18.4 9.2 60.3 Total 8.9 9.8 13.2 68.2
An independent samples t-test comparing the mean BACs of older drivers to the mean BACs of older patients injured in falls (Table 7) showed no significant difference, t(690) = 0.886, p = 0.376.
Table 7.
Age 65 and Older Mean BACs for Alcohol Positive Patients by Injury Reason
Injury Reason n M SD SE 95% CI for M
Driver in Crash 141 .185 .096 .008 [.169, .201]
Fall 551 .193 .091 .004 [.185, .200]
Total 692 .191 .092 .004 [.184, .198]
When comparing the mean BACs of drivers of motor vehicles by age group, the omnibus F-Test showed significant differences among the age groups, F(4, 4091) = 16.35, p < 0.001 (Table 8; Figure 2). Post-hoc comparisons revealed the mean BAC for the 65 and older group was significantly lower than that of the 35- to 49-year-olds (p = .012) and 50- to 64-year-olds (p = .028).4
11 Table 8.
Mean BACs for Drivers by Age Group
Age n M SD SE 95% CI for M 18 - 20 383 .172 .077 .004 [.165, .180] 21 - 34 1,863 .197 .080 .002 [.194, .201] 35 - 49 1,150 .209 .089 .003 [.204, .214] 50 - 64 559 .208 .092 .004 [.201, .216] 65 + 141 .185 .096 .008 [.169, .201] Total 4,096 .199 .086 .001 [.197, .202]
While these analyses showed the means to be statistically different, the differences may not be meaningful at such high average BACs and given a possibly higher impairing effect of BAC on older adults. A table in the Appendix provides the mean BACs by age group for all circumstances of injury.
Figure 2. BAC by driver age among those with positive BAC. FARS data for comparison. For comparison purposes, and to explore the
generalizability of the findings from the Trauma Registry, researchers examined FARS data to determine what percentage of drivers involved in fatal crashes had a measured positive BAC
(BAC > .020).5 Please note that the study used FARS data for comparing BAC rates. FARS data cannot be used to determine culpability in a crash. Table 9 displays the percentage of Oregon drivers in FARS involved in fatal crashes with a positive alcohol measurement by age group. Table 10 shows the same information for the entire United States. The data for Oregon and the United States as a whole follow a pattern very similar to that observed for the studied Trauma Registry patients presented in Table 4. This is not surprising given the high injury severity of people with data in the Trauma Registry.
Table 9. FARS 2000-2009 Percentage of BAC-Positive Oregon Drivers Involved in Fatal Crashes
Age Group Alcohol Positive Percent Total Group n
18 - 20 28.35 321 21 - 34 50.00 886 35 - 49 46.24 705 50 - 64 28.94 539 65+ 9.50 421 Total 36.77 2,872 Table 10. FARS 2000-2009 Percentage of BAC-Positive United States Drivers Involved in Fatal Crashes
Age Group Alcohol Positive Percent Total Group n
18 - 20 37.51 23,356 21 - 34 52.99 68,809 35 - 49 44.50 50,619 50 - 64 27.85 30,460 65+ 10.04 22,946 Total 40.03 196,190 Driver Records
13 • Negative BAC • .020 – .079 • .080 – .119 • .120 – .159 • .160 and higher
The analyses for these drivers focused on convictions for traffic violations, license suspensions, and reported crashes. The Oregon DMV indicated it purged the driver abstracts of non-felony arrests and convictions approximately 5 years after the events were posted.
Therefore, only drivers over 65 who were injured from 2006 through 2010 in Oregon and who had enough data available from the Trauma Registry to access their abstract of driving record were included in the subset for analysis. For most drivers, the abstract included events that occurred both before and after the incident that triggered the driver’s inclusion in this study. The analysis excluded drivers injured in other States but treated in Oregon since their crashes would not reliably appear on Oregon driving records.
The Trauma Registry included 976 drivers 65 or older for the years 2006 through 2010 who met the time inclusion criteria. Of these, 500 (51.2%) had a BAC measure reported and 442 (88.4%) had a crash in Oregon and sufficient demographic information recorded in the Trauma Registry to access an Oregon driver abstract. Researchers randomly sampled half of the 476 “No BAC Reported” group (238) to include for comparison purposes; 218 (91.6%) of this sample had sufficient information available to request a driver abstract.
Thus, researchers requested abstracts for 660 drivers to DMV and received 646 (97.9%) abstracts. Fifty-seven (8.8%) of the retrieved records were for Trauma Registry patients
classified as motorcycle drivers, and 7 (12.3%) of these fell into the Positive BAC group. Because this small number of motorcyclists would not support a separate analysis, researchers combined the data for motorcycle operators and motor vehicle drivers.
Thus, the DMV provided 646 abstracts that included:
• 66 (100%) of Positive BAC drivers (including motorcyclists),
• 367 (97.6%) of the Negative BAC drivers, and
• 213 (97.3%) of the 218 No BAC Reported drivers
Researchers entered each conviction, suspension, revocation, crash, or other entry on the driver abstract record into a database for analysis and combined these data with the information from the Trauma Registry to create the analysis groups of interest.
An examination of demographic data showed the Positive BAC group had a higher proportion of males (75.8%) than the Negative BAC (65.7%) and No BAC Reported (59.6%) groups, χ2(2, N= 646) = 6.09, p = .048. There was also a significant mean age difference,
F(2, 643) = 9.62, p < 0.001, with the Positive BAC group (M = 70.68, SD = 6.31) having a lower average age than both the Negative BAC group (M = 74.67, SD = 7.45) and No BAC Reported group (M = 74.94, SD = 7.07). Each group had a minimum age of 65 with a maximum age of 90 for the Positive BAC, 94 for the Negative BAC group, and 93 for the No BAC Reported group.
The predominant race/ethnicity listed for all groups was White with 89.4% for the Positive BAC group, 91.0% for the Negative BAC group, and 84.5% for the No BAC Reported group. The differences in race/ethnicity were not significant, p > 0.05.
Convictions, suspensions, and revocations. Oregon can cite a driver for a variety of traffic violations. For the sample studied here, 62.1% of the Positive BAC group had at least 1 conviction, which was significantly higher than the percentage for the Negative BAC group, (36.8%), or the No BAC Reported Group at group (36.6%), χ2(2, N= 646) = 16.02, p < 0.001. A further breakdown of data for people with a reported BAC showed drivers at a BAC level of .160 and higher were much more likely to have a conviction on their record than those at lower BACs (Table 11). When breaking down the data in this manner, the small cell counts for some of the BAC levels limit the validity of any inferential statistical tests. Therefore, no inferential statistics are presented for these subgroups.
Table 11.
Percentage of Drivers by BAC Category With at Least One Conviction
BAC Category At Least 1 Conviction Total Group n
Negative BAC 36.8 367 .020 - .079 33.3 6 .080 - .119 30.8 13 .120 - .159 50.0 6 .160 + 78.0 41 Total 40.6 433
The data also showed a large difference in the average number of convictions for the Positive BAC group versus the other groups, F(2, 643) = 18.54, p < 0.001. Post hoc comparisons showed the Positive BAC group (M = 1.65, SD = 1.84) had a higher average number of
convictions compared to the Negative BAC group (M = .61, SD = 1.23) and the No BAC Reported group (M = 0.67, SD = 1.18). Standard deviations for some groups exceed the means, indicating a non-normal distribution – some individuals had many convictions and others had few or none. Please interpret statistical analyses on these data with caution because of this skewed pattern of results. An examination of the mean number of convictions for those with BACs reported showed that drivers with BAC from .120 to .159 and those with BACs of .160 and higher had a much higher average number of convictions than drivers at lower BAC levels (Table 12).
15
The next step looked at suspensions and revocations. Oregon has a number of reasons for suspending a driver’s license, and, unlike convictions, the DMV did not purge records of
suspensions on a regular basis. Suspension records in the study data went back to 1992 when the State instituted the current electronic records system. After reviewing the reasons for suspension in this sample of driver records, researchers determined a driver’s record could contain multiple suspensions related to the same initial event. For example, a person may have a suspension for a DUI conviction, followed by a suspension related to the crash for which the DUI was issued, as well as a suspension for failing to initiate follow-up action (e.g., failure to appear in court; failure to install an interlock device) for the same event. A person may also have multiple medical suspensions, or suspensions for failing to report a crash. Researchers could not reliably determine which suspensions arose from the same event. Therefore, the analysis retained all suspensions on each abstract. These factors should be considered when examining the results presented below. The first analysis shows the proportion of drivers in each BAC group who had at least 1 suspension. This is followed by an examination of the average number of suspensions for the groups of interest.
Fifty-three percent of the Positive BAC group each had at least 1 suspension on record compared to 26.4% of the Negative BAC group and 20.7% of the No BAC Reported group. The Positive BAC group included a significantly higher percentage with at least 1 suspension than either the Negative BAC or No BAC Reported groups, χ2(2, N= 646) = 26.92, p < 0.001. Of those drivers with positive BACs, a higher BAC appeared associated with a greater likelihood of having at least one suspension on the abstract, but small cell counts limited the reliability of any statistical test (Table 13).
Table 13.
Percentage of Drivers With at Least One Suspension on Record by BAC Level
BAC Category At Least 1 Suspension Group Total n
Negative BAC 26.4 367 .020 - .079 0.0 6 .080 - .119 7.7 13 .120 - .159 66.7 6 .160 + 73.2 41 Total 30.5 433
There was also a large difference in the average number of suspensions on record for the Positive BAC group versus the other groups, F(2, 643) = 55.57, p < 0.001. The Positive BAC group (M = 2.39, SD = 3.31) had a higher average number of suspensions compared to the
Negative BAC group (M = 0.50, SD = 1.04) and No BAC Reported group (M = 0.37, SD = 0.98), ps < 0.001. An examination of the mean number of suspensions for those with a BAC reported showed that drivers with a BAC of .120 and higher had a higher average number of suspensions than drivers at lower BAC levels (Table 14). Small cell counts precluded calculating inferential statistics.
Table 14.
Mean Number of Suspensions on Record by BAC Level
BAC Category n M SD SE 95% CI for M
Negative BAC 367 0.50 1.04 0.05 [0.39, 0.60] .020 - .079 6 0.00 0.00 0.00 [0.00, 0.00] .080 - .119 13 0.08 0.28 0.08 [-0.09, 0.24] .120 - .159 6 1.83 2.64 1.08 [-0.94, 4.60] .160 + 41 3.56 3.59 0.56 [2.43, 4.69] Total 433 0.79 1.74 0.08 [0.62, 0.95]
Few drivers in the sample had a license revocation on record; 4.5% of the Positive BAC group had at least 1 revocation on record compared to 0.3% of the Negative BAC group and none of the No BAC Reported group.
The abstracts referenced DUIs in a variety of forms. They appeared as convictions, suspensions, or as violations dismissed for completion of a diversionary program. Since convictions could be purged or dismissed because a person attended a diversionary program, researchers decided to combine all mentions of a DUI into a single category. Results showed a statistically significant difference, χ2(2, N= 646) = 235.67, p < 0.001, in any mention of a DUI on the driving record by BAC groups. Fifty percent of the Positive BAC group had at least one mention of a DUI on their records compared to 1.4% for the Negative BAC group and 1.4% for the No BAC Reported group (Table 15). Small cell counts precluded calculating inferential statistics.
Table 15.
17
There was also a large difference in the average number of DUI mentions on record for the Positive BAC group versus the other groups, F(2, 643) = 99.20, p < 0.001. Comparisons showed the Positive BAC group (M = 1.56, SD = 2.27) had a significantly higher average number of DUI mentions than the Negative BAC group (M = 0.04, SD = 0.43) and No BAC Reported group (M = 0.04, SD = 0.44), ps < 0.001. Drivers with BACs of .120 and above had a higher average number of DUI mentions on record than the lower BAC levels (Table 16). As previously noted, these averages do not necessarily represent unique events since a person could have multiple mentions of a DUI related to the same event.
Table 16.
Mean Number of DUI Mentions on Record by BAC Level
BAC Category n M SD SE 95% CI for M
Negative BAC 367 0.04 0.43 0.02 [-0.00, 0.08] .020 - .079 6 0.00 0.00 0.00 [0.00, 0.00] .080 - .119 13 0.23 0.44 0.12 [-0.03, 0.50] .120 - .159 6 1.50 2.07 0.85 [-0.68, 3.68] .160 + 41 2.22 2.53 0.40 [1.42, 3.02] Total 433 0.27 1.11 0.05 [0.17, 0.38]
For speeding violations, 24.2% of the Positive BAC group had at least 1 conviction compared to 14.2% of the Negative BAC group and 22.5% of the No BAC Reported group. The difference was statistically significant, χ2(2, N= 646) = 8.38, p = 0.015 with the No BAC
Reported group being significantly higher than the Negative BAC group (p < 0.05). A further breakdown of data for those people with a BAC level reported showed an inconsistent pattern (Table 17).
Table 17.
At Least One Speeding Conviction on Record by BAC Level
BAC Category % with at Least 1 Speeding Total
Negative BAC 14.2 367 .020 - .079 16.7 6 .080 - .119 30.8 13 .120 - .159 50.0 6 .160 + 19.5 41 Total 15.7 433
For average number of speeding convictions, there was an overall statistically significant difference among the groups, F(2, 643) = 4.02, p = 0.018; however, none of the Post Hoc
comparisons reached statistical significance. This is likely due to the small means combined with relatively large standard deviations.
Few drivers had seat belt convictions on their records. For the Positive BAC group, 3.0% had at least 1 seat belt conviction on record compared to 3.3% of the Negative BAC group and 4.2% of the No BAC Reported group. The proportions were not significantly different and researchers conducted no further analyses.
For negligent/reckless violations, 13.6% of the Positive BAC group had at least 1 conviction compared to 0.5% of the Negative BAC group and 0.0% of the No BAC Reported group. While this difference is large, the small counts precluded further analyses.
Crashes.Although each driver had been involved in at least one crash that caused them to enter the Trauma Registry, only 78.8% of the Positive BAC group, 90.7% of the Negative BAC group, and 81.2% of the No BAC reported group had at least one crash on their record, χ2(2, N= 646) = 13.97, p = 0.001. The Negative BAC group had a significantly higher percentage of drivers with a crash than either of the other two groups. Breaking down the data by recorded BAC level showed that similar percentages of drivers at each positive BAC level had at least one crash on record (Table 18).
Table 18.
Percentage of Drivers With at Least One Crash on Record by BAC Level
BAC Category At least one crash Group Total n
Negative BAC 90.7 367 .020 - .079 50.0 6 .080 - .119 84.6 13 .120 - .159 83.3 6 .160 + 80.5 41 Total 88.9 433
There was also a statistically significant difference, F(2, 643) = 8.73, p < 0.001, in the average number of crashes on record by study group. The Negative BAC group (M = 1.07, SD = 0.58) had a higher average number of crashes than the Positive BAC group (M = 0.82, SD = 0.46) and the No BAC Reported group (M = 0.91, SD = 0.58), ps< 0.05. An examination of the average number of crashes by BAC level showed no notable differences among the various positive BAC levels (Table 19).
19
Overall, the Negative BAC and No BAC Reported groups looked very similar across most types of convictions, suspensions, and revocations. It is not clear if this finding simply indicates random misses for BAC tests, or whether hospitals systematically did not test, or report findings for, some older drivers. It is clear, however, that drivers over 65 with Positive BACs were more likely than Negative BAC drivers to have traffic convictions and suspensions on their records. Drivers at the highest BAC level (.160 and higher) were the worst offenders in terms of overall number of convictions, DUI mentions, and suspensions. It is somewhat curious, however, that a greater percentage of Negative BAC drivers had at least one crash on their record and a higher average number of crashes than the Positive BAC group. It is possible that the driving exposure of older drivers at high BACs is less than for older drivers who do not drink. It is also conceivable that although lower in incidence, alcohol-involved older drivers’ crashes were more serious. The available data did not support further examinations of these and other possible explanations for this data pattern.
Responsibility Analysis
One research question dealt with the relationship between older driver BAC and responsibility for crash causation. To examine this question, researchers used detailed crash information from the subsample of 660 older drivers used for the previously discussed analysis of driver abstracts. This sample included 442 (67.0%) older drivers with measured BACs and an additional, randomly selected group of 218 (33.0%) older drivers from the Trauma Registry without reported BACs.
Researchers sent the Oregon DMV information from the Trauma Registry for use in retrieving a police crash report covering the events that brought the 660 drivers to a trauma center. Using this information, Oregon DMV accessed reports on 530 (80.3%) of the crashes. Most of the remaining 130 crashes for which reports could not be located likely occurred out of Oregon or did not result in the filing of a police crash report.
Overall, the 530 crashes involved 344 males drivers (64.9%) and 186 female drivers (35.1%). Cars, vans, and SUVs represented the largest vehicle type with involvement in 367 (69.2%) of the crashes. Pickups represented the next largest vehicle type with 117 involvements or 22.1% of the sample. Forty-one of the 530 drivers (7.7%) operated motorcycles, and only 5 (0.9%) of the drivers operated other types of vehicles (e.g., larger trucks, RVs, buses).
Almost half of the 530 crashes (238 or 44.9%) involved only a single vehicle. Another 287 crashes (54.2%) involved multiple vehicles; crash type could not be determined for the remaining 5 crashes (0.9%).
A researcher used two separate coding schemes to record the extent of responsibility of the older driver in each of the 530 crashes with an available police crash report. The first involved the method developed by Terhune et al. (1992) employing the following scale (hereinafter called the “Terhune Approach”):
• Responsible/contributory – Driver had some responsibility, but it is not clear whether s/he was responsible or contributory.
• Contributory – Another vehicle or agent created the critical situation, but the subject driver could have avoided the crash by a normal evasive maneuver or by driving defensively or by giving a warning signal (e.g., horn, flashers).
• Contributory/neither – At most, the driver’s responsibility was only contributory.
• Neither responsible nor contributory – Driver had no responsibility for the accident.
• Unknown – Information is insufficient for rating responsibility.
The second coding method developed for this study involved apportioning 100 points (representing 100% responsibility) among the subject older driver, other drivers in the crash, the environment, and the subject driver’s vehicle. All 100 points had to be distributed in each crash unless the crash report did not have sufficient details to make a determination, which was the case for 7 crashes. In this instance, the allocation of points remained zero for each possible entity to indicate unknown or undetermined responsibility. Together, the scale and point values
permitted characterizing responsibility either qualitatively in meaningful, previously used categories or quantitatively as a point sum or percentage of the total responsibility for the crash.
The senior researcher who did the coding had prior experience with the Terhune Approach and coded all of the reports without reference to the BAC information from the Trauma Registry and without reading any entries related to alcohol use or impairment on the police crash report.6
Sample description.This section presents an overview of the characteristics of the 530 older drivers used in the responsibility analysis as a prelude to examinations of the relationship of BAC to responsibility. The sample size may vary in the tables that follow because researchers deleted the entire crash when any variable in the analysis was missing.
BAC distribution.As in the analysis of prior driving record reported earlier, BAC categories examined included:
• Negative BAC
• .080 – .119
• .120 – .159
21
Only 366 of the drivers who generated the 530 obtained crash reports had a reported BAC. Table 20 presents the sex of the drivers by the BAC categories. Males comprised about two-thirds of the sample. Notably, 86.7% of the drivers with BACs over .160 were male
compared to 65.7% males for the Negative BAC group. Given the paucity of BAC values in even the broad categories shown in Table 20, researchers limited the examinations of the relationship of BAC and responsibility presented below to a dichotomous BAC variable (negative/positive). Table 20.
Percentage of Male and Female Drivers at Each BAC Level for Crash Report Data
BAC Category Male Female Group Total n
Negative BAC 65.7 34.3 315 .020 - .079 66.7 33.3 3 .080 - .119 53.8 46.2 13 .120 - .159 100.0 0.0 5 .160 + 86.7 13.3 30 Total 67.5 32.5 366
Crash Type.The type of crash (e.g., single-vehicle, left turn) can affect the determination of crash responsibility. Under both the Terhune Approach and 100-point schemas used for this study, a driver in a single-vehicle crash was virtually always the responsible party. The only exception would arise in rare single-vehicle situations involving external forces such as a tree falling on a vehicle as it proceeded normally and reasonably along a roadway.
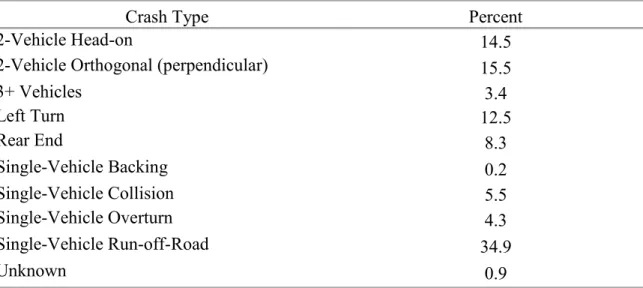
Table 21 shows the coded crash types for the 530 crash reports retrieved. The researcher determined crash type from the investigating officer’s narrative and diagram and check boxes indicating “First Harmful Event” and “Vehicle Movement.” Researchers scored some crash types hierarchically if they were not mutually exclusive. “Left Turn” and “Rear End” were coded in preference to “2 Vehicle Orthogonal,” “3+ Vehicle,” or any of the applicable single-vehicle categories. A determination of crash type could not be made for five of the crashes because of incomplete report copies or missing information on the reports.
Table 21.
Percentage of Crash Types in Crash Reports
Crash Type Percent
2-Vehicle Head-on 14.5
2-Vehicle Orthogonal (perpendicular) 15.5
3+ Vehicles 3.4 Left Turn 12.5 Rear End 8.3 Single-Vehicle Backing 0.2 Single-Vehicle Collision 5.5 Single-Vehicle Overturn 4.3 Single-Vehicle Run-off-Road 34.9 Unknown 0.9
Almost half of the crashes in the sample (238 or 44.9%) involved single vehicles, 77% of these involved running off the road. The narratives indicated that the drivers apparently fell asleep or suffered a medical problem in many of these events. In others, road surface conditions such as ice caused the driver to lose control.
Left-Turn, 2-Vehicle Head-on, 2-Vehicle Orthogonal, and Rear-End crashes comprised most of the remainder of the sample. The Left-Turn crashes involved both turns at junctions and turns to/from commercial or private driveways. Many of the Head-on crashes were similar to those involving single vehicles running off the road in that the investigating officers suspected that the drivers had fallen asleep or lost consciousness and drifted into oncoming traffic. The 2-Vehicle Orthogonal crashes almost always consisted of a failure to yield at a junction including
23
Time of Day.Table 22 presents the percentages of the 530 crashes that happened during various times of day. Most of these older driver crashes occurred between noon and 7:59 p.m. Only 11.1% occurred during the late night hours often characteristic of drinking driving events. Table 22.
Percentage of Crashes by Time of Day
Time of Day Percent
4 a.m - 11:59 a.m 26.8
Noon - 7:59 p.m 62.1
8 p.m - 3:59 a.m 11.1
Responsibility.The two methods for coding responsibility inherently produced different types of results. The Terhune Approach yielded categorical results (hereinafter called the
“Terhune Scale”) as shown in Table 23. The researcher coded almost three-quarters of the older drivers in this sample as Responsible for their crashes.
Table 23.
Percentage of Drivers by Terhune Scale Responsibility Codes
Terhune Scale Category Percent
Neither Responsible nor Contributory 13.0
Contributory/Neither 6.8
Contributory 1.5
Responsible/Contributory 3.2
Responsible 74.2
Unknown 1.3
The 100-point approach permitted the calculation of the mean or average responsibility level of the older drivers. Overall, the older drivers received an average of 77.9 responsibility points per crash (males 79.2; females 75.4). Table 24 divides the 100-point responsibility measure into categories. Again, the assignment of points took place without reference to BAC data.
Table 24.
Percentage of Drivers in 100-Point Responsibility Measure Categories
100-Point Responsibility Category Percent
0 14.1
1-49 7.3
50-74 2.7
75-99 9.0
Associations with responsibility. As shown previously in Table 23, the researcher assigned a responsibility level on the Terhune Scale other than Responsible or Neither
Responsible nor Contributory to only 12.8% of the sample of 530 older drivers. In many of their analyses of the Terhune Scale, Terhune et al. (1992) combined Responsible and
Responsible/Contributory when assessing driver responsibility. Therefore, the presentations that follow collapse the Terhune Scale into two categories. “Responsible” combines the Terhune Scale values of Responsible and Responsible/Contributory, and “Not Responsible” combines the remaining categories shown in Table 23 except “Unknown.” Researchers applied the chi square test to examine the association between variables and the Z-Test of Column Proportions when applicable to highlight the source of significant differences.
The analyses that follow report the 100-point scale rating as the mean value assigned to this sample of older drivers. Researchers used one-way ANOVA to compare the means of various subgroups.
BAC and responsibility. Since only 51 of the drivers in the sample had positive BACs, the analyses examined only a collapse of the BAC categories into negative versus positive BAC. Recall from Table 20 that an indication of a positive BAC likely implies a BAC at or above the illegal per se limit for driving.
Table 25 shows the relationship between driver BAC and coded responsibility on the Terhune Scale. The association was statistically significant, χ2(2, N=361) = 11.00, p = 0.004. The researcher judged almost all (48 or 96.0%) of the drivers with positive BACs as responsible for their crashes. Also, as with the abstract analysis, the No BAC Reported group appears similar to the Negative BAC group.
Table 25.
Percentage Responsible by BAC Category
BAC Category Responsible
Negative BAC 77.8
Positive BAC 96.0
No BAC Reported 74.1
25
Table 26 illustrates the difference in mean responsibility points assigned to the Negative, Positive, and No BAC Reported groups, F(2, 522) = 6.29, p = 0.002 . Post hoc comparisons showed the Positive BAC group had a higher average responsibility points as compared to the Negative BAC and No BAC Reported groups, ps < 0.05. The difference between the Negative BAC and No BAC Reported groups was not significant.
Table 26.
100-Point Responsibility Scale Means by BAC Category
BAC Category n M SD
Negative 311 77.15 38.51
Positive 50 95.40 17.98
No BAC Reported 162 73.92 41.04
Total 523 77.90 38.28
Responsibility and crash type.Table 27 shows the relationship between the Terhune Scale and whether the crash involved a single vehicle or multiple vehicles, χ2(1, N=523) = 85.83, p < 0.001. This is to be expected since the lone driver is typically responsible for a single-vehicle crash unless some outside force, such as a tree falling or roadway cave-in, precipitates the crash. The mean allocation of the 100-Point Responsibility Scale by crash type (Single M = 96.43, SD = 13.85; Multiple M = 62.42, SD = 44.77) was likewise significant, F(1, 522) = 127.12, p < .001. Table 27.
Crash Type by Terhune Scale Percentage Responsible
Crash Type Percentage Responsible
Single-Vehicle 96.6
Multiple-Vehicle 63.2
Total 78.4
Responsibility and time of crash.An examination of the relationship of older-driver responsibility using the Terhune Scale and the time of day of the crash indicated no association exists between the two variables, χ2(1, N=523) = 0.60, p = 0.742. A one-way ANOVA of the 100-Point Responsibility Scale by time of day also did not reach significance, F(2, 522) = 0.45, p = .639.
General Discussion
Researchers used retrospective data from the Oregon Trauma Registry, driver records, FARS, and police crash reports to examine the BACs and crash characteristics of crash-involved older drivers. In addition to characterizing the BAC distributions themselves, the study examined the relationship of older driver BAC to driving record, and crash responsibility.
A clear pattern emerged with respect to the key research questions. Around 10% of all BAC tested, crash-involved drivers over 65 in the Trauma Registry had positive BACs. This finding was consistent with data for drivers involved in fatal crashes from FARS for Oregon and the United States as a whole. Of those who tested positive, BACs in excess of the illegal per se limit were common with the great majority having a BAC above .160. The largely dichotomous zero or high-BAC distribution permitted an examination of the questions related to driving records, responsibility, and BAC even with the small samples of available data.
Results showed older drivers with positive BACs at the time of their crashes had notably worse driving records than their crash-involved peers with negative BACs. While this is not unexpected to those conversant with prior research on alcohol and highway safety, it does contradict the notion that alcohol does not represent a major factor for drivers 65 and older.
The responsibility analysis demonstrated a relationship between crash responsibility and positive BAC. Moreover, the much higher responsibility levels of older drivers with positive BACs than those with negative BACs highlight the likely negative influence that alcohol produces beyond the effects of aging alone.
Overall, the study results suggest that drivers 65 and older are less likely than their younger counterparts to test positive for alcohol after a crash that results in injuries requiring trauma center treatment. However, when older drivers do test positive, their BAC is generally well above the illegal per se limit for driving. Moreover, the strong relationship of older crash-involved drivers’ BACs to their prior driving records and crash responsibility highlight the potential benefit of focusing more attention on countermeasures for drinking among drivers 65 and older. Although this study did not examine the combination of alcohol and therapeutic drugs, the literature suggests that some medications may exacerbate the effects of alcohol on older drivers’ safety.
27 Limitations
The primary limitation for this study, and an important finding, was the unexpectedly large proportion of crash-involved trauma center patients whose records did not include BAC data. Given that a BAC based on a blood draw was a priority of the Oregon Trauma Registry and a requirement of the State of Oregon for patients injured as drivers in a traffic crash, the research team expected to find virtually complete BAC data for on crash-injured patients. Instead, the Trauma Registry results show that attending medical personnel recorded BAC levels for only two-thirds of drivers 65 and older; a substantially lower rate than other ages. While the non-tested group appeared similar to the drivers with no measurable BAC in terms of their driving records, the true values of missed BAC data remains uncertain.
It is not clear why those with missing BACs were not tested. It is possible that those who seemed likely to have high BACs were more likely to be tested, in which case those whose data were missing would likely have had lower BACs, on average, than those with reported BACs. Anecdotal evidence suggests that police officers avoid testing older drivers’ BAC in
circumstances under which they would test younger adults. These findings reported here are from a trauma center so do not speak to this issue. Nevertheless, these findings provide evidence that a subset of older adults drive with BAC levels well above the illegal per se limit; police officers and medical staff should test and record older drivers’ BACs and not assume these drivers to be alcohol free. More complete reporting of BAC data is essential to understanding the effects of drivers’ consumption of alcohol on their crash risk.
The available data did not support addressing a research question relating to BAC and older driver injury and crash severity with any precision. The typical older driver in all of the data examined, both with and without positive BACs, sustained a serious injury. Virtually no information could be obtained on lesser injury levels from the data sources used. The propensity of older adults to suffer serious and even life-threatening injuries in crashes that would produce much lesser harm to younger drivers likely accounts for some of the inability to address this question. Researchers mounted an emergency department (ED) data collection at Legacy Emanuel Hospital in an attempt to conduct BAC tests on senior drivers with less than trauma-level injuries. The approach did not succeed because the senior drivers appearing at the ED generally suffered serious injuries and required treatment by the trauma team even though initially seen in the ED.
The reader should also note that this study did not cover crashes that resulted in no (or minimal) injuries to the older driver or situations in which an injured older driver sought private treatment or refused treatment altogether. Unless a law enforcement agency initiated an
investigation for impaired driving arising from those crashes, no measured BAC for the older driver would exist. It is possible to examine BACs in a full range of crashes using research teams that go to the scene of crashes with breath testing instruments (e.g., Blomberg et al., 2009), but that approach would involve considerable expense and time-consuming approval processes. To cover the full range of older driver crashes and amass a larger number of cases will require progressing beyond the types of data used in this study and a much larger scale effort.