EPIDERMAL GROWTH FACTOR RECEPTOR TYROSINE KINASE ASSAYS IN SINGLE INTACT CELLS USING CAPILLARY ELECTROPHORESIS
Abigail H. Turner
A dissertation submitted to the faculty at the University of North Carolina at Chapel Hill in partial fulfillment of the requirements for the degree of Doctor of Philosophy
in the Department of Chemistry in the College of Arts and Sciences.
Chapel Hill 2015
ABSTRACT
Abigail H. Turner: Intracellular Epidermal Growth Factor Receptor Tyrosine Kinase Assays at the Single Cell Level Using Capillary Electrophoresis
(Under the direction of Nancy L. Allbritton)
Quantification of abnormal Epidermal Growth Factor Receptor (EGFR) tyrosine kinase activity is critical to the clinical success of targeted inhibitors used to treat EGFR-dependent cancers. Current selection criteria based on the presence or absence of activating mutations in the EGFR gene need to be supplemented with complementary assays which quantify EGFR biochemical activity in intact living cells. While in cellulo EGFR activity can be measured to great success in tissue
cultured cells using genetically encoded reporters, such techniques are incompatible with small, highly heterogeneous tumor samples. A chemical cytometry approach to direct EGFR activity measurements is presented which consists of an in cellulo
ACKNOWLEDGEMENTS
TABLE OF CONTENTS
LIST OF TABLES ... xii
LIST OF FIGURES ... xiii
LIST OF ABBREVIATIONS AND SYMBOLS ... xv
CHAPTER 1: IMPORTANCE OF EGFR KINASE ACTIVITY MEASUREMENTS AT THE SINGLE CELL LEVEL ... 1
1. Introduction ... 1
1.1 Enzymes and Their Role in Oncogenic Transformation ... 1
1.2 Oncogenic EGFR Activity ... 2
1.3 Targeting EGFR in the Clinic ... 4
1.4 Overview of Kinase Activity Assays ... 6
1.4.1 Basic Requirement for Kinase Activity Measurements ... 6
1.4.2 Source of Kinase and Sample Matrix ... 7
1.4.3 Kinase Substrate Choice ... 8
1.4.4 Basic Kinetic Theory ... 10
1.5 Assay Platforms for Direct Measurement of EGFR Kinase Activity ... 16
1.5.1 In Vitro Radiometric Assays ... 17
1.5.3 In Vitro Mobility Shift Assay ... 22
1.5.4 In Cellulo Assay Platforms for Cell Lysates ... 23
1.5.5 In Cellulo Assay Platforms for Fixed Cells ... 26
1.5.3 In Cellulo Assay Platforms for Live Cells ... 28
1.6 Chemical Cytometry with Single Cell Capillary Electrophoresis ... 30
1.6.1 Definition and Applications of Chemical Cytometry ... 30
1.6.2. Theoretical Overview of Capillary Electrophoresis76,77 ... 31
1.6.3 Single Cell Capillary Electrophoresis Assay of EGFR Kinase Activity ... 38
REFERENCES ... 43
CHAPTER 2: CONFORMATIONAL CONSTRAINT AS A SOLUTION TO PROTEIN TYROSINE PHOSPHATASE INTERFERENCE IN INTRACELLULAR PEPTIDE-BASED KINASE ASSAYS... 59
2.1 Background ... 59
2.2 Materials and Methods ... 62
2.2.1 Peptide Synthesis and Purification ... 62
2.2.2 Cell Culture ... 64
2.2.3 In Vitro EGFR Assays ... 64
2.2.4 Phosphopeptide Preparation ... 65
2.2.5 In Vitro PTP Assays... 65
2.2.6 Cell Lysate Preparation ... 65
2.2.8 Lysate Dephosphorylation Assays ... 66
2.2.9 Lysate Peptidolysis Assays ... 67
2.2.10 Capillary Electrophoresis ... 67
2.2.11 In Vitro Data Analysis ... 68
2.2.12 Pinocytic Loading for Single Cell EGFR Activity Assays ... 69
2.2.12 Single Cell Analysis with Microelectrophoresis ... 70
2.3 Results and Discussion ... 70
2.3.1 Mitigation of Phosphoreporter Dephosphorylation in vitro via Conformational Constraint ... 70
2.3.2 Phosphoreporter Lifetime in Epithelial Tumor Lysates ... 73
2.3.3 Kinetics of Phosphoreporter Dephosphorylation ... 74
2.3.4 Increased Resistance to Peptidolysis in Cell Lysates ... 75
2.3.5 Quantifying Response to EGFR Inhibition ... 76
2.3.6 Single Cell Analysis ... 77
2.4 Conclusions ... 78
REFERENCES ... 80
CHAPTER 3: TOWARD HIGH THROUGHPUT EGFR ACTIVITY MEASUREMENTS IN SINGLE TUMOR CELLS ... 90
3.1 Introduction ... 90
3.2 Methods ... 92
3.2.2 2D and 3D A431 Cell Culture and Treatment ... 93
3.2.3 Pinocytic Loading of A431 Cells ... 94
3.2.4 Bulk EGFR Assays in Intact Cells ... 95
3.2.5 Microscopy ... 95
3.2.6 Western Blotting ... 96
3.2.7 Capillary Electrophoresis ... 96
3.2.8 Single Cell Analysis ... 97
3.2.9 Data Analysis ... 97
3.3 Results and Discussion ... 97
3.3.1 Proposed EGFR Assay in 3D Cultured A431 Cells ... 97
3.3.2 Pinocytic Loading of A431 Cells with Htc-tide ... 98
3.3.3 3D Culture of A431 Cells ... 99
3.3.4 Differences in EGFR Activation in 2D and 3D Cultured A431 Cells ... 100
3.3.5 Separation Optimization for 4 cm Effective Length CE-LIF System ... 102
3.3.6 EGFR Activity in Single A431 Cells ... 103
3.4 Conclusions and Future Directions ... 104
REFERENCES ... 105
CHAPTER 4: A Higher Throughput Site-Directed Combinatorial Approach to Kinase Reporter Optimization ... 114
4.1.2 Modification with Unnatural Amino Acids ... 116
4.1.3 Site Directed Combinatorial Method for Substrate Optimization ... 118
4.2 Methods ... 118
4.2.1 General Synthetic Methods ... 119
4.2.2 Cystamine Resin Preparation and Characterization ... 121
4.2.3 Crude Peptide Purification and Characterization ... 122
4.2.5 Library Synthesis and Characterization ... 123
4.2.6 High Yield Synthesis of Asp-Containing Scaffold and Library Hit Compounds ... 126
4.2.7 In Vitro Kinase Assays ... 127
4.2.8 Capillary Electrophoresis ... 129
4.2.9 MALDI-TOF MS ... 129
4.2.10 Homogeneous Luminescence Assays ... 130
4.2.11 Library Screen Data Analysis ... 131
4.3 Results and Discussion ... 133
4.3.1 Selectivity of the Starting EGFR Peptide ... 133
4.3.2 Comparison of Potential Library Screening Platforms ... 133
4.3.2 Luminescence Assay Validation with Synthetic Standards ... 136
4.3.3 Effect of N-Terminal Label on Scaffold Phosphorylation by EGFR ... 137
4.3.5 Lysine Scan to Determine Library Site ... 139
4.3.6 Library Synthesis and Characterization ... 140
4.3.7 Library Screening and Data Analysis ... 141
4.3.8 Library Hit Re-Synthesis and Validation ... 142
4.4 Conclusions and Future Directions ... 145
REFERENCES ... 148
APPENDIX A. PRACTICAL SOLID PHASE PEPTIDE SYNTHESIS ... 168
APPENDIX B. MATLAB CODE ... 184
LIST OF TABLES
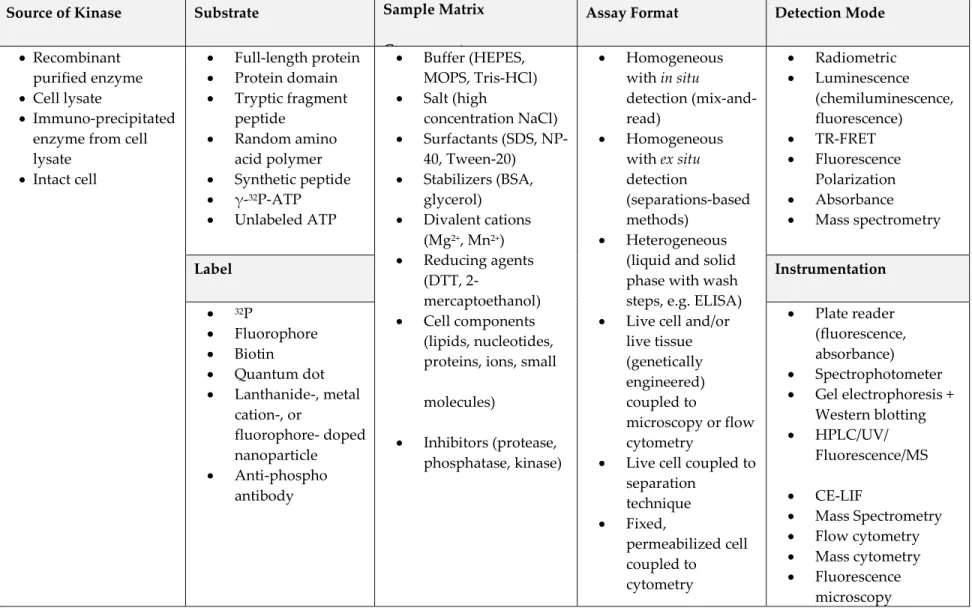
Table 1. Common Components of Kinase Assays... 50
Table 2. Assay Platforms for Measuring EGFR Tyrosine Kinase Activity ... 51
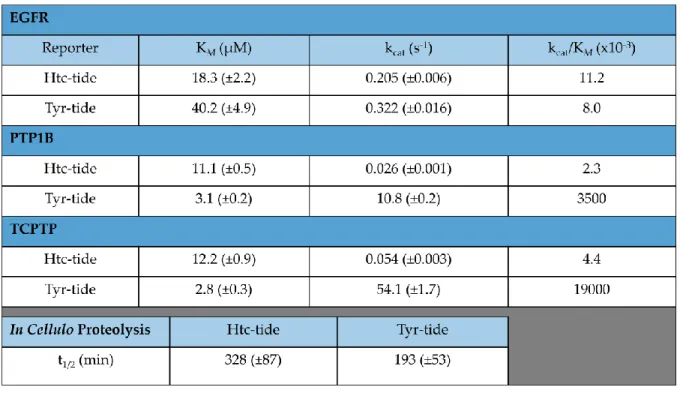
Table 3. In vitro Kinetic Parameters ... 83
LIST OF FIGURES
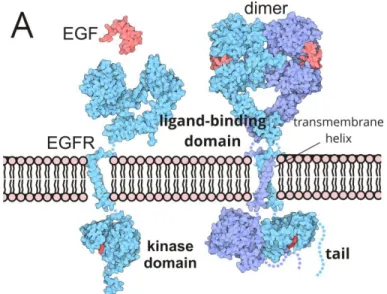
Figure 1. Overview of EGFR biology ... 55
Figure 2. Kinetic curve based on the Michaelis-Menten model of enzyme kinetics .. 56
Figure 3. Overview of capillary electrophoresis. ... 57
Figure 4. Overview of single cell EGFR assay ... 58
Figure 5. Differential in vitro dephosphorylation of EGFR reporters ... 84
Figure 6. In cellulo dephosphorylation of phosphorylated EGFR reporters ... 85
Figure 7. Vacuum electrostatic potential maps of EGFR kinase domain ... 86
Figure 8. Assessment of reporter proteolysis in cell lysates ... 87
Figure 9. EGFR reporter phosphorylation in A431 cell lysatesunder perturbation ... 88
Figure 10. Single cell analysis using Tyr-tide and Htc-tide ... 89
Figure 11. Proposed workflow for single cell analysis of EGFR activity in response to lapatinib treatment in 3D cell cultures and solid tumors. .... 108
Figure 12. Pinocytic loading of Htc-tide into A431 cells ... 109
Figure 13. Schematic of 3D culture technique. ... 110
Figure 14. Differences in EGFR activity in 2D and 3D A431 cultures. ... 111
Figure 15. CE separation optimization for high throughput serial analysis. ... 112
Figure 18. Summary of library screening platforms. ... 154
Figure 19. Time courses of 6FAM-TyrSub-9 phosphorylation by a panel of tyrosine kinases ... 155
Figure 20. Comparison of phosphorylated Biotin-TyrSub-9 detection by LANCE TR-FRET and AlphaScreen under optimized conditions. ... 156
Figure 21. AlphaScreen detection of in vitro phosphorylation of Biotin-TyrSub-9 by EGFR. ... 157
Figure 22. MALDI-TOF MS analysis of in vitro EGFR assays with Biotin-TyrSub-9 and 6FAM-TyrSub-9 ... 158
Figure 23. Effect of ionization efficiency differential on measurement bias in MALDI-TOF MS ... 159
Figure 24. Site scan to determine optimal library optimization site within the starting EGFR peptide. ... 160
Figure 25. Results of the MALDI-TOF screen of the EGFR peptide library. ... 161
Figure 26. RP-HPLC-MS analysis of selected library compounds. ... 162
Figure 27. Library compound screening by MALDI-TOF MS.. ... 163
Figure 28. Structure of the Syk screen hit 4-10F. ... 164
Figure 29. Mechanism of aspartimide formation and resultant racemization. ... 165
Figure 30. Phosphorylation of 4-10F by recombinant Syk. ... 166
Figure 31. Proposed workflow for modified library screen with SAMDI ... 167
LIST OF ABBREVIATIONS AND SYMBOLS (Ac) Acetyl
-CONH2 Amidation
(aq) Aqueous
(g) Gaseous
[X] Concentration of X [X]0 Total Concentration of X
˚C Degrees C
3D Three-dimensional 6FAM 6-Carboxyfluorescein a Hydrodynamic Radius a.a. Amino Acid
Ab Antibody
Abl Abelson Tyrosine Kinase ACN Acetonitrile
cDNA Complementary DNA
CE-LIF Capillary Electrophoresis with Laser-Induced Fluorescence CE-MS Capillary Electrophoresis-Mass Spectrometry
CHEF Chelation Enhanced Fluorescence cIEF Capillary Isoelectric Focusing CMC Critical Micellar Concentration COOH Carboxylic Acid
CRC Colorectal Cancer
CZE Capillary Zone Electrophoresis D Diffusion Coefficient
Dap Diaminopropionic Acid
DCM Dichloromethane DEP Deprotection Solution DIC Diisopropyl carbodiimide DIEA Diisopropylethylamine
DMEM Dulbecco’s Modified Eagles Medium DMF Dimethlyformamide
DMSO Dimethylsulfoxide DNA Deoxyribonucleic Acid
DTT Dithiothreitol E Electric Field
E Enzyme
EDTA Ethylenediaminetetraacetic acid EGF Epidermal Growth Factor
EGFR Epidermal Growth Factor Receptor ELISA Enzyme-Linked Immunosorbent Assay EOF Electroosmotic Flow
EpCAM Epithelial Cell Adhesion Molecule eq Equivalents
ESI Electrospray Ionization ESI Electrospray Ionization f Drag Forces
FACS Fluorescence-Activated Cell Sorting FAM Carboxyfluorescein
FBS Fetal Bovine Serum
FLIM Fluorescence Lifetime Imaging Microscopy Fmoc Fluorenylmethyloxycarbonyl
FRET Förster Resonance Energy Transfer
[4,5-b]pyridinium 3-oxid hexafluorophosphate
HBTU N,N,N′,N′-Tetramethyl-O-(1H-benzotriazol-1-yl)uronium hexafluorophosphate
HCl Hydrochloric acid
HCTU 2-(6-Chloro-1H-benzotriazole-1-yl) - 1,1,3,3-tetramethylaminium hexafluorophosphate
HEPES 4-(2-hydroxyethyl)-1-piperazineethanesulfonic acid
HER Human Epidermal Growth Factor Receptor HOBt Hydroxybenzotriazole
HPLC High Performance Liquid Chromatography HRP Horseradish Peroxidase
Htc 7-(S)-hydroxy-1,2,3,4-tetrahydroisoquinoline-3-carboxylic acid HTRF Homogeneous Time-Resolved Fluorescence
i.d. Internal Diameter IHC Immunohistochemistry IPA Isopropyl alcohol
KAYAK Kinase Activity Assay for Kinome Profiling kcat Turnover Number
KD Kinase Domain
KM Michaelis-Menten Constant
LC-MS Liquid Chromatography-Mass Spectrometry MALDI Matrix Assisted Laser Desorption Ionization MEKC Micellar Electrokinetic Chromatography MeOH Methanol
MOPS 3-(N-morpholino)propanesulfonic acid
MS Mass Spectrometry MW Molecular Weight
N Number of Theoretical Plates NaCl Sodium Chloride
NaOH Sodium Hydroxide
NMM N-Methylmorpholine NMP N-methylpyrrolidonone
NMR Nuclear Magnetic Resonance
NSCLC Non-Small Cell Lung Cancer OMpe O-Methylphenylester
OtBu O-tert-Butyl
P Product
PBS Phosphate Buffered Saline
PCR Polymerase Chain Reaction
PEG Polyethylene glycol PTK Protein Tyrosine Kinase PTP Protein Tyrosine Phosphatase PTP1B Protein Tyrosine Phosphatase 1B
pVO4 Pervanadate
q Charge
rcf Relative Centrifugal Units RP Reversed Phase
Rs Resolution
RTK Receptor Tyrosine Kinase S Substrate
S/N Signal-to-Noise Ratio SAM Self-Assembled Monolayer SH2 Src Homology 2
SPPS Solid Phase Peptide Synthesis
sQSSA Standard Quasi-Steady State Assumption Src Src Tyrosine Kinase
SYK Spleen Tyrosine Kinase
t Time
TFA Trifluoroacetic acid TIS Triisopropylsilane
TKI Tyrosine Kinase Inhibitor TOF Time-of-Flight
TSTU O-(N-Succinimidyl)-N,N,N′,N′-tetramethyluronium tetrafluoroborate UV Ultraviolet
V Applied Voltage
v Rate
Vmax Maximal Rate (Michaelis-Menten Model)
W(x) Lambert W Function
α-C α-Cynaohydroxycinnamic Acid ε Permittivity
ζ Zeta Potential η Viscosity
µeff Effective Mobility
µeo Electroosmotic Mobility
µep Electrophoretic Mobility
CHAPTER 1: IMPORTANCE OF EGFR KINASE ACTIVITY MEASUREMENTS AT THE SINGLE CELL LEVEL
1. Introduction
1.1 Enzymes and Their Role in Oncogenic Transformation
Enzymes are protein catalysts that enable the chemical reactions necessary for cellular function. The chemical reactions catalyzed vary widely, including
oxidation/reductions, structural rearrangements, and hydrolyses. The basic model of an enzymatic reaction is outline in Equation (1).
E + S E + P (1)
In this model, the enzyme E recognizes the substrate S and catalyzes its conversion to the product P. The activity of an enzyme, defined as moles of product generated per unit time, is a complex function of protein conformation, protein-protein interactions, substrate and product concentrations, and the presence of co-factors, activators, and inhibitors.1 In healthy cells, enzyme activity levels are dynamic and
tightly controlled, poised to respond to a stimulus and subsequently to return to basal levels.2,3 Disease phenotypes can often be traced to one or more abnormal
-activation of protein kinases in cancer.4
Protein kinases effect the phosphorylation of protein or peptide substrates by catalyzing the transfer of the γ-phosphoryl of ATP to the hydroxyl of functional serine, threonine, or tyrosine residues. Protein phosphorylation functions to
modulate enzyme activity and is a primary mechanism of information propagation in intracellular signaling networks.5,6 Abnormally high activity of some protein
kinases can lead to dysregulated signaling in key networks governing such cellular functions as growth, proliferation, and survival, ultimately leading to malignant cellular transformation and disease.4
1.2 Oncogenic EGFR Activity
The Epidermal Growth Factor Receptor (EGFR) is a receptor tyrosine kinase that promotes growth and proliferation in response to growth factor binding.7 EGFR
is comprised of three domains, represented in Figure 1A: an extracellular ligand-binding domain, a transmembrane domain, and an intracellular tyrosine kinase domain with an unstructured C-terminal tail. EGFR is one of a family of four structurally related transmembrane receptor tyrosine kinases (RTKs) that make up the Human Epidermal Growth Factor Receptor (HER) Family. These kinases are highly homologous in the kinase domain,8 but differ significantly in their ligand
the other HER family members.10 Homo- or hetero-dimerized receptors then
perform reciprocal trans-phosphorylation of tyrosine residues in the intracellular tail region of the kinase domain.11 These phosphotyrosine residues serve as docking
sites for downstream signaling proteins, which bind at these sites through their SH2 domains and are recruited to the kinase domain for phosphorylation and activity modulation.7
The identity of the activating ligand and the composition of the receptor dimer determines which tyrosine residues within the tail are phosphorylated and, therefore, which intracellular signaling pathways are activated.5 EGFR-containing
dimers initiate four key signaling pathways controlling growth and proliferation: PI3K/Akt/mTor, Ras/MEK/ERK, JAK/STAT, and PLC (Figure 1B).12 In healthy cells,
EGFR signaling is kept in check by protein phosphatases, which catalyze
dephosphorylation, and by the cell’s protein metabolism machinery, which recycle proteins into their constituent amino acids.5 Uncontrolled EGFR signaling can lead
to inappropriate hyperactivation of EGFR-dependent signaling networks, resulting in uncontrolled proliferation and oncogenesis. Aberrant EGFR signaling has been documented in a range of epithelium-derived cancers including non-small cell lung, breast, colorectal, pancreatic, head-and-neck, and some gliomas.9 Oncogenic EGFR
factor-independent activation of the EGFR kinase domain and unregulated signaling in downstream networks.
1.3 Targeting EGFR in the Clinic
In a healthy cell, loss of activity in one signaling network is compensated by redundant parallel pathways to maintain homeostasis.13 Tumor cells, in a
phenomenon termed oncogene addiction, rely so heavily on one aberrant activity that inhibition of that activity results in cell death.14,15 This constitutes an important
therapeutic opportunity in tumors where the oncogene can be identified. For EGFR-reliant tumors, a set of targeted EGFR inhibitors is routinely employed in the clinic. These drugs fall into two classes: monoclonal antibodies and small molecule
tyrosine kinase inhibitors.16 Anti-EGFR monoclonal antibodies bind the EGFR
advanced EGFR mutation-positive non-small cell lung cancer failed to respond to treatment.18
The variable clinical success of EGFR inhibitors can in part be attributed to inadequate selection criteria when determining patient eligibility for anti-EGFR therapy. The most recent guidelines for clinical EGFR testing recommend analysis of primary tissue with PCR amplification followed by mutation specific sequencing (e.g. Sanger, capillary electrophoresis, real-time PCR) to test for the presence of activating mutations in the EGFR gene.18 Despite a positive correlation between
detection of EGFR mutations and response to EGFR TKIs, a subpopulation of
patients who are EGFR-positive fail to benefit from targeted therapy. Additionally, a small number of patients receive a survival benefit from anti-EGFR therapy despite testing negative for EGFR mutations.18
A major flaw of the current testing methodology is the use of genetic
information as a proxy for actual enzyme activity. Abnormal EGFR signaling driven by hyperactivation of the kinase is not directly related to the presence of an
activating mutation; rather, many layers of regulation exist between genetic mutation and observed activity including transcriptional and translational
mechanisms and functional post-translational processing of the protein. Therefore, the simple presence of an activating EGFR mutation in a tumor genome is a
inadequate predictor of response to anti-EGFR therapy. Genetic analyses need to be supplemented with complementary assays that directly quantify EGFR kinase activity in patient samples. Additionally, the determinants of kinase activity can differ in each cell, resulting in highly heterogeneous signaling even in apparently homogeneous samples. Therefore, activity measurements need to be adaptable to the single cell level so that rare drug- sensitive or drug-resistant populations are not obscured.
1.4 Overview of Kinase Activity Assays
In this section, the basic theory of kinase activity measurements is explored. Practical considerations for experimental design and implementation are discussed, followed by a brief treatment of the theoretical foundations underpinning current modeling and interpretation of kinase activity data.
1.4.1 Basic Requirement for Kinase Activity Measurements
a brief summary of common assay platform components is presented in Table 1. The minimum requirements for any kinase assay are as follows:
Kinase
Phosphorylatable substrate
ATP
Divalent metal cation (Mg2+ or Mn2+)
Buffer/stabilizers Detection method
The source of the kinase to be assayed will largely determine the assay sample matrix and the available detection platforms. Many assay platforms are not
compatible with physiological samples (cell lysates, intact cells) because endogenous species in the sample matrix interfere either with the kinase reaction itself or with the detection method. Therefore assay platforms are generally divided into three classes: in vitro assays with purified kinase, in cellulo assays in cellular lysates, and in cellulo assays in living cells.
1.4.2 Source of Kinase and Sample Matrix
experimental variables is limited, thereby limiting the precision of the hypotheses that may be explored. Often, in vitro assays with purified kinase prove to be the most practicable choice for routine biochemical analyses such as kinetic experiments and inhibitor screens because they afford the researcher full control over sample matrix, assay conditions, and assay variables.
1.4.3 Kinase Substrate Choice
The kinase substrate may be chosen from a range of options, depending upon the particular assay format and other experimental requirements and constraints. These include: 1) full-length or partial protein, 2) random amino acid polymers,19
and 3) short tryptic or synthetic peptides.20-22 Early kinase assays employed
full-length proteins such as histone as the kinase substrate20; where the protein used is an
endogenous substrate for the kinase of interest, native specificity can be
approximated. Specificity is particularly an important consideration in complex sample matrices such as cellular lysates where the substrate is subject to interference from off-target enzymatic activities such as phosphorylation by off-target kinases, dephosphorylation by protein phosphatases, and metabolism by proteolytic
enzymes. Where specificity is not a consideration or is undesirable, random amino acid polymers can be an inexpensive and robust alternative. These are large
example of this is poly-Glu(Tyr) (4:1), a random polymer containing one mole of tyrosine for every 4 moles of glutamic acid. Such polymers show very broad
specificity profiles due to a lack of refined structural characteristics. However, prior to the availability of inexpensive peptide substrates, poly-Glu(Tyr) and similar polymers were commonly employed when protein substrates were cost or time-prohibitive.
Macromolecular substrates have generally fallen out of favor as technology has progressed, particularly for in vitro work. First, advances in peptide synthesis, specifically the invention of solid phase peptide synthesis by Merrifield in the 1960s,23,24 have made custom peptide substrates widely commercially available and
affordable. Second, whereas the macromolecular kinase substrates often contain multiple phosphorylation sites which make kinetic analyses difficult,25 peptide
substrates have user-defined sequences with any desired number of
phosphoacceptors. Peptide substrates are usually quite small, containing 15 or fewer amino acids. This size regime is advantageous because it results in excellent
enable detection has become a trivial task for which most labs are sufficiently equipped. Importantly, the wide availability of fluorophore-labeled peptide substrates has precipitated the development of a host of fluorescence and luminescence-based assay platforms and greatly facilitated massively high throughput screening assays that have become foundational in academic and industrial drug discovery labs.
1.4.4 Basic Kinetic Theory
A theoretical understanding of kinase activity is grounded in measurements of reaction rate. Consequently, most kinase assays incorporate some temporal component, whether by continuously monitoring the kinase reaction over time, or by taking measurements at multiple fixed time points. A robust kinetic model of a kinase’s activity allows perturbations to that activity to be accurately assessed. This is particularly important when evaluating potential therapeutic interventions such as kinase agonists and inhibitors. The Michaelis-Menten model of enzyme kinetics26
is often invoked to model kinase reactions. Dating to the early twentieth century, the Michaelis-Menten model describes the kinetics of an enzymatic reaction of the form:
𝐸 + 𝑆⇔ 𝐸𝑆𝑘1 𝑘→ 𝐸 + 𝑃𝑐𝑎𝑡 (2)
Michaelis-Menten model assumes that the enzymatic reaction conforms to the standard quasi-steady state assumption (sQSSA), which requires that the
concentration of the enzyme substrate complex is essentially constant in time.27 In
the traditional treatment, this is interpreted as a requirement that the consumption of substrate is negligible (≤ 5 %) over the course of the experiment. An additional requirement for this treatment is that the initial reaction rate must increase linearly with enzyme concentration. Invoking the sQSSA with regard to (2), the following equation describing the reaction rate v can be derived:
𝑣 =𝑑𝑃 𝑑𝑡 =
𝑘𝑐𝑎𝑡[𝐸]0[𝑆]
𝐾𝑀 + [𝑆] =
𝑉𝑚𝑎𝑥[𝑆]
𝐾𝑀+ [𝑆] (3)
where [E]0 is the total enzyme concentration. Two derived parameters are used to
describe reactions conforming to the Michaelis-Menten model. The Vmax is the
maximal rate of reaction, equivalent to the kcat (2) multiplied by the total enzyme
concentration and corresponding to the maximal rate limited by the number of available enzyme active sites. The KMis a ratio of kinetic constants that is often
treated analogously to a binding equilibrium constant, although it is not in fact an equilibrium constant unless the system being modeled is at equilibrium under the experimental conditions used. It is more correct to interpret the KM as the substrate
concentration at which the enzyme’s catalytic power is most efficiently utilized. It is therefore a good approximation of the endogenous intracellular substrate
“good” if the KM describing their interaction is in the low micromolar or smaller. The
parameters KM and kcat are useful for comparing enzyme and substrate behavior
under varied conditions. The ratio kcat/ KM is commonly invoked to directly compare
multiple substrates of one enzyme or the efficiency of phosphorylation of one substrate by multiple enzymes. For this reason, the ratio is often referred to as the “specificity constant”. A large specificity constant implies that the substrate is
phosphorylated rapidly and with a good degree of selectivity. When comparing one substrate and two enzymes, the substrate is said to be selective for one enzyme over another when the specificity constant for that enzyme is significantly larger.
Perturbations to an enzymatic reaction, e.g. addition of agonists or inhibitors, will affect the measured kinetic parameters. This allows the experimenter to derive mechanistic information about the perturbing species. This is particularly useful when evaluating kinase inhibitors because the mechanism of inhibition will affect the inhibitor’s behavior and efficacy in vivo. A competitive inhibitor, one that competes with endogenous substrates for binding to the enzyme active site, will diminish the measured Vmax and increase the measured KM. A non-competitive
inhibitor, on the other hand, will reduce the measured Vmax, but will not affect the
measured KM. An uncompetitive inhibitor, one that binds and inactivates the ES
assays interpreted through the appropriate model can yield a wealth of information about enzymatic behavior and response to perturbation.
The classical approach to estimating Michaelian kinetic parameters requires measuring initial reaction rate at a series of substrate concentrations to generate a Michaelis-Menten kinetic curve (Figure 2). The experimental points are then fit using nonlinear regression to (3), using KM and Vmax as fit parameters. The kcat is derived
from Vmax and the total concentration of enzyme. In order to satisfy the sQSSA with
this approach, the experiment must be engineered such that the total substrate present is approximately equal to the amount of free substrate available:
[𝑆]0 = [𝑆] + [𝐸𝑆] + [𝑃] ≈ [𝑆] (4)
Consequently, the reaction should only be followed to ≤5% completion in order to ensure that the rate measured is truly an initial rate. The initial rates method is the gold standard because it is mathematically straightforward and experimentally simple to implement. Additionally, because product formation is only followed over a very small portion of the reaction course, or “progress curve”, confounding
experimental problems such as reagent instability and product inhibition are avoided.29 However, the initial rate method is costly in terms of time, labor, and
derivative of progress curve data, it is fundamentally prone to magnifying experimental error.
Efforts to derive KM and kcat by fitting complete progress curves date back to
the seminal report by Michaelis and Menten in 1913, in which the authors integrated equation (3) to describe time-dependent formation of product. The integrated or time-dependent Michaelis-Menten (5) comprises a linear term describing product formation at high [S] (e.g. >> KM), and a logarithmic term which models product
formation at low [S] (<< KM).
𝐾𝑀∙ 𝑙𝑛 ( [𝑆]0
[𝑆]0− [𝑃](𝑡)) + [𝑃](𝑡) = 𝑉𝑚𝑎𝑥 ∙ 𝑡 (5)
This equation is difficult to fit accurately because the independent variable cannot be isolated from the dependent variable. Attempts to derive KM and Vmax from
linearized plots of equation (5) have been made but are error-prone and unpopular. An alternative solution to the integration of (5) is given in (6).30,31
[𝑃](𝑡) = [𝑆]0− 𝐾𝑀∙ 𝑊 {[𝑆]0 𝐾𝑀 𝑒𝑥𝑝 (
[𝑆]0− 𝑉𝑚𝑎𝑥∙ 𝑡
𝐾𝑀 )} (6)
where W is the Lambert function, such that:
𝐹𝑜𝑟 𝑦 + 𝑙𝑛(𝑦) = 𝑙𝑛(𝑥) (7)
𝑦 = 𝑊(𝑥)
regression programs are equipped to solve the Lambert function, but several useful analytical approximations have been published which are simple to implement in common software such as OriginLab or GraphPad.30-35 Because progress curve
analysis takes into account the entire reaction course, an individual progress curve experiment contains >90% more information than a corresponding initial rates experiment. Theoretically, this means that fewer progress curve experiments should be needed, compared with initial rates experiments, to obtain the same information. The shape of a kinase reaction curve describes not only the phosphorylation event, but also contributions from activators, inhibitors, interferents, competing enzymatic reactions, substrate inhibition, reagent instability, and any other phenomena
observable by the assay technique employed. This leads to fewer overall experiments performed, less reagent consumption, and less time and labor
expenditure. The barrier to widespread implementation of progress curve analysis has undoubtedly been the need for complex mathematical models to describe the shape of the observed reaction curves, accompanied by the requirement for
takes time to implement successfully—time which many laboratories are not willing to expend in order to “fix what isn’t broken”. Progress curve analysis has remained largely a niche technique, applied in situations where the benefits of the technique sufficiently outweigh the inertial burden of supplanting initial rates analyses.
Most in vitro assay platforms will support either initial rates or progress curve analyses, although continuous assays are particularly well-suited to progress curve analysis because a large number of data points can be collected with minimal effort on the part of the researcher. The majority of in vitro assays are fixed time-point assays, which are compatible with kinetic and mechanistic studies as described provided that it is possible to make measurements at multiple time points. The following sections describe the common assay platforms employed to measure EGFR kinase activity in vitro using purified kinase, in cellulo using cellular extracts or fixed cells, and in cellulo in live cells.
1.5 Assay Platforms for Direct Measurement of EGFR Kinase Activity
1.5.1 In Vitro Radiometric Assays
In vitro EGFR assays fall into two classes based on the detection method used: radiometric assays using radiolabeled ATP and fluorescence/luminescence-based assays. Radiometric assays have historically been the preferred platform for kinase activity assays due to their simplicity, robustness, and sensitivity, and are
considered the gold standard for measuring EGFR kinase activity.25 However,
radiometric assays are expensive and hazardous to human health and to the
environment. Therefore, non-hazardous assays using fluorescence or luminescence readouts have supplanted radiometric assays in recent years, particularly for high throughput applications.
Radiometric kinase assays measure the incorporation of 32P or 33P from
radiolabeled ATP into peptide or protein substrates. In a typical assay, kinase, substrate, ATP, and radiolabeled ATP are co-incubated in solution, followed by spotting of the assay mixture onto a negatively-charged phosphocellulose
substrates were used to compare inhibition of a panel of kinases by GW2016 and explore inhibitor selectivity. GW2016 has since become a successful targeted drug used to treat various forms of metastatic breast cancer.
More recently, Anastassiadis and colleagues42 reported the use of a
radiometric “HotSpot” assay to generate a comprehensive map of kinase inhibitor selectivity. The authors assayed a panel of 300 kinases including EGFR for inhibition by nominally selective targeted inhibitors using an automated radiometric assay platform. The authors compared the inhibitor selectivity scores obtained with their radiometric assays to similar studies using kinase-inhibitor binding assays and found that the binding assays were prone to both false positives and false negatives. The authors were also able to comprehensively profile the selectivity of 178 kinase inhibitors with good coverage across the kinome and to generate selectivity maps to guide future use of these inhibitors. Interestingly, the authors found that a 4,6-dianilinopyrimidine EGFR inhibitor displayed the greatest degree of
1.5.2 In Vitro Fluorescence/Luminescence-Based Assays
Use of radiometric assays for high-throughput studies such as that described above are uncommon because disposal of such a large quantity of hazardous waste can become cost prohibitive. More commonly, fluorescence/luminescence based platforms are employed. An impressive variety of such platforms have been
reported25,43,44—far too many to be described here. The reader is referred to a series of
reviews which comprehensively cover in vitro measurement of kinase activity using fluorescence or luminescence-based platforms. Here, selected examples of the most common assay platforms that have been applied to measurement of EGFR activity are recommended to the reader’s attention.
Generally, fluorescence/luminescence kinase assays are divided into those that use phospho-specific antibodies to detect phosphorylation and antibody-free methods. Of these, the antibody-dependent methods are the most common. Li and colleagues applied a commercially available homogeneous time-resolved
fluorescence (HTRF) assay (KinEASE, CisBio) to the in vitro characterization of novel EGFR inhibitors.45 Here, a short peptide substrate, biotinylated at the N-terminus, is
transfer (< 9 nm) to the FRET acceptor, which emits long-lived fluorescence at 665 nm. Because the emission lifetime is comparatively long, time-resolved
measurements which allow for decay of short-lived background fluorescence are possible. This significantly improves the signal-to-background ratio of the assay. Li and colleagues applied the HTRF assay to determine IC50 values for a large panel of
novel EGFR inhibitors coupled to bioprobes and were able to show improved potency of bioprobe-coupled inhibitors compared with their uncoupled parent compounds. Because the HTRF assay is homogeneous and highly miniaturizeable, it is well suited to such large-scale studies where reagent consumption and laborious wash steps can be prohibitively resource expensive. Nevertheless,
antibody-dependent kinase assays are limited by the availability of selective detection antibodies. Furthermore, these assays are generally endpoint-only, so kinetic experiments are laborious.
The Imperiali lab has published a variety of continuous kinase activity assays based on chelation-enhanced fluorescence (CHEF).46-48 The technology,
commercialized as the Omnia® assay by Life Technologies, has recently been applied to mechanistic studies of irreversible EGFR inhibitors.49 The Omnia EGFR
bridging the phosphoryl with the Sox label to enhance fluorescence 2-10 fold. The Sox sensor provides a direct, kinetic readout of EGFR kinase activity. Schwartz and colleagues determined the mechanism of covalent EGFR inhibition by modeling changes in time-dependent in vitro Sox sensor phosphorylation as a function of EGFR inhibition.49
Chang and colleagues applied another popular continuous EGFR assay to screen for irreversible EGFR inhibitors.50 The Z’-Lyte assay, available from Life
Technologies, is an in vitro FRET-based platform. A peptide substrate is engineered with a phosphorylation site located proximal to a protease cleavage site. The peptide is labeled at N- and C-termini with a FRET dye pair. Phosphorylation of the peptide by EGFR inhibits proteolytic cleavage in a coupled reaction, while the
non-phosphorylated peptide is cleaved. Therefore, FRET is allowed to occur only when the peptide is phosphorylated, generating a signal that is directly proportional to substrate turnover by EGFR. The authors applied the Z’-Lyte assay to determine IC50
values for a series of EGFR inhibitors and to compare inhibitor potency against several clinically important EGFR mutants.
Therefore, selectivity is problematic, limiting the use of these assays in more complex matrices such as cellular extracts.
1.5.3 In Vitro Mobility Shift Assay
Caliper’s mobility shift assay platform stands out among in vitro kinase assays because it quantifies both phosphorylated and non-phosphorylated substrates by incorporating an analytical separation step.25 The kinase reaction is
typically carried out off-line, followed by analysis on a specialized microfluidic chip. The key to this technology is the ability separate non-phosphorylated and
phosphorylated peptide substrates based on differential mobility in an electric field. The substrates are pre-labeled with a fluorophore to permit on-chip fluorescence detection. Automated sampling of the off-line kinase reaction at regular intervals enables essentially continuous assay monitoring. Because this approach measures both substrate and product, no calibration curve is required to quantify either species. Rather, the absolute quantity of phosphorylated substrate can be calculated from the fraction of substrate turnover and the known quantity of total substrate in the reaction. Xie and colleagues took advantage of the capability for continuous assay monitoring afforded by the Caliper chip to acquire progress curves of peptide phosphorylation by EGFR with and without a novel EGFR inhibitor or a control inhibitor.51 They demonstrated based on the shape of the progress curves that the
inhibitor binds but eventually dissociates from the kinase, allowing it to recover activity.51
1.5.4 In Cellulo Assay Platforms for Cell Lysates
Undoubtedly the most common and popular assay of EGFR activity in cell lysates is the classical Western blot; here, proteins from a cellular extract are pre-separated by denaturing gel electrophoresis, transferred to an ionic membrane, and probed with phospho-specific antibodies. Typically, phosphorylation of several endogenous EGFR substrates in the sample of interest is compared to controls to qualitatively assess the activity of the EGFR signaling pathway. The phosphorylated substrates measured typically include autophosphorylation sites within the EGFR kinase domain and EGFR-dependent phosphorylation sites in downstream signaling proteins such as members of the MAPK and PI3K/Akt pathways.52,53 Western
blotting is the gold standard biochemical EGFR assay for cellular lysates.
Yu, et al. reported a mass spectrometry-based method for monitoring EGFR-mediated signaling in a massively parallel manner.54 The KAYAK (Kinase ActivitY
MS analysis; inclusion of heavy isotope standards for each substrate enabled
quantitative analysis of substrate phosphorylation. The authors were able to monitor pathway-specific changes in phosphorylation in response to targeted EGFR
inhibition in immortalized tumor cell lines. KAYAK is a promising approach to studying network behavior downstream of EGFR, particularly in response to stimulation and inhibition. It provides information similar to large-scale western blotting, but does not require antibodies and requires only two LC-MS experiments to analyze 90 pathway components. A drawback of this method is the use of heavy isotope internal standards required for quantitation by mass spectrometry, which significantly increases the cost of the assay.
Ghosh and colleagues at the University of Wisconsin, Madison, published a novel and sensitive peptide-based EGFR assay designed to quantify EGFR activity in lysates of primary cells.55 The authors modified magnetic beads with a set of EGFR
peptide substrates and incubated the beads in 96-well plates with inhibitor-treated lysates of immortalized triple negative breast cancer cells lines. Following the kinase reaction, the beads were washed and phosphorylated peptide labeled with an HRP-conjugated anti-phosphotyrosine antibody. After further washing, the
phosphorylation was detected by monitoring HRP-mediated conversion of Amplex Red to Resorufin in the presence of H2O2. The authors demonstrated reasonable
of cell lines with known high or low expression of EGFR. The authors also showed good sensitivity of the assay, successfully measuring peptide phosphorylation with only 10 µg of lysate protein, or about 500 cancer cells.55 This assay has yet to be
validated in primary cells, but the possibility of easily measuring kinase activity in small numbers of cells is intriguing. It should be noted, however, that assay
performance in primary cells is unlikely to match performance in tissue cultured cell lines where the cell populations are comparatively homogenous and EGFR activity is artificially high. It is probable that much larger primary cell populations will be required to reliably generate quantifiable signal. Furthermore, a major concern in the analysis of primary cancer cells is intratumoral heterogeneity which, undetected, can lead to disease relapse. Any technique measuring EGFR activity in a bulk lysate risks averaging out and obscuring rare or small subpopulations, missing critical therapeutic information. Therefore, techniques which measure EGFR activity in single cells are highly desirable.
Shi, et al. reported a microfluidic “single cell barcode chip” which can be used essentially to perform multiplexed ELISA assays in single cell lysates generated in situ.56 One or a few EGFR-positive cultured glioblastoma cells were captured in
and phosphatase inhibitors to minimize interference from off-target enzymes. After an incubation period to allow analyte proteins to bind to their respective capture antibodies and subsequent wash steps, biotinylated primary antibodies (e.g. directed against specific phosphorylation sites) were introduced to complete the ELISA “sandwich”. Detection was accomplished by labeling the biotinylated antibodies with fluorophore-labeled streptavidin, followed chip reading in a high resolution fluorescence scanning instrument.
1.5.5 In Cellulo Assay Platforms for Fixed Cells
Leuchowius and colleagues developed a flow cytometry-based method for quantifying EGFR dimer formation and phosphorylation in single cells using a novel in situ proximity ligation method.57 Fixed and permeabilized cells were labeled with
Intercellular heterogeneity in EGFR expression and activation is of particular interest for clinical samples. Generally, cells of interest are obtained as fixed tissue slices that have been prepared by a clinical pathologist for immunohistochemistry. Tissue fixatives covalently crosslink intracellular proteins, essentially freezing the tissue in time. The tissue may then be stained with antibodies directed against EGFR or phosphorylated EGFR to qualitatively assess kinase overexpression and/or
hyperactivation. Sonnweber and colleagues performed such immunostaining on tumors obtained from patients with early stage non-small cell lung cancer (NSCLC) and showed that EGFR phosphorylation, but not overexpression, correlated with poor prognosis.58
A serious drawback of immunohistochemical analyses is the subjective nature of the actual data analysis. Skilled pathologists assign a numerical score based on their assessment of the stained tissue; because each pathologist has different experience and qualifications, this leads to variable results. Kong and colleagues sought to provide a reliable alternative to IHC by developing a quantitative, automated fluorescence lifetime imaging (FLIM) method for determining EGFR phosphorylation in fixed tissue microarrays.59 The authors converted fixed, paraffin
could undergo FRET upon excitation of one of the dyes. Automated FLIM imaging of the tissue arrays allowed the authors to quantify EGFR phosphorylation in the primary tissues. The authors showed that the mean FRET efficiency from the brightest 10% of cells from biopsy cores correlated significantly with reduced disease-free survival, but did not correlate with overall survival. The authors were also able to demonstrate that total EGFR expression did not significantly correlate with either disease-free survival or overall survival. This finding was in agreement with other non-quantitative studies using immunostaining and western blot
analyses.
Use of fixed tissue for single cell analysis of clinical samples is standard because fixation and subsequent processing allows tissue to be preserved for storage and pathological analysis at a convenient time. However, fixation terminates
intracellular reactions by cross-linking intracellular proteins. Since the timescale of fixation may not match with the timescale of the biochemical reaction to be
measured, measurement artifacts may be introduced that would be avoided if
measurements were taken in intact living cells. Therefore, assay platforms have been developed for quantification of EGFR activity in single living cells.
1.5.3 In Cellulo Assay Platforms for Live Cells
sensor comprised of an EGFR substrate peptide and a phosphotyrosine-binding SH2 domain separating a FRET pair of fluorescent proteins was genetically encoded in a cell line of interest.60 Upon phosphorylation of the substrate region, the SH2 domain
binds the phosphorylation site, bringing the fluorescent proteins into proximity and causing an increase in measured FRET that is proportional to the degree of
phosphorylation. This approach enabled the authors to image the dynamics of sensor phosphorylation in response to EGFR stimulation. Other examples of genetically encoded FRET sensors of EGFR activity in living cells have been
published61, inspired by Tsien’s design. These sensors are invaluable research tools,
but are poorly compatible with real clinical samples, which are heterogeneous and small, usually consisting of tens of thousands of cells or fewer and heavily
contaminated with stromal cells, fibroblasts, and other cells from the tumor
microenvironment. Furthermore, sensor encoding and validation can take days or weeks to complete; ideally, activity measurements in clinical specimens should be performed as soon as possible after collection to minimize changes in activity due to ex vivo sample handling and culture.
which a rationally designed peptide substrate is employed to directly report kinase activity at the single cell level.
1.6 Chemical Cytometry with Single Cell Capillary Electrophoresis 1.6.1 Definition and Applications of Chemical Cytometry
Dovichi defines “chemical cytometry” as the application of analytical
chemistry to quantify the contents of single cells.62 This requires highly specialized
instrumentation capable of handling minute sample volumes (typical mammalian cell ≈ 10-12 L) coupled to ultrasensitive detection methods. Chemical cytometry
methods involve a separation component for multiplexed analysis of cellular contents. The separation technique best suited to handling the contents of single cells is capillary electrophoresis (CE). CE was first applied to chemical cytometry by Jorgenson in 1989.63 In that early work, single giant neurons were manually lysed
and their contents labeled with a fluorescent tag prior to separation by CE coupled to an arc lamp fluorescence detector. Shortly thereafter, Ewing demonstrated the use of CE to directly sample portions of the cytoplasm from large neurons by inserting the etched inlet of the capillary directly into the cell.64 Ewing used electrochemical
two-color CE-LIF analysis of lipid metabolism in single cells using fluorescent lipid reporters, with limits of detection as low as 10-22 mol.65 Sweedler’s group has applied
CE-MS to quantitation of > 100 small molecule metabolites in single neurons, with detection limits in the high attomole range (10-16 mol).66 Mass spectrometry detection
has yet to catch up with LIF detection in terms of sensitivity, but has the advantage of being label-free. The Allbritton group has developed a toolbox of fluorescent enzyme activity reporters for single cell biochemical assays in mammalian cells, using an ultrasensitive CE-LIF chemical cytometry platform with detection limits in the range of 10-19-10-20 mol, depending upon the reporter used. Single cell
biochemical assays reported by the Allbritton group include those for protein
serine/threonine kinases, 67,68 intracellular proteases,69-71 lipid kinases,72,73 and protein
tyrosine phosphatases.74,75 In all cases, these technologies rely heavily on the
exceptional separation power of CE to resolve analytes of interest in a highly complex sample matrix. The following section provides an overview of the theoretical aspects of CE and its figures of merit.
1.6.2. Theoretical Overview of Capillary Electrophoresis76,77
analyte is determined by the product of the analyte’s effective mobility, µeff, and the
applied field E:
𝑣 = µ𝑒𝑓𝑓𝑬 (8)
The effective mobility of an analyte is the sum of its electrophoretic (µep) and
electroosmotic (µeo) mobilities (9).
µ𝑒𝑓𝑓 = µ𝑒𝑝+ µ𝑒𝑜 (9)
The electrophoretic mobility depends upon properties of the analyte itself within the context of the separation background electrolyte (BGE) being employed. It is directly proportional to the charge on the analyte and indirectly proportional to drag forces experience by the analyte. While the analyte charge is a function of the chemistry of the analyte and BGE, the drag forces are related to the size and shape of the analyte in solution. The electrophoretic mobility can be written as
µ𝑒𝑝=
𝑞
𝑓 (10)
where q is the net charge on the analyte and f describes the drag forces experienced by the analyte. For a spherical analyte, the mobility is written
µ𝑒𝑝=
𝑞
6𝜋𝜂𝑎 (11)
where η is the viscosity of the BGE and a is the hydrodynamic radius of the analyte. For many analytes, particularly biopolymers such as DNA and proteins, the
models, based on geometric parameters associated with various solvated polymer conformations, have been proposed to predict the effect of molecular weight on mobility. No “one size fits all” model has emerged which can reliably predict mobility, particularly for peptides. For small spherical analytes, the electrophoretic mobility is proportional to (MW)-1/3. The relationship for proteins, described by the
Offord model, predicts the mobility to vary with (MW)-2/3. The MW-mobility
relationship for peptides of moderate length (< 40 a.a.) lies somewhere between these two extremes.78
The electroosmotic mobility is the mobility of an analyte with a net charge of zero. It is due to the phenomenon of electroosmosis: bulk fluid flow based on
mobility of BGE ions in the electrical double layer (Figure 3B). In typical capillary zone electrophoresis (CZE), the separation capillary is an open tubular column made of unmodified fused silica, which presents ionizable silanol groups at the surface of the capillary wall. Deprotonation of surface silanol groups gives the capillary wall a net anionic charge (Figure 3C). Cationic components of the BGE specifically adsorb at the capillary surface, forming an immobile, cationic layer called the Stern layer. The local concentration of cations extends into the mobile (“diffuse”) layer. The Stern and diffuse layers together comprise the electrical double layer at the capillary surface, forming a potential gradient extending from the surface into the bulk
potential (ζ). In an applied field, cations in the diffuse layer migrate in the direction of the cathode. Cohesive forces in the BGE cause the bulk solution to migrate with the mobile layer, inducing bulk flow with a characteristic flat flow profile which facilitates the exceptional separation efficiencies for which CE is known. The
electroosmotic flow (EOF) depends upon the surface chemistry of the capillary wall and the composition and pH of the BGE. The electroosmotic mobility can be written as
µ𝑒𝑜 =
𝜖
4𝜋𝜂𝜁𝑬 (12)
where � is the dielectric constant of the BGE. The electroosmotic mobility (µeo) is
inversely proportional to the natural logarithm of the ionic strength of the BGE.79
For CZE in open tubular columns in the absence of hydrodynamic or convective flow, band broadening depends only on molecular diffusion of the analyte as described by the Einstein equation:
𝜎 = √2𝐷𝑡 (13)
Therefore, the number of theoretical plates N achievable in CZE is given by
𝑁 = 𝐿
2
𝜎2 =
𝜇𝑒𝑓𝑓𝑉
2𝐷 (14)
Since rate is proportional to the applied voltage, it is apparent that the separation efficiency in CZE benefits from the highest possible applied voltage. Maximizing the applied voltage also has the benefit of increasing the resolution RS between analyte
bands:
𝑅𝑠 = 0.177(µ𝑒𝑝,1− µ𝑒𝑝,2) [ 𝑉 𝐷̅(µ̅𝑒𝑝+ µ𝑒𝑜)
]
1/2
(15)
From this equation, one may infer that maximal resolution is achieved when the electroosmotic mobility perfectly counterbalances the average electrophoretic mobility of the analytes (RS ∞). Obviously, both the applied voltage and factors
governing µeo and µep (BGE chemistry, capillary treatment) should be optimized to
provide acceptable resolution in the shortest separation time possible to maximize separation efficiency. The upper limit of V in most cases is efficient heat dissipation across the capillary to prevent radial temperature gradients which cause band broadening and convective effects leading to nonlinearity of the voltage-current relationship (Joule heating). The Joule heating limit for a given capillary length and internal diameter depends strongly on the BGE used and varies widely for different buffer systems at the same concentration. Best practice for achieving a highly
possible time, and to operate under the highest applied voltage allowed by the optimized BGE.
CE is amenable to a variety of operation modes determined by the BGE and capillary modifications. CE in open tubular columns with typical homogeneous BGE, termed CZE as previously discussed, is the most versatile CE mode. Other
specialized modes have been developed which introduce different mechanisms of selectivity to the separation. Micellar electrokinetic chromatography (MEKC),
introduced by Terabe in the early 1980s80, is a useful CE variant in which the normal
BGE is supplemented with a surfactant at concentrations well above the surfactant’s critical micelle concentration (CMC). The micelles act as a pseudostationary phase which is usually engineered to migrate in the opposite direction of the EOF.
Analytes partition in and out of the micellar phase, such that their effective mobility is influenced by their affinity for the pseudostationary phase. MEKC is viewed as a hybrid electrophoretic/chromatographic technique and has been proposed as a flexible, economical and environmentally-friendly alternative to traditional
analytical HPLC.81 This mode adds an orthogonal dimension of selectivity to CZE
and can significantly augment separation power, particularly in the case of analytes with similar charge-to-mass ratios.
pH gradient-forming BGE. Charged analytes migrate in the applied field until they reach a pH zone corresponding to their isoelectric point; at this point, the analyte’s net charge is zero, causing its mobility to go to zero. Bands can be detected either in situ by whole-column imaging, or conventionally at a detection window or flow cell following analyte mobilization. CIEF is a powerful technique for high resolution determination of protein charge variants, for example due to post-translational modification.82,83 It has therefore increased in popularity with the recent growth in
the therapeutic protein market.
Exceptional separation efficiencies can routinely be achieved in CE analyses, with theoretical plates in excess of 106/m in many cases.84 Since N is independent of
capillary length (14), increasing this parameter leads to very large peak capacities, theoretically without sacrificing separation quality. Thus, CE is ideal for analysis of complex samples such a biologic cells. CE supports very small sample volumes (< 1 µL); the minute sample consumption facilitates analysis of precious/rare samples, such as small populations of primary cells from tumor biopsies. Achieving limits of detection suitable to such small sample sizes has been a major challenge in
developing CE instrumentation. Many detectors have been successfully coupled to CE, including UV, fluorescence, and mass spectrometry.85,86 Laser-induced
Since most analytes of interest, particularly in biological matrices, are not natively fluorescent, derivatization may be required. Mass spectrometry is label-free, but is difficult to couple to CE due to electric field issues and BGE constraints and is only sufficiently sensitive to detect the most abundant species in the cell (e.g. ATP). Electrochemical detection has been coupled to single cell CE and is suitable for sensitive detection of electroactive analytes such as dopamine88 and nitric oxide89. In
general, however, CE-LIF is employed for single cell analysis of low-abundance species.62
1.6.3 Single Cell Capillary Electrophoresis Assay of EGFR Kinase Activity The following chapters detail the development and implementation of a single-cell biochemical assay of EGFR activity optimized for use with chemical cytometry by CE-LIF. Figure 4A and B provides a diagrammatic overview of the assay. Briefly, a carboxyfluorescein-labeled peptide substrate (“reporter”) of EGFR is loaded into a population of cells of interest, followed by an incubation period to allow any EGFR in the cell to phosphorylate the reporter. The cells are seeded on a glass coverslip coated with extracellular matrix to promote rapid adhesion. To analyze an individual cell, the cell chamber is mounted in a flow chamber over the objective of an inverted microscope, flushed for a few minutes with 37 C
cell. The laser forms a plasma in the buffer near the cell, which generates a cavitation bubble. Collapse of the cavitation bubble creates shear forces which rapidly disrupt the cellular membrane and terminate intracellular biochemical reactions through dilution. The cellular contents are loaded electrokinetically into the lumen of the separation capillary, positioned a few microns above the cell. The capillary inlet is moved from the cell chamber to the inlet BGE reservoir and separation initiated by application of a high voltage. The unmodified reporter is separated from
phosphorylated reporter and any other metabolic products by CE and detected by ultrasensitive LIF. The EGFR kinase activity is calculated from the ratio of
phosphorylated to total peptide in the electropherograms; this ratiometric readout is very robust to experimental variability and allows absolute quantification by
comparison to a standard.
The described assay is ideal for single cell analysis of primary cells. The single cell CE platform supports very small and/or very heterogeneous cell populations and is easily coupled to immunofluorescence microscopy to allow identification of cells of interest based on surface markers. For example, staining with fluorophore-labeled anti-EpCAM facilitates differentiation of epithelium-derived tumor cells from fibroblasts and stromal cells that can comprise the bulk of biopsy samples. The exceptional separation power of CE allows reporter multiplexing to measure
volumes for CE and excellent mass sensitivity for LIF detection results in limits of detection on the order of 10-20 mol. For a typical mammalian cell with a volume of 1
pL, this corresponds to an intracellular reporter concentration of 10 nM. This exquisite sensitivity allows reporter loading into cells to be kept to a minimum to prevent measurement artifacts due to reporter interference in native signaling interactions. The single cell CE system is amenable to automation and
high-throughput analysis. While the best published high-throughput for such a system does not rival massively high throughput techniques such as FACS, it is nevertheless possible to analyze hundreds of cells per hour.90 Further increasing throughput is an
The foundation of a successful single cell biochemical assay is the activity reporter. For EGFR and other tyrosine kinases, this is a fluorophore-labeled, acidic peptide with a tyrosine phosphoacceptor surrounded by recognition elements tailored to the kinase of interest. The reporter peptide is synthesized and
characterized in vitro under controlled conditions, providing a robust reference for behavior in cellulo. This stands in stark contrast to genetically encoded reporters that must be characterized in cellulo with very limited control over experimental
variables. The exogenous reporter can be introduced into the cytosol of intact cells by any of a variety of methods, including pinocytosis, electroporation, or
REFERENCES
(1) Price, N. C.; Stevens, L. Enzyme technology, fundamentals of enzymology: The cell and molecular biology of catalytic proteins; Oxford University Press, 1999.
(2) Purvis, J. E.; Lahav, G. Cell 2013, 152, 945–956.
(3) Kholodenko, B. N.; Hancock, J. F.; Kolch, W. Nat. Rev. Mol. Cell Biol. 2010, 11, 414–426.
(4) Blume-Jensen, P.; Hunter, T. Nature 2001, 411, 355–365. (5) Lemmon, M. A.; Schlessinger, J. Cell 2010, 141, 1117–1134.
(6) Manning, G.; Whyte, D. B.; Martinez, R.; Hunter, T.; Sudarsanam, S. Science 2002, 298, 1912–1934.
(7) Lemmon, M. A.; Schlessinger, J.; Ferguson, K. M. Cold Spring Harbor perspectives in biology 2014, 6, a020768.
(8) Bose, R.; Zhang, X. Experimental Cell Research 2009, 315, 649–658. (9) Yarden, Y.; Sliwkowski, M. X. Nat. Rev. Mol. Cell Biol. 2001, 2, 127–137. (10) Linggi, B.; Carpenter, G. Trends in Cell Biology 2006, 16, 649–656.
(11) Leahy, D. J. Cell 2010, 142, 513–515. (12) Han, W.; Lo, H. W. Cancer Letters 2012.
(13) Avraham, R.; Yarden, Y. Nat. Rev. Mol. Cell Biol. 2011.
(14) Levitzki, A. Annu. Rev. Pharmacol. Toxicol. 2013, 53, 161–185.
(15) Sharma, S. V.; Fischbach, M. A.; Haber, D. A.; Settleman, J. Clin. Cancer Res. 2006, 12, 4392s–4395s.
(17) Baselga, J. Science 2006, 312, 1175–1178.
(18) Lindeman, N. I.; Cagle, P. T.; Beasley, M. B.; Chitale, D. A.; Dacic, S.; Giaccone, G.; Jenkins, R. B.; Kwiatkowski, D. J.; Saldivar, J.-S.; Squire, J.; Thunnissen, E.; Ladanyi, M. The Journal of Molecular Diagnostics 2013, 15, 415– 453.
(19) Braun, S.; Raymond, W. E.; Racker, E. J. Biol. Chem. 1984, 259, 2051–2054. (20) Casnellie, J. E. Meth. Enzymol. 1991, 200, 115–120.
(21) Hunter, T. J. Biol. Chem. 1982, 257, 4843–4848.
(22) Pearson, R. B.; Kemp, B. E. Meth. Enzymol. 1991, 200, 62–81. (23) Merrifield, R. B. J. Am. Chem. Soc. 1963, 85, 2149–2154. (24) Merrifield, R. B. Biochemistry 1964, 3, 1385–1390.
(25) Jia, Y.; Gu, X.-J.; Brinker, A.; Warmuth, M. Expert Opin. Drug Discov. 2008, 3, 959–978.
(26) Michaelis, L.; Menten, M. FEBS Lett. 2013.
(27) Schnell, S.; Maini, P. K. Comm. Theoret. Biol 2003, 8, 169–187.
(28) Segel, I. H. Biochemical Calculations (2nd edit.) Wiley; New York, 1976. (29) Duggleby, R. Methods 2001, 24, 168–174.
(30) Goličnik, M. Analytical Biochemistry 2010, 406, 94–96.
(31) Goličnik, M. Biochemical Engineering Journal 2012, 63, 116–123. (32) Goličnik, M. Eng. Life Sci. 2011, 12, 104–108.
(35) Goličnik, M. Biochem. Mol. Biol. Educ. 2011, 39, 117–125. (36) Johnson, K. A. FEBS Lett. 2013, 587, 2753–2766.
(37) Zavrel, M.; Kochanowski, K.; Spiess, A. C. Eng. Life Sci. 2010, 10, 191–200. (38) Goudar, C. T.; Harris, S. K.; McInerney, M. J.; Suflita, J. M. Journal of
Microbiological Methods 2004, 59, 317–326.
(39) Goudar, C. T. Journal of Biotechnology 2012, 159, 56–60. (40) Goudar, C. T. Biotechnol. Bioeng. 2011, 108, 2499–2503.
(41) Rusnak, D. W.; Lackey, K.; Affleck, K.; Wood, E. R.; Alligood, K.; Rhodes, N.; Keith, B. R.; Murray, D. M.; Knight, W. B.; Mullin, R. J.; Gilmer, T. M.
Molecular Cancer Therapeutics 2001, 1, 85–94.
(42) Anastassiadis, T.; Deacon, S. W.; Devarajan, K.; Ma, H.; Peterson, J. R. Nature Biotechnology 2011, 29, 1039–1045.
(43) Jia, Y.; Quinn, C. M.; Kwak, S.; Talanian, R. V. Curr Drug Discov Technol 2008, 5, 59–69.
(44) Morris, M. C. Biochim. Biophys. Acta 2013, 1834, 1387–1395.
(45) Li, S.; Guo, C.; Sun, X.; Li, Y.; Zhao, H.; Zhan, D.; Lan, M.; Tang, Y. Eur J Med Chem 2012, 49, 271–278.
(46) Shults, M. D.; Imperiali, B. J. Am. Chem. Soc. 2003, 125, 14248–14249.
(47) Shults, M. D.; Janes, K. A.; Lauffenburger, D. A.; Imperiali, B. Nat Meth 2005, 2, 277–283.
(48) Rothman, D. M.; Shults, M. D.; Imperiali, B. Trends in Cell Biology 2005, 15, 502–510.