BIOMECHANICAL CHARACTERIZATION OF THE PERIODONTAL LIGAMENT: ORTHODONTIC TOOTH MOVEMENT.
Richard F. Uhlir
A thesis submitted to the faculty at the University of North Carolina at Chapel Hill in partial fulfillment of the requirements for the degree of Master of Science in the Orthodontics
Department in the School of Dentistry.
Chapel Hill 2014
Approved by:
Ching-Chang Ko
Garland Hershey
iii ABSTRACT
Richard F. Uhlir: Biomechanical Characterization of the Periodontal Ligament: Orthodontic Tooth Movement
(Under the direction of Ching-Chang Ko)
The biomechanical characteristics of the dental periodontal ligament (PDL) are currently
not completely known. Methods: A Dynamic Mechanical Analyzer (DMA) that can detect small
forces at resolutions of 0.002 N was utilized to characterize stress-strain behavior of PDL
specimens sectioned from mandibular bovine incisors. Uniaxial tension tests using different
force levels of 0.5, 1, and 3 N were completed for 38 samples. Modulus values calculated from
experimental data were compared to see the effects of anatomic location and force levels. The
Mooney-Rivlin model was applied to experimental data and used in a Finite Element Analysis
(FEA) simulation of orthodontic intrusion. Results: Force levels (ANOVA, p<.01) and anatomic
location (ANOVA, p<.01) were statistically significant in their effects on modulus. Conclusion:
The data suggests that the PDL is a non-homogeneous tissue in which the modulus changes in
relation to location within the PDL and the applied force levels. Additionally, the Mooney-Rivlin
model was found to approximate the experimental data well, and it demonstrated a reasonable
expected outcome of stress/strain levels within the PDL and bone for the FEA intrusion
iv
ACKNOWLEDGEMENTS
Thank you to my committee members, Dr. Ko, Dr. Hershey, and Dr. Adalsteinsson, for
your expertise, guidance, and advice throughout my project. Thank you to John Whitley for your
instruction in the laboratory. Thank you to Dr. Feng-Chang Lin for your statistical analysis.
Thank you to my wife and family for your love and support. Thank you to the Southern
v
TABLE OF CONTENTS
LIST OF TABLES ... vi
LIST OF FIGURES ... vii
LIST OF ABBREVIATIONS ... ix
CHAPTER 1: Literature Review ...1
A. Introduction ...1
B. Previous studies of biomechanical models for PDL ...4
C. Finite Element Analysis ...8
D. Summary ...9
E. References ...10
CHAPTER 2: Biomechanical characterization of the periodontal ligament: orthodontic tooth movement ...12
A. Introduction ...12
B. Methods...15
C. Results ...17
D. Discussion ...21
E. Conclusion ...25
vi
LIST OF TABLES
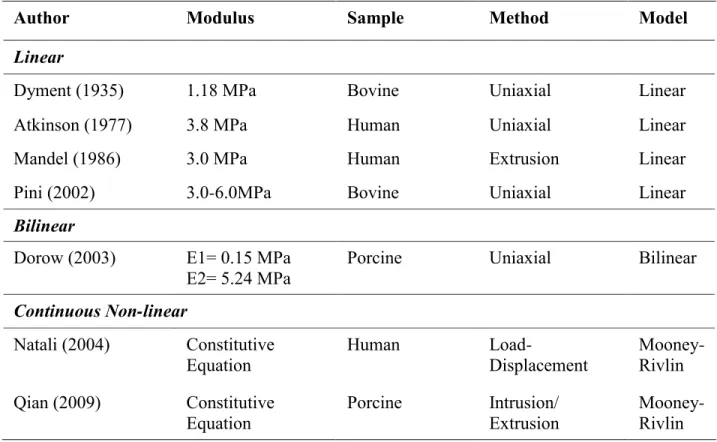
Table 1 - Modulus values from studies reporting bilinear moduli from experimental data.
Modulus has been reported using three different methods: linear, bilinear, and continuous non-linear ...28
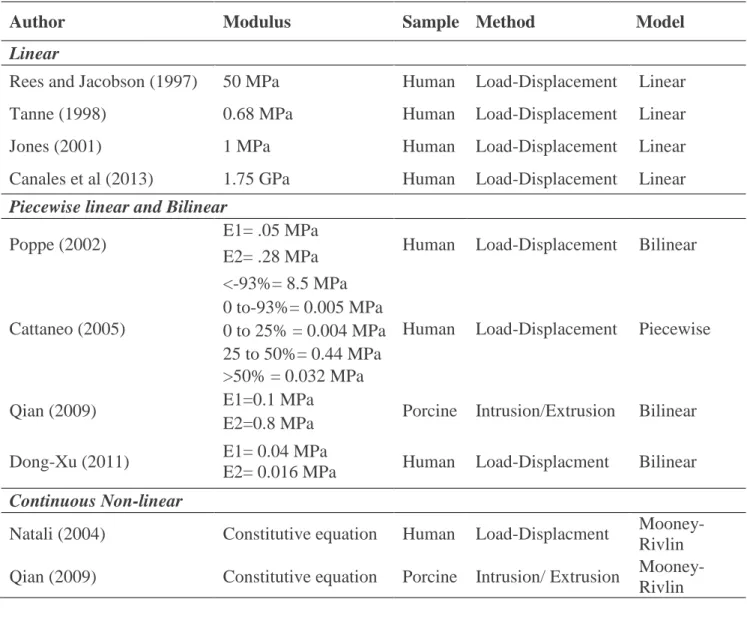
Table 2 - List of FEM studies and their reported PDL modulus values. Linear, Bilinear, piecewise linear, and continuous non-linear methods have all been used to model the PDL. ...29 Table 3 - Material properties proposed for FEM ...29
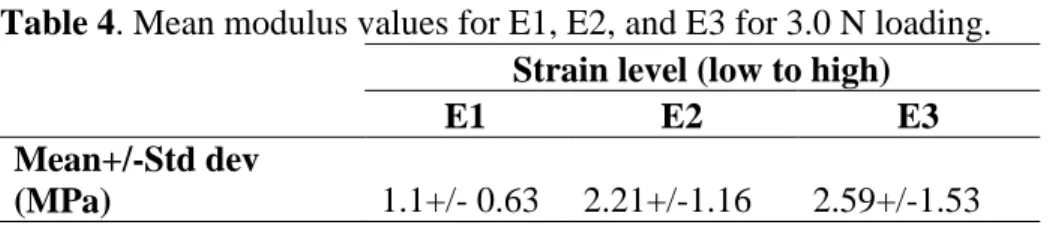
Table 4 - Mean modulus values for E1, E2, and E3 for 3.0 N loading ...30
Table 5 - Mean modulus values comparing facial and lingual surfaces with mesial and distal surfaces using a two way ANOVA ...30
Table 6 - Mean modulus values at E1 region for all three force levels.Statistical significance found (p=.003) between the 3 force levels using repeated measures ANOVA ...30
Table 7- Constants for the Mooney-Rivlin equation ...30
vii
LIST OF FIGURES
Figure 1 - Flowchart of experimental design ...32
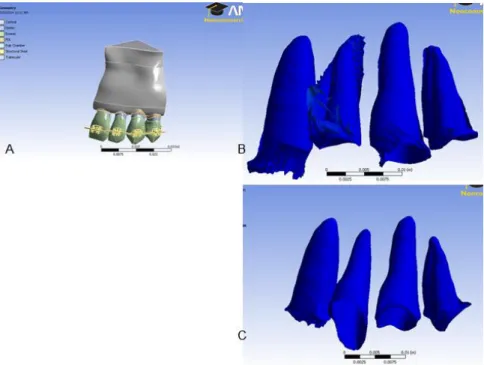
Figure 2 – A) Shows central incisor sectioned out of the mandible with black lines representing cross-sectional cuts made. B) Shows samples of cross sectional cuts. Notice there is no bone available on the buccal and very little on the lingual, therefore mesial and distal segments were chosen in this case. C) Shows final samples ready for testing. ...32
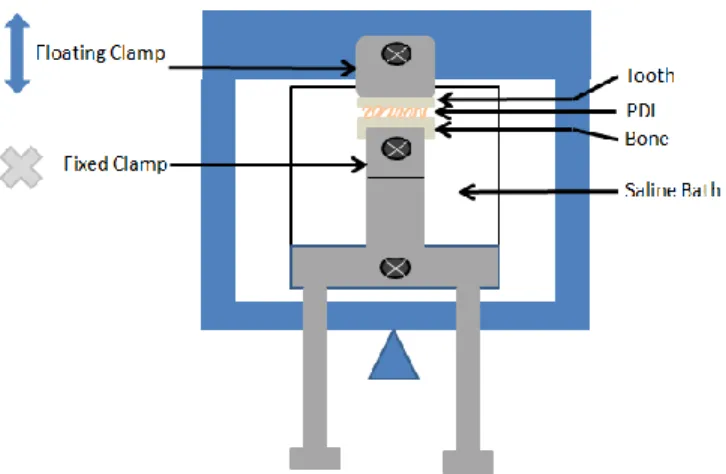
Figure 3 - DMA schematic shows the floating clamp (blue) and the fixed clamp (gray) which is attached to the saline bath. The sample sits within the bath and the floating arm rises upward in tension and downward in compression. ...32
Figure 4 - Average stress-strain curves for 0.5N, 1N, and 3N. Shaded regions approximate
regions for E1, E2, and E3 ...33
Figure 5 - Image of the FEM model with brackets (.022 in slot) on the maxillary left central incisor, lateral incisor, canine, and first premolar. A stainless steel (.019x.025) wire with a 0.5mm step bend to intrude the lateral incisor was ligated into the brackets to simulate orthodontic intrusion ...33
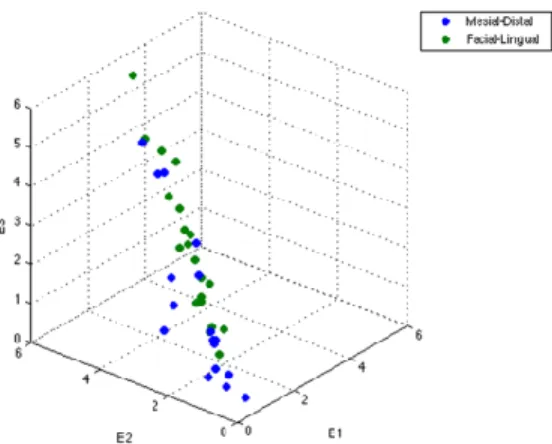
Figure 6 - Scatterplot of E1 vs E2 vs E3.Facial-Lingual (green dots) samples appear more clustered at the top or stiffer region of the cube while Mesial-Distal (blue dots) appear clustered more at the bottom. ...34
Figure 7 - Modulus change is greater at lower strain range (between E1 and E2), than at higher strain range (between E2 and E3). Lingual and facial surfaces were consistently stiffer than mesial and distal surfaces. ...34
Figure 8 - A,B) SEM images of distal sample with tooth on left side and bone on right side of image. A) Low magnification of PDL space shows an oblique orientation of PDL’s collagen network. B) High magnification shows a similar oblique orientation of the collagen fibrils. C,D) SEM images of lingual sample with tooth on left side and bone on right side. C) Low magnification of PDL space shows horizontal orientation of PDL’s collagen network. B) High magnification shows a similar horizontal orientation of the collagen fibrils. E) Stress-strain loading curve of above samples. Lingual sample was stiffer which may be partly due to its horizontal fiber orientation. ...35
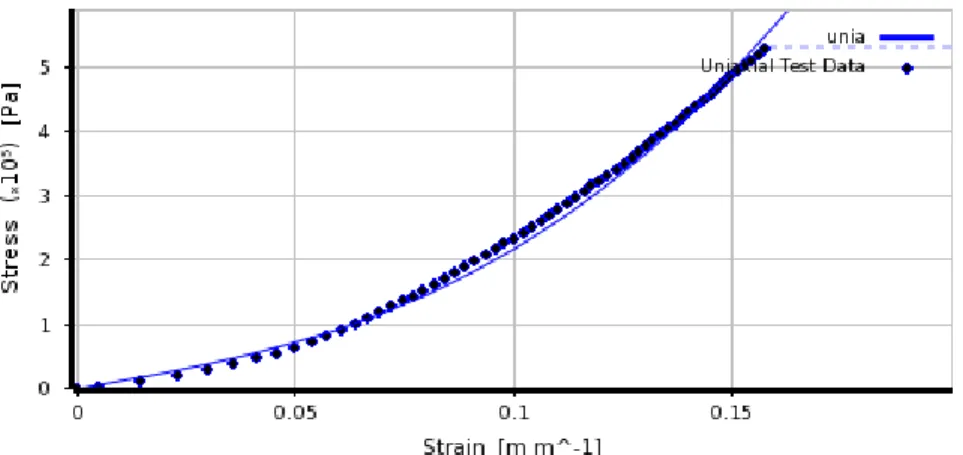
Figure 9 - Three constants were adjusted until the Mooney-Rivlin curve (solid line) fit
viii
Figure 11 - A) Shows orientation of the complete model before removing all tissues but the PDL. Exaggerated deformation plots were created in order to better visualize deformation of the PDL. C) Shows PDL deformation (x5) of the non-linear model revealing uncontrolled tipping and intrusion mechanotherapy; D) PDL deformation (x5) of the linear model shows controlled tipping with the crown tipping facially while the apex doesn’t move ...37
ix
LIST OF ABBREVIATIONS
ANOVA Analysis of Variance BMU Basic Multicellular Unit
DMA Dynamic Mechanical Analyzer ECM Extracellular Matrix
FE Finite Element
FEA Finite Element Analysis FEM Finite Element Method
MRH Mooney-Rivlin Hyperelastic model MTM Material Testing Machine
PDL Periodontal Ligament
1
CHAPTER 1 Literature Review
Introduction
The PDL is the most deformable tissue in the periodontium and strain within the PDL is
the key to orthodontic tooth movement1-3. The ability to measure stress/strain levels throughout
the PDL would provide valuable information in determining orthodontic tooth movement. It is
not possible to provide this type of information in a live patient and therefore interest in FEM for
simulating tooth movement has increased. FEM models of tooth movement allow for the only
possibility of investigating stress/strain levels throughout the periodontium. These models are
only as accurate as their geometry and material properties. Currently, material properties used for the PDL have limited FEM’s usefulness. To date, the quantification of the stress/strain in the
PDL is unavailable. Almost all biomechanical assessments for clinical tooth movement are
empirically-driven. Developing quantitative biomechanics for the PDL will provide important
information in understanding orthodontic tooth movement.
Background
PDL Structure and composition: The PDL’s complex geometry and non-linear
viscoelastic behavior make it a challenge to model. The structure and composition of the PDL
determines its viscoelastic nature. The PDL is a specialized connective tissue which stabilizes the
tooth in the periodontium. Cells, fibers, extracellular matrix (ECM), nerves, and blood vessels
make up the PDL. These components allow the PDL to perform four main functions which
2
fibroblasts, osteoblasts/clasts, cementoblasts/clasts, and undifferentiated ectomesenchymal cells.
Fibroblasts are the most numerous and occupy 50% by volume of the PDL.5 Fibroblasts build the
collagen fibers that give the PDL its elastic property as these fibers can instantaneously deform
upon an applied force. The collagen fibers, primarily type I, are mostly structured into bundles
and are oriented in different directions within the socket. There are horizontal, oblique, and
apical periodontal fiber bundle groups. The horizontal ones are coronal and the oblique ones are
mid root. These highly organized fiber bundles stretch from cementum to lamina dura in the
direction of principal strain, but they also form a network three-dimensionally with an
overlapping arrangement.5 The different orientations permit the PDL to provide a protective
function regardless of the direction of the applied force. Osteoblasts/clasts, forming BMUs, help
remodel bone around the socket while cementoblasts/clasts remodel cementum along the root of
the tooth. The nerves within the PDL facilitate sensation of pain and pressure. The ECM is made
up of ground substance and collagen fibers. The ground substance is 70% water and the other
30% is proteoglycans. The viscous nature of the PDL is thought to be due to its high water
content in the ECM as well as its vascularity.
Tooth Movement: The pressure-tension theory is the most accepted theory for orthodontic
tooth movement.6 For reciprocal tooth movement, an applied force to a tooth places tension and
compression in different areas within the PDL. These events within the PDL trigger changes at a
cellular level that lead to bone remodeling and ultimately orthodontic tooth movement. On the
tension side of the PDL, there is bone apposition while on the pressure side there is bone
resorption.
Muhlemann was one of the first investigators of clinical tooth movement. He developed a
3
displacement. His experimental data on horizontally loaded human maxillary incisors showed
how initial tooth movement was rapid and then as the PDL stiffens movement is quickly halted.7
Parfitt studied vertical loads by applying intrusive forces on human maxillary incisors and
measured their displacement.8 He found that tooth displacement depended on rate of and interval
between loads. After about 1 N, increasing the load did not produce much more total tooth
displacement. Also, Parfitt showed that the tooth does not return to its initial position if loads
were repeated in quick time intervals (2-5 secs). This demonstrated damping of tooth movement
during relaxation. Full recovery from a load took about 1-2 minutes. Picton’s work supported Parfitt’s conclusions that increases in tooth mobility diminished with increased load and full
recovery was 2 minutes.9 Wills et al showed that rapid load versus gradual load gave different
results in tooth displacement in macaque monkey dentition with the rapid loading leading to less
displacement.10 These early studies of tooth displacement led to the theory that the PDL has
viscoelastic properties. Research began on how to model the PDL and to further explore its
viscoelasticity.
Viscoelasticity: Most existing PDL models are linear elastic, but the PDL does not obey
either properties of linearity or elasticity. For Hookean solids (purely elastic), stress and stain are
in phase meaning that the materials instantaneously deform when stressed. While Hookean
materials can store energy, they do not lose it, so they will maintain a constant stress level per
given strain. The PDL behaves more like a viscoelastic polymer in which there is a lag phase
between stress and strain. In other words, as a stress is applied to the PDL, there is a delay in
strain of the material as molecules shift or change structure. Viscoelasticity is a time dependent
property due to this phase lag. Energy dissipates and these materials experience stress relaxation
4
As previously mentioned the PDL’s elasticity comes from its collagen structure as these
fiber bundles by themselves stretch and relax instantly. The fluid component which includes the
vasculature and the extracellular fluid of the PDL is thought to be responsible for its viscosity.
Although controversial, the vasculature may act as a fluid replenishment pump and play a role in
the time dependent recovery of the PDL.2,11,12 Wills reported that as much as 30% of tooth
displacement is due to changes in blood volume, while 10% is due to extracellular volume.11
Bien was one of the first investigators to study the hydrodynamic damping of tooth movement.
He reported that the damping or viscous effect is provided by extracellular fluid squeezing into
the alveolar bone and blood vessels occluded by the stretched fibers releasing their fluid in
response to an initial load.12 Berkovitz argued that due to lack of knowledge regarding fluid distribution and material properties, one must be skeptical in the fluid’s role in tooth movement.
A study by Ng et al indicated that the changes in the vascular pressure in the PDL of canine teeth
in dogs was so slight relative to the loads that they concluded vascular pressure had little role in
tooth support.13 Certainly, the vasculature can affect tooth position as studies using
vasoconstrictors which increase the pulsing or vascular pressure of the blood vessels in the PDL
led to slight extrusion.5
Previous studies of biomechanical models for PDL
There have been several studies completed in attempts to characterize the non-linear
behavior of the PDL. Bien and Wills were two of the first investigators that used viscoelastic
models to describe their measured tooth movement data. Bien looked at tooth intrusion of
incisors in rats. He investigated if viscoelastic models such as Maxwell and Voigt models
accurately describe the intrusion data.14 These models contain specific arrangements of springs
5
viscosity by dampers. The Maxwell model has a spring and damper in series which allows for
instantaneous deformation followed by a damping of elasticity by a damper element. The Voigt
model has a spring and damper in parallel which allows for a constant damping of the elasticity.
Bien et al looked at oscillating intrusive loads in rat tooth samples and concluded Maxwell
model described loading and unloading phases best. Wills reported that multiple Voigt elements
described tooth movement best, and his data was recorded using Macaque monkey incisors.10
Several investigators have attempted to use in-vivo whole tooth load-displacement data
of human teeth for the basis of a PDL modeling. Brosh measured deformation/recovery cycles
using a custom strain gauge and wedged human premolars apart.2 He found that 82% recovery
occurred within 1 minute of removing the wedge and then only another 6% recovery occurred
after 30 more minutes. He concluded that a Maxwell model may describe the system best with a
rapid initial recovery phase followed by a slow or damped recovery phase. Natali et al used Parfitt’s tooth movement data from intrusion of human maxillary incisors and modeled it using
the Mooney-Rivlin hyperelastic model.15 This was a numerical non-linear elastic model which
was validated with experimental data. It was only considered valid under the assumptions of a
strain range under 30% and short acting functional forces. Rees and Jacobson used Picton’s and Tanne’s experimental data of strain gauge measurements of tooth displacement to calculate and
compare linear elastic moduli of two different in vivo data sets.16 They found a Young’s
Modulus of 50 MPa to most accurately reflect the stiffness of the PDL.
We have made attempts to model whole tooth in vivo experimental data published by
Jones et al. In this study, a 0.39 N load was applied for 30 seconds to human incisors and then
removed and tooth displacement was measured over a period of one minute.17 A modulus of
6
until outputs matched the experimental data. Interestingly, the modulus reported from this in
vivo data was much closer to many of the values reported from in vitro studies. However, their
FE model was too simple to reflect the actual system. Thus, we decided to derive an analytical solution using Jones’ data. We digitally extracted the Jones et al data from the journal paper
using XY Extract software program. The software allowed the user to select numerous points
along the data curve and label the axes to provide a duplicate of the original data. Matlab
software was used to apply viscoelastic models to try to fit the data. It was decided to use the
Standard Linear model which has a Maxwell element combined with a second Hookean spring in
parallel. The model incorporates an instantaneous strain upon initial stress and then has a
decreasing deformation rate as it approaches a steady state. An attempt to solve the constitutive
equation pop1q0q1was made, but the data could not be described by this model without
some manipulation of the constants to “fit” the data. A best fit equation based on the Standard
Linear model was derived and found to beE(t)0.26400.1577*e0.5*t. The data was well
represented bilinearly with moduli of E1= 2.2 MPa and an E2= 1.5 MPa.
In-vivo whole tooth models would be ideal since the PDL’s biomechanical properties
likely rely on vasculature and preserving the natural physiology of the periodontium is ideal.
However, the displacement data would include information about deformation of the entire PDL
which would be experiencing both compression and tension in different regions. Depending on location, the PDL will have a different “experience” that occurs even within the alveolar socket
of the tooth that is being displaced. The limitations of in-vitro models include the lack of vasculature which is important in the PDL’s viscoelastic response, especially during stress
relaxation. In-vitro studies must severe this blood supply which limits the reliability of
7
order to develop true constitutive equations, stress-strain data must be obtained from PDL
samples with known geometry and known force magnitude and direction. Such experiments
cannot be done in-vivo at the present time.
Toms evaluated shear stress strain data of cross-sectional tooth-PDL-alveolar bone bar
segments from cadaveric premolars to measure intrusive and extrusive shear modulus.4 A
material testing machine (MTM) was used to strain the samples until 0.05 MPa stress was
obtained. Typical stress strain curves suggested non-linear behavior. This study also suggested
anatomic location was important as mid root sections were less stiff than coronal or apical
sections. Qian also looked at intrusion tests, but used porcine premolar samples. Using an MTM,
these samples were displaced 200 µm and held at constant strain.18 The author evaluated bilinear,
hyperelastic, and Maxwell model systems with the experimental data. The outcome suggested
that the hyperelastic and bilinear models (E1=0.1 MPa; E2= 0.8MPa) were appropriate to use
during loading, while the Maxwell model was best for the stress relaxation or unloading part.
Dorow et al performed uniaxial tensile testing with a MTM using different strain rates on cross
sectional samples taken from the roots of mandibular anterior porcine teeth.19 It was concluded
that a bilinear model approximated their experimental data. The found an average E1 of 0.15
MPa and E2 of 5.24 MPa and values were dependent on loading velocity.
Sanctuary et al looked at linearity and viscoelasticity using differing strain loading
profiles.20 An MTM (.01N force resolution) was used to perform uniaxial tensile testing. The
authors created a loading profile to look at loading and stress relaxation curves for bar segments
of bovine PDL specimens. The author was able to determine that the PDL did not meet the
requirements for linearity and determined the PDL to be a non-linear viscoelastic material.
8 Finite Element Analysis
The Finite Element Method (FEM) is currently the gold standard for attempting to predict
likely stress and strain levels in the periodontium as a result of orthodontic forces. FEM is used
to approximate engineering analyses of complex structures. Complex structures are simplified
into substructures of elements which are connected by nodes. These connected elements make up
the mesh network of the structure. Virtual work principles consisting of a series of partial
differential equations are numerically solved for each node, thereby approximating an expected
stress/strain behavior of the material at that point. Typically, more elements (fine mesh) are
added to areas to approach the convergency of the solution for stresses/strains. In addition to the
mesh, the accuracy of FEA depends on parameters set for the geometry and the mechanical
properties of bone, tooth, and PDL.21 The biomechanical parameters used for hard tissues such as
bone, dentin, and enamel have been validated and are reliable, while the parameters for the PDL
are not. PDL models used in FEM analysis use elastic modulus values ranging from
.01-1000MPa.3,20
Early FEM models of tooth movement contained linear isotropic YM values for the PDL
to simplify the solution as it requires more computing power for non-linear models. Rees and
Jacobson, Tanne el al, and Middleton et al have developed 3-D FEM models using linear elastic
isotropic properties for the PDL.16,22 Recent studies of non-linear PDL models for FEM analysis have been published. Toms el al used Fung’s quasi-linear viscoelastic (QLV) model.4
The QLV
model: [ ( ) ] ( ) ( ), consists of a temporal portion ( ) and a non-linear elastic
portion ( ). The temporal portion was a decaying exponential which was fitted to the data to
derive constants. The stress equation was a rising exponential which was then calculated for each
9
model was found to be within 6.2%+/-5.0% of the experimental data. Natali used the
Mooney-Rivlin model which is a non-linear elastic or hyperelastic model.15 The Parfitt data of intrusion of
human maxillary incisors was used to validate the model. The equation involves the derivative of
the stored energy function based on strain history. The model couples isovolumetric and
volumetric components to allow the PDL to behave as an almost incompressible material at
higher loads which allows for more accurate biomechanical behavior than other linear elastic
models. Cattaneo used different modulus values depending on strain level and whether
compression or tension forces were present.21 On the compression side, a YM of 0.005 MPa was
used for up to 93% strain level beyond which an 8.5 MPa YM was used. For tension forces, a
0.044 MPa YM was assigned at zero strain and increased to 0.44 MPa at 50% strain after which
a 0.032 YM was used to describe the point of permanent deformation in which fibers are
breaking.
Summary
Our attempts at approximating the Jones et al creep response data using a best fit model based on
the Standard Linear equation lead to designing a new research protocol to obtain data that can be
described by a non-linear constitutive equation such as the Mooney-Rivlin model. A constitutive
equation is the only way to truly describe a materials behavior while a best fit approximation
curve can only suggest a best guess about a material’s property. The PDL’s biomechanical
properties must be further investigated to provide a better model and ultimately a more reliable
10
REFERENCES
1. Bourauel C, Freudenreich D, Vollmer D, Kobe D, Drescher D, Jager A. Simulation of orthodontic tooth movements. A comparison of numerical models. J Orofac Orthop. 1999;60(2):136-151.
2. Brosh T, Machol IH, Vardimon AD. Deformation/recovery cycle of the periodontal ligament in human teeth with single or dual contact points. Arch Oral Biol. 2002;47(1):85-92.
3. Dong-Xu L, Hong-Ning W, Chun-Ling W, Hong L, Ping S, Xiao Y. Modulus of elasticity of human periodontal ligament by optical measurement and numerical simulation. Angle Orthod. 2011;81(2):229-236.
4. Toms SR, Dakin GJ, Lemons JE, Eberhardt AW. Quasi-linear viscoelastic behavior of the human periodontal ligament. J Biomech. 2002;35(10):1411-1415.
5. Berkovitz B, Moxham B, Newman H. The periodontal ligament in health and disease. Elmsford, NY: Pergamon Press; 1982.
6. Proffit W, Fields H. Contemporary orthodontics. Mosby- Year Book, Inc., Baltimore. 1993.
7. Muhlemann HR. Tooth mobility: The measuring method. initial and secondary tooth mobility.
Journal of Periodontology. 1954;25(January):22-29.
8. Parfitt GJ. Measurement of the physiological mobility of individual teeth in an axial direction.
J Dent Res. 1960;39(3):608-618.
9. Picton DCA. On the part played by the socket in tooth support. Archives of Oral Biology. 1965;10:945-955.
10. Wills DJ, Picton DCA, Davies WIR. An investigation of the viscoelastic properties of the periodontium in monkeys. Journal of periodontal research. 1972;7:42-51.
11. Wills DJ, Picton DCA, Davies WIR. A study of the fluid systems of the periodontium in macaque monkeys. Archives of Oral Biology. 1976:175-185.
12. Bien SM. Hydrodynamic damping of tooth movement. J Dent Res. 1966;45(3):907-914.
13. Ng GC, Walker TW, Zingg W, Burke PS. Effects of tooth loading on the periodontal vasculature of the mandibular fourth premolar in dogs. Archives of Oral Biology.
1981;26(3):189-195.
11
15. Natali AN, Pavan PG, Scarpa C. Numerical analysis of tooth mobility: Formulation of a non-linear constitutive law for the periodontal ligament. Dent Mater. 2004;20(7):623-629
16. Rees JS, Jacobsen PH. Elastic modulus of the periodontal ligament. Biomaterials. 1997;18(14):995-999.
17. Jones ML, Hickman J, Middleton J, Knox J, Volp C. A validated finite element method study of orthodontic tooth movement in the human subject. J Orthod. 2001;28(1):29-38.
18. Qian L, Todo M, Morita Y, Matsushita Y, Koyano K. Deformation analysis of the periodontium considering the viscoelasticity of the periodontal ligament. Dent Mater. 2009;25(10):1285-1292.
19. Dorow C, Krstin N, Sander FG. Determination of the mechanical properties of the
periodontal ligament in a uniaxial tensional experiment. J Orofac Orthop. 2003;64(2):100-107.
20. Sanctuary CS, Wiskott HW, Justiz J, Botsis J, Belser UC. In vitro time-dependent response of periodontal ligament to mechanical loading. J Appl Physiol. 2005;99(6):2369-2378.
21. Cattaneo PM, Dalstra M, Melsen B. The finite element method: A tool to study orthodontic tooth movement. J Dent Res. 2005;84(5):428-433.
22. Middleton J, Jones M, Wilson A. The role of the periodontal ligament in bone modeling: The initial development of a time-dependent finite element model. American Journal of Orthodontics
and Dentofacial Orthopedics. 1996;109(2):155-162.
23. Canales C, Larson M, Grauer D, Sheats R, Stevens C, Ko C. A novel biomechanical model assessing continuous orthodontic archwire activation. American Journal of Orthodontics and
12
CHAPTER 2: Biomechanical characterization of the periodontal ligament: orthodontic tooth movement
Introduction
The dental periodontal ligament (PDL) is the most deformable tissue in the periodontium
and stress/strain within the PDL is the key to orthodontic tooth movement.1-7 Due to limited
mechanical information of the PDL, almost all biomechanical assessments for clinical tooth
movement are empirically-driven. The ability to measure stress/strain levels throughout the PDL
would provide valuable information in predicting orthodontic tooth movement. It is not possible
to provide this type of information in a live patient and therefore interest in finite element
analysis (FEA) for simulating tooth movement has increased. Finite Element (FE) models of
tooth movement allow for the only possibility of investigating stress/strain levels throughout the
periodontium. These models are only as accurate as their geometry and material properties.
Currently, material properties used for the PDL are mostly based on linear assumption that has limited FEA’s usefulness. To date, the complete quantification of the non-linear stress/strain
relationship in the PDL is unavailable.
Several PDL studies have been completed aiming to characterize the PDL’s
biomechanical properties.3,6,8-15 In vitro PDL studies report mostly single linear values for Young’s Modulus (E) ranging from 1.18-6.0 MPa as shown in Table (1).8,10-12
Recently,
investigators used different methods to represent the modulus of the PDL. The bilinear method
allows for better approximation of the PDL’s non-linearity as it reports two different slope values
13
equation that calculates the PDL’s stress/strain curves to match experimentally measured
stress/strain curves best represent the PDL’s non-linear behavior. This has been attempted using
the Mooney-Rivlin Hyperelastic (MRH) model and shown to best represent the PDL’s
non-linearity.5,13,16
In the late 1990s, as computer processing speeds increased, more investigators became
interested in matching FE model predications to experimental outcomes to determine PDL
modulus. Table (2), shows the different methods and modulus values reported for their
respective FE models.3,5,6,13,17-21 Early FE models predicting tooth movement contained linear
isotropic modulus values for the PDL in order to simplify the solution. Linear PDL models for
FEA contain modulus values ranging from 0.68-1750 MPa. Recently, Cattaneo used piecewise
linear modulus values depending on strain level and whether compression or tension forces were
present.21 On the compression side, a modulus of 0.005 MPa was used for up to 93%
compressive strain level beyond which an 8.5 MPa modulus was used. For tension strains, 0.044
MPa modulus was assigned at zero strain gradually increased to 0.44 MPa up to 50% strain, after
which a modulus of 0.032 MPa was used to describe the point of permanent deformation in
which fibers break. It is well documented that the PDL is a non-linear tissue. Although the
piecewise linear PDL model might provide an improved prediction, a constitutive model with a
continuous function being able to describe the PDL mechanical behavior and validate it with
accurate experimental data is still at the infant stage.
Between 2002-2008, Natali et al, Pietrzak et al, and Qian et al proposed to use the MRH
material constitutive equation for PDL stress-strain relationship.5,13,16 The MRH model, which is
derived from strain energy density functions, is a non-linear elastic model. It allows the PDL to
14
accurate predictor than linear elastic models. Unfortunately, none has acquired the PDL data
from an isolated sample with uniaxial tensile testing. The validity of the MRH model for PDL
characterization and for orthodontic biomechanical simulation remains untested. Qian has used
the MRH model to approximate data from intrusion tests of porcine cross sectional samples. It
was found that the MRH model agreed with the measured load-displacement data well. We
propose to use this model, but on data taken from uniaxial tension tests of PDL segments.
Models derived from in-vivo whole tooth experiments would be ideal since the PDL’s
biomechanical properties likely rely on vasculature and preserving the natural physiology of the
periodontium is ideal. The displacement data would include information about deformation of the entire PDL, however, a different “experience” occurs depending on anatomic location within
the alveolar socket of the tooth that is being displaced. In vitro studies are necessary because in
order to develop true constitutive equations, stress-strain data must be obtained from PDL
samples with known geometry and known force magnitude and direction. Such experiments
cannot be done in-vivo.
For clinicians and scientists, prediction of stress/strain in PDL is critical information to
manage tooth movement. However, accuracy of predictions by FEA is limited by its dependence
on parameters set for the geometry and the material properties of bone, tooth, and PDL.21,22 The
biomechanical parameters used for hard tissues such as bone, dentin, and enamel have been
validated and are reliable, while the parameters for the PDL are not. The present study used a
Dynamic Mechanical Analyzer (DMA) machine which is designed to study the dynamic
properties of polymers. It uses ultra-sensitive optical encoder technology to measure strain. It has
a higher force resolution (.002N) than MTM units and therefore a higher capacity to measure
15
rather than strain controlled. Modulus values calculated from in vitro experimental data will be
compared to see the effects of anatomic location and force levels. We hypothesize that modulus
is dependent upon anatomic location and force levels. The MRH model will be applied to fit
experimental data and used in a FEA simulation of orthodontic tooth intrusion.
Methods
The DMA machine is designed to test viscoelastic materials including films and thin
samples. It provides high force resolution (.002N) which should provide more reliable data given
the likely physiologic strain range is very small for the PDL. See Figure 1 for a flow chart of
experimental design. The jaws were collected within an hour of slaughter, transferred in an iced
cooler, and stored in a -10°C freezer. Soft tissue was removed from the mandible using a #10
blade, hemostat, and forceps. Block mandibular incisor-bone segments were grossly sectioned
out by cutting with a band saw while manually cooling with saline irrigation. Each incisor-bone
specimen was sectioned out individually with periodontium intact. Mid root cross-sectional cuts
were made with a wet diamond saw circular blade in 1.4 mm increments. Figure 2 represents the
typical process for creating final samples for DMA testing. The diamond saw blade was used to
shape each sample into rectangles of about 7mm x 4mm x 1.4mm. Specimens were stored in
saline and frozen until use. Previous studies have shown that similar tissue such as ligaments and
tendons have only minor changes that occur after freezing and storage.14 37 total samples were
obtained from two different jaws.
Samples were thawed just prior to DMA testing. A previous study on rats demonstrated
that PDL strength remained unchanged after 36 hours of saline storage.23 Dimensions were
16
was measured with a micrometer slide (Gaertner Scientific Corporation; Skokie, Illinois) with a
10x scope. The samples were measured at top, middle, and bottom of the width of the PDL and
an average of the 3 measurements was used for final length values. Widths and thicknesses were
measured with calipers.
Figure 3 is a schematic for the DMA setup for uniaxial tension experiments. The standard
distance between the floating clamp and fixed clamp was 15mm. A custom clamp was fabricated
to shorten the distance to 5mm between clamps which allowed direct clamping of bone and
dentin. Care was taken to carefully clamp each specimen for testing. Samples were loaded by
first securing bone portion to the custom lower fixed clamp, orienting it to the upper floating
clamp, and then securing the tooth portion to the floating upper clamp. The load assembly was
then placed in the saline bath containing 22 mL of saline to prevent dehydration. Each sample
was loaded to 3 specified force levels (0.5N, 1.0 N, 3.0N) during 1 minute duration and then
unloaded at the same rate, all in a consecutive manner with 2 minutes rest period between each
run. A couple of samples were fixed and critical freeze point dried for viewing under a Scanning
Electron Microscope (SEM).
Stress-Strain experimental data was analyzed, specifically loading curves, for effect of
location and force on modulus. Locations were recorded as mesial, distal, facial, or lingual.
Modulus values were calculated from loading curves. All 0.5 N loading curves were assumed
linear and one modulus value (E1 only) was calculated using the endpoints of the loading curve.
1.0 N loading curves were halved and using the endpoints, two modulus values (E1, E2) were
calculated. A similar approach was taken with the 3.0 N data; except loading curves were
segmented into thirds and 3 different modulus values (E1, E2, E3) were calculated. Moduli were
17
typical run for one sample (zeroed) and where E1, E2, and E3 regions would occur. By taking
the slope (or modulus) of piecewise linear segments, comparisons can be made to determine
differences in means for moduli at different anatomic locations and different force levels. Both
one-way and two-way ANOVA were used for analysis with two major factors being the location
and force level.
A four tooth FE model simulating orthodontic intrusion of a lateral incisor was used to
compare conventional linear PDL model versus non-linear MRH PDL model. Figure 5 shows the
FE model containing upper left central incisor, lateral incisor, canine, and first premolar with
brackets (.022 in slot) bonded and a rectangular steel wire (.019 x .025 in) with an intrusion bend
at the lateral. The model is described in a previous paper by Canales et al.20 Table (3) shows the
material properties typically used for FEM. Simulation using linear elastic PDL modulus of 0.5
GPa and Poisson’s ratio of 0.45 for the PDL was compared to a simulation with the MRH PDL
model in ANSYS 10.0 (ANSYS; Canonsburg, PA). One 3.0N loading curve was selected to
curve fit using the MRH equation. Constants were adjusted until the MRH model best fit the
experimental curve. Birth and death simulation was performed to compute stresses and strains in
PDL and surrounding bone particularly at the lateral incisor. Maximum and minimum principle
stresses and strains were compared to evaluate differences between the two models.
Results
Average modulus values for the E1, E2, and E3 regions with equal applied force level at 3.0 N can be compared to investigate changes in the PDL’s modulus at different regions within
the loading curve. Table (4) reports mean modulus values of 3.0 N loading data for E1, E2, and
18
plot (Figure 6) confirmed that greater E1 and E2 corresponded to higher E3. There was a
statistically significant difference (P<.0001) for mean modulus among E1, E2, and E3. The
largest difference was between E1 and E2 which confirms the stiffening effect of the PDL as it goes from the “toe” region (E1) to the linear region (E2). Differences between E2 and E3 were
not as great which would be expected since this region should represent the “linear” part of the
loading curve.
The investigate location and modulus, mesial and distal samples were combined and
compared with combined facial and lingual samples. Combining surfaces allowed for more
balanced and larger sample sizes. There were 20 total samples for facial plus lingual group and
17 total samples for mesial plus distal group. E1, E2, and E3 values were compared across the
same force group (3.0 N) to determine if location had an effect on modulus, see table (5). There
was a statistically significant difference in means found at E2 (P<.05) and E3 (P<.05) for the two
sample groups. Figure 7 illustrates two main points. First, facial and lingual surfaces were
consistently stiffer than mesial and distal surfaces. Second, the modulus change was greater
between E1 and E2, and plateaued between E2 and E3 which suggests non-linear behavior as
discussed previously.
To investigate the effect of force on modulus, mean modulus values were compared for
the E1 group across all three force levels. There was a statistically significant difference in
modulus values (p=0.003) between the three force levels. Table (6) shows the means for modulus
values at 0.5, 1.0, and 3.0 N were 0.69±-0.41, 0.82±-0.48, and 1.10±0.63 MPa respectively. The
mean modulus does increase with increasing strain rate which is typical for viscoelastic
tissues.SEM images were taken of two selected samples of different anatomic location and initial
19
to see if fiber orientation could be appreciated. A lingual sample of 2.30mm in length was
selected and compared with a distal sample of 0.83mm in length. Figure 8, shows SEM images
of high and low magnification for each sample and their respective loading curves. One can
appreciate the difficult in defining the border of the bone to determine final length as it is very
undulating. Maximum and minimum length of the PDL space from the SEM images were
measured using Image J software (Image J; Bethesda, Maryland). The distal sample had a
maximum measurement of 0.91 mm and a minimum of .46; the experimental measurement of
length was 0.83mm. The lingual sample had a maximum measurement of 3.02mm and minimum
measurement of 1.33mm; the experimental measurement of length was 2.30mm. The
experimental measurements were within the maximum and minimum range for both samples and
appear to be appropriate. There is obvious approximation of length due to the irregularities that
exist which inherently give some level of error to any linear measurements. Also, the assumption
of a rectangular shape to calculate stress area has some error due to these irregularities. These
measurement errors are likely small enough that they can be ignored and data considered valid.
Average PDL sample dimensions were 1.42±0.47mm x 5.57±1.06mm x 1.38±0.14mm.
Bovine PDL width was much larger than 0.5mm width typically reported for human species. No
significant association was found between any specific dimension and E1 modulus values.
Therefore, sample size did not affect modulus at E1. There was borderline significance for
thickness (P=0.77). Standard deviations were fairly large for the width and length dimensions
and could have confounded results if not for this finding. Thickness had much smaller standard
deviation and therefore the borderline significance may not be as impactful in terms of
20
FE simulations of lateral incisor intrusion analyzing maximum/minimum principal
stresses and strains within the PDL and bone were compared for conventional linear versus MRH
PDL models. Outcomes from our experimental data suggest a linear modulus of about 1.0 MPa.
The conventional linear FE model constructed from CAD program in ANSYS did not converge
using a low modulus for the PDL. Stiffer modulus values were attempted until FE model solved. A PDL modulus of 0.5 GPa and Poisson’s ratio of 0.45 was used for the conventional linear
model. The same FE model was solved using the MRH PDL constitutive equation and the
simulation converged in approximately 4 hours computer time. Figure 9 shows the calculated
Mooney-Rivlin curve’s excellent fit of the experimental data. Table (7) shows the constants used
for the Mooney-Rivlin equation.
Outcomes of the conventional linear FE model versus the MRH FE model showed
differences in stress/strain levels throughout the periodontium for the simulation of orthodontic
intrusion of a lateral incisor in ANSYS. Figures 10 and 11 show color map comparisons of
principal strain and exaggerated deformation simulations respectively. Figure 10 shows that the
linear model experienced little strain throughout the PDL while the MRH model experienced
relatively higher strain values, especially at the lingual-coronal and facial-apical regions shaded
in red. The color map of the MRH model indicates the deformation of the lateral incisor, with
highest tensile strain values in red indicating that the apex of the root moved lingually and the
coronal part moved facially. Additionally, figure 11 shows the MRH model having an intrusion
deformation at the apex along with rotation of the tooth around the center of resistance while the
21 Discussion
The range of our modulus values (0.69-2.52 MPa) are in close agreement with other
empirical data.9,11,13,15,18,19,24 The data suggests PDL non-homogeneity and non-linear modulus
behavior. At low strain range, the modulus stiffens with increased force and eventually plateaus.
Many authors describe this low strain range area as the “toe” region of the loading curve, where
the periodontal ligament stiffens as the load increases.14 At initial loading, the collagen fibers “uncrimp” and lengthen in response to the force. This uncrimping produces the initial large
deformation and the stretched fibers quickly increase modulus in the toe region of the curve. At
higher strain range, the loading curve becomes linear and modulus remains constant. The PDL
behavior is elastic in this region of the loading curve. Figure 7 illustrates the non-linear modulus
behavior of the PDL as it shows that at low strain range the PDL is very deformable and at high
strain range it stiffens. Modulus values for low strain range (E1) versus increasing force are
shown in Table (6). The modulus appears to have a direct relationship with force in this low
strain range area as it increased with increased load. Strain rate increased with increased force
level because all samples were loaded with the same duration of time. Therefore, increased strain
rate led to an increased PDL modulus. One would expect this result from a viscoelastic tissue
such as the PDL.
The Modulus values were different at different anatomic locations. The facial and lingual
surfaces were stiffer than the mesial and distal surfaces (58% at E1, 72% at E2, and 67% at E3),
which have not been reported previously. The SEM images (Figure 8) provide a view of fiber
orientation which may play an important role in this difference. At low magnification, the PDL
strands appear to have an oblique orientation for the distal sample and a horizontal orientation
22
orientation for each sample. It is apparent that the lingual sample is stiffer from observation of
the loading curves. Its horizontal fiber orientation may contribute to this higher stiffness as these fibers may already be “uncrimped” as opposed to the obliquely oriented fibers of the distal
sample which must “uncrimp” before stiffening. More thorough investigation is necessary to
determine association of fiber orientation and modulus.
As form usually follows function, this would appear to make sense that facial-lingual
surfaces were stiffer since mandibular incisors likely receive loads in a facio-lingual direction
more so than a mesio-distal one. Exact corono-apical position was not recorded and studies have
shown that apical and coronal areas of PDL are stiffer than mid-root.25 Most sections were mid
root, but a few were taken more apically which may have impacted modulus means. The data
does suggest that the PDL is non homogeneous.
Samples were not preconditioned as suggested by other authors although a small preload
of 0.1N was used for each sample. The theory of preconditioning is that samples should be
cyclically loaded to condition samples to be in a more physiologically active loaded state as they
would be in the body.14 Also, preconditioning obtains a stable response and allows for better
comparison of data. This is controversial though as there is no evidence about whether collagen
fiber bundles in the PDL are in a tensed state or not. A preload of 0.1N is applied to each sample
as part of initialization prior to start of first tensional loading. Figure 12A shows a trial run
completed where a sample was consecutively loaded six times to 1.0 N in 1 minute. Zero point is
set by the manually entered measured sample length and from the raw data it is noticeable that the sample length can be compressed beyond initial starting point. All data trials were “zeroed”
by subtracting or adding the increment difference that the sample was from its initial zero length.
23
different than the subsequent ones. It was about 5% stiffer than the remaining loading curves.
After the first loading curve, the subsequent consecutively loaded curves were consistent. Since
preconditioning is less important when evaluating loading curves versus unloading, it was
thought better to protect the samples from further degradation that to perform added loading on
the samples. This lack of preconditioning may lead to some deviation of E1 values since they
were the initial loading curves. Reported values may be a little stiffer than should be if
conditioned. Additionally, as shown in the SEM images, fiber orientation may have played a role
in the 5% difference observed.
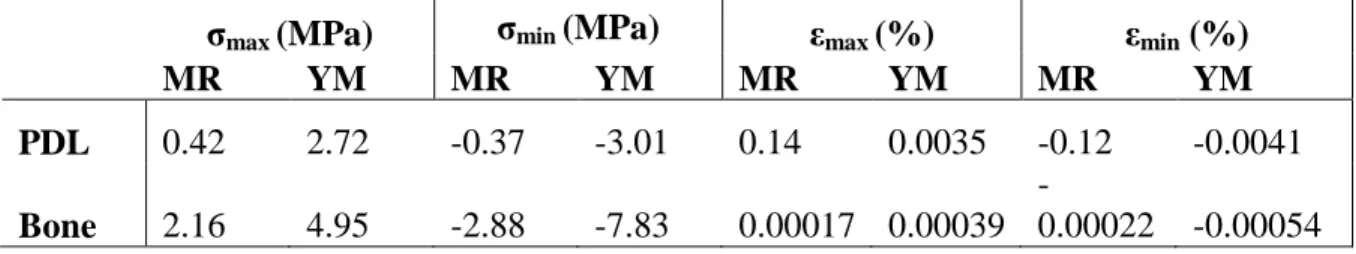
The FEA results were for the linear elastics model versus the hyperelastic model. Table
(8) compares maximum and minimum stress and strain values at the PDL and bone for both
models. The MRH model maximum strain levels were 35-40 times higher than the linear model,
while PDL maximum stress levels were 7-10 times lower. Additionally, maximum stress levels
at the bone surface was highest at the cortical buccal plate for both models, but the linear model
had maximum stress levels 2-3x higher due to the stiffer ligament transmitting any force directly
to the alveolar bone.
The MRH model’s strain levels within the PDL theoretically appear to be a much more
appropriate response to an intrusive force than the linear elastic models. The PDL of the lateral
incisor showed higher strain levels at the apex where one would expect it. There was also some
increased strain at the linguo-coronal aspect as one might expect. Higher strain levels were found
at the apex and coronol aspects of the PDL which has been supported in previous studies. The
24
Limitations: The experimental design includes animals that are sacrificed and data
obtained post mortem. The vasculature is not maintained and this could affect cell function and
fluid replenishment, affecting mechanical function of the PDL. Additionally, bovine PDL may
have different geometry and intrinsic biomechanical properties than human PDL. Nevertheless,
the literature has been reported that viscoelastic properties of the PDL across different
mammalian species are similar.9 Our data showed proximity of the bovine PDL to human PDL.
The ages of the cows were unknown and studies have shown the PDL becomes stiffer with age
in rats, which may or may not translate to bovine PDL.25 Another source of error is the
assumption of a rectangular PDL. From SEM images it is apparent the boundary of the tooth can
be curved and the bone is undulating and therefore the shape of the PDL is not rectangular.
Length measurements from the SEM image were compared with the values measured under the
micrometer slide. Length values were within maximum and minimum measurements suggesting
reasonable approximation of length. The SEM images may also suggest the importance of fiber
orientation in relation to modulus. If you compare the modulus values for the two samples, the distal one is 0.38 MPa and the lingual one is 1.15 MPa at E1 or low strain range. It’s possible
that the horizontal fiber orientation of the lingual sample contributed to the increased stiffness as
there was less uncrimping necessary in comparison to the distal sample in which the obliquely
oriented fibers would have to straighten and uncrimp to stiffen. More studies are required to look
at fiber orientation and modulus.
Uniaxial tension testing was intentional chosen in order to control for direction of force
and deformation of collagen fibers. Other authors have used cross sectional samples containing
intact root-PDL-bone for cyclic loading using intrusion/extrusion forces. This method of
25
stretch vertically and horizontally. This increased complexity may invalidate findings as not
representative of the true intrinsic mechanical nature of the collagen fibers within the PDL. Toms
et al performed such cyclic loading tests on cadaveric human mandibular premolar samples.15
They found a range of E1= .01-.05 MPa and E2= 0.6-1.1 MPa which was lower, but similar to
our findings. Such difference could be attributed to several variables such as strain rate,
thickness, anatomic location, force direction, force velocity, species differences, and much more.
It is interesting the results were not that far from each other despite different method of
measurement and sample species.
Conclusions
Modulus is within the reasonable range. The data suggests non-homogeneity of the PDL
in which modulus is affected by both force levels and anatomic location. Facial-lingual surfaces
were stiffer than mesial-distal surfaces. A Mooney-Rivlin model for the PDL provided an
improved outcome for an FEM orthodontic simulation. The results will contribute to the
understanding of the non-linear behavior of the PDL. Future investigations are needed to
26
REFERENCES
1. Bourauel C, Freudenreich D, Vollmer D, Kobe D, Drescher D, Jager A. Simulation of orthodontic tooth movements. A comparison of numerical models. J Orofac Orthop. 1999;60(2):136-151.
2. Brosh T, Machol IH, Vardimon AD. Deformation/recovery cycle of the periodontal ligament in human teeth with single or dual contact points. Arch Oral Biol. 2002;47(1):85-92.
3. Dong-Xu L, Hong-Ning W, Chun-Ling W, Hong L, Ping S, Xiao Y. Modulus of elasticity of human periodontal ligament by optical measurement and numerical simulation. Angle Orthod. 2011;81(2):229-236.
4. Fill TS, Carey JP, Toogood RW, Major PW. Experimentally determined mechanical properties of, and models for, the periodontal ligament: Critical review of current literature.
Journal of Dental Biomechanics. 2011;2(1)
5. Natali AN, Pavan PG, Scarpa C. Numerical analysis of tooth mobility: Formulation of a non-linear constitutive law for the periodontal ligament. Dent Mater. 2004;20(7):623-629.
6. Poppe M, Bourauel C, Jager A. Determination of the elasticity parameters of the human periodontal ligament and the location of the center of resistance of single-rooted teeth a study of autopsy specimens and their conversion into finite element models. J Orofac Orthop.
2002;63(5):358-370.
7. Slomka N, Vardimon AD, Gefen A, Pilo R, Bourauel C, Brosh T. Time-related PDL: Viscoelastic response during initial orthodontic tooth movement of a tooth with functioning interproximal contact-a mathematical model. J Biomech. 2008;41(9):1871-1877.
8. Atkinson HF, Ralph WJ. In vitro strength of the human periodontal ligament. J Dent Res. 1977;56(1):48-52.
9. Dorow C, Krstin N, Sander FG. Determination of the mechanical properties of the periodontal ligament in a uniaxial tensional experiment. J Orofac Orthop. 2003;64(2):100-107.
10. Dyment MI, Synge JL. The elasticity of the periodontal membrane. Oral Health. 1935;25(3):105-109.
11. Mandel U, Dalgaard P, Viidik A. A biomechanical study of the human periodontal ligament.
J Biomech. 1986;19(8):637 <last_page> 645. doi: 10.1016/0021-9290(86)90169-7.
27
13. Qian L, Todo M, Morita Y, Matsushita Y, Koyano K. Deformation analysis of the periodontium considering the viscoelasticity of the periodontal ligament. Dent Mater. 2009;25(10):1285-1292.
14. Sanctuary CS, Wiskott HW, Justiz J, Botsis J, Belser UC. In vitro time-dependent response of periodontal ligament to mechanical loading. J Appl Physiol. 2005;99(6):2369-2378.
15. Toms SR, Lemons JE, Bartolucci AA, Eberhardt AW. Nonlinear stress-strain behavior of periodontal ligament under orthodontic loading. Am J Orthod Dentofacial Orthop.
2002;122(2):174-179.
16. Pietrzak G, Curnier A, Botsis J, Scherrer S, Wiskott A, Belser U. A nonlinear elastic model of the periodontal ligament and its numerical calibration for the study of tooth mobility. Comput
Methods Biomech Biomed Engin. 2002;5(2):91-100.
17. Rees JS, Jacobsen PH. Elastic modulus of the periodontal ligament. Biomaterials. 1997;18(14):995-999.
18. Tanne K. An evaluation of the biomechanical response of the tooth and periodontium to orthodontic forces in adolescent and adult subjects. J Orthod. 1998;25(2):109-115.
19. Jones ML, Hickman J, Middleton J, Knox J, Volp C. A validated finite element method study of orthodontic tooth movement in the human subject. J Orthod. 2001;28(1):29-38.
20. Canales C, Larson M, Grauer D, Sheats R, Stevens C, Ko CC. A novel biomechanical model assessing continuous orthodontic archwire activation. Am J Orthod Dentofacial Orthop.
2013;143(2):281-290.
21. Cattaneo PM, Dalstra M, Melsen B. The finite element method: A tool to study orthodontic tooth movement. J Dent Res. 2005;84(5):428-433.
22. Ko C, Rocha E, Larson M. Finite element analysis - from biomedical applications to industrial developments. InTech-Open Access: www.intechopen.com. 2012:3-24.
23. Chiba M, Kinoshita Y, Nakamura G, et al. Effects of storage of jaws in saline and of velocity of loading on the force required to extract the rat mandibular first molar. Arch Oral Biol.
1982;27(10):905-907.
24. Middleton J, Jones M, Wilson A. The role of the periodontal ligament in bone modeling: The initial development of a time-dependent finite element model. American Journal of Orthodontics
and Dentofacial Orthopedics. 1996;109(2):155-162.
25. Berkovitz B, Moxham B, Newman H. The periodontal ligament in health and disease. Elmsford, NY: Pergamon Press; 1982.
28 TABLES
Table 1. Modulus values from studies reporting bilinear moduli from experimental data. Modulus has been reported using three different methods: linear, bilinear, and continuous non-linear.
Author Modulus Sample Method Model
Linear
Dyment (1935) 1.18 MPa Bovine Uniaxial Linear
Atkinson (1977) 3.8 MPa Human Uniaxial Linear
Mandel (1986) 3.0 MPa Human Extrusion Linear
Pini (2002) 3.0-6.0MPa Bovine Uniaxial Linear
Bilinear
Dorow (2003) E1= 0.15 MPa E2= 5.24 MPa
Porcine Uniaxial Bilinear
Continuous Non-linear
Natali (2004) Constitutive
Equation Human Load-Displacement Mooney-Rivlin Qian (2009) Constitutive
29
Table 2. List of FEM studies and their reported PDL modulus values. Linear, Bilinear, piecewise linear, and continuous non-linear methods have all been used to model the PDL.
Author Modulus Sample Method Model
Linear
Rees and Jacobson (1997) 50 MPa Human Load-Displacement Linear
Tanne (1998) 0.68 MPa Human Load-Displacement Linear
Jones (2001) 1 MPa Human Load-Displacement Linear
Canales et al (2013) 1.75 GPa Human Load-Displacement Linear
Piecewise linear and Bilinear
Poppe (2002) E1= .05 MPa Human Load-Displacement Bilinear
E2= .28 MPa
Cattaneo (2005)
<-93%= 8.5 MPa
Human Load-Displacement Piecewise
0 to-93%= 0.005 MPa 0 to 25% = 0.004 MPa 25 to 50%= 0.44 MPa >50% = 0.032 MPa
Qian (2009) E1=0.1 MPa Porcine Intrusion/Extrusion Bilinear
E2=0.8 MPa
Dong-Xu (2011) E1= 0.04 MPa
E2= 0.016 MPa Human Load-Displacment Bilinear
Continuous Non-linear
Natali (2004) Constitutive equation Human Load-Displacment
Mooney-Rivlin
Qian (2009) Constitutive equation Porcine Intrusion/ Extrusion
Mooney-Rivlin
Young’s Modulus
(GPa) Poisson’s ratio
Enamel 84.1 0.33
Dentin 18.3 0.31
Pulp 0.002 0.45
Periodontal ligament 0.5 0.45
Lamella dura 15.0 0.33
Cortical Bone 15.0 0.30
Cancellous Bone 0.25 0.30
30
Table 4. Mean modulus values for E1, E2, and E3 for 3.0 N loading. Strain level (low to high)
E1 E2 E3
Mean+/-Std dev
(MPa) 1.1+/- 0.63 2.21+/-1.16 2.59+/-1.53
Table 5. Mean modulus values comparing facial and lingual surfaces with mesial and distal surfaces using a two way ANOVA.
Mean Modulus (Mpa) Facial +
Lingual
mean+/- std dev
Mesial + Distal mean+/-std dev
Significance
E1 1.36+/-0.64 0.79+/-0.47 NS E2 2.53+/-1.12 1.83+/-1.12 *p<.05 E3 3.06+/-1.35 2.05+/-1.6 *p<.05 NS= not significant
Table 6. Mean modulus values at E1 region for all three force levels.Statistical significance found (p=.003) between the 3 force levels using repeated measures ANOVA.
Mean Modulus (MPa) mean+/-std dev
0.5 N 0.69+/-0.41 1.0 N 0.82+/-0.48 3.0 N 1.10+/-0.63
Table 7. Constants for the Mooney-Rivlin equation. Constant Value
(MPa) C10 -0.2055
C01 0.42
31
Table 8. Maximum and minimum stress/strain values for Mooney-Rivlin and Linear FEM models.
σmax (MPa) σmin (MPa) εmax (%) εmin (%)
MR YM MR YM MR YM MR YM
PDL 0.42 2.72 -0.37 -3.01 0.14 0.0035 -0.12 -0.0041
Bone 2.16 4.95 -2.88 -7.83 0.00017 0.00039
32 FIGURES
Figure 1. Flowchart of experimental design.
Figure 2. A) Shows central incisor sectioned out of the mandible with black lines representing cross-sectional cuts made. B) Shows samples of cross sectional cuts. Notice there is no bone available on the buccal and very little on the lingual, therefore mesial and distal segments were chosen in this case. C) Shows final samples ready for testing.
Figure 3. DMA schematic shows the floating clamp (blue) and the fixed clamp (gray) which is attached to the saline bath. The sample sits within the bath and the floating arm rises upward in tension and downward in compression.
A B C
33
Figure 4. Average stress-strain curves for 0.5N, 1N, and 3N. Shaded regions approximate regions for E1, E2, and E3.
34
Figure 6. Scatterplot of E1 vs E2 vs E3.Facial-Lingual (green dots) samples appear more clustered at the top or stiffer region of the cube while Mesial-Distal (blue dots) appear clustered more at the bottom.
Figure 7. Modulus change is greater at lower strain range (between E1 and E2), than at higher strain range (between E2 and E3). Lingual and facial surfaces were consistently stiffer than mesial and distal surfaces.
0 0.5 1 1.5 2 2.5 3 3.5
E1 E2 E3
Lingual + Facial
35
Figure 8. A,B) SEM images of distal sample with tooth on left side and bone on right side of image. A) Low magnification of PDL space shows an oblique orientation of PDL’s collagen network. B) High magnification shows a similar oblique orientation of the collagen fibrils. C,D) SEM images of lingual sample with tooth on left side and bone on right side. C) Low
magnification of PDL space shows horizontal orientation of PDL’s collagen network. B) High magnification shows a similar horizontal orientation of the collagen fibrils. E) Stress-strain loading curve of above samples. Lingual sample was stiffer which may be partly due to its horizontal fiber orientation.
Figure 9. Three constants were adjusted until the Mooney-Rivlin curve (solid line) fit approximated the experimental data (dotted line).
36
37
38
Figure 12 A). Illustrates trial run a sample loaded to 1N at 1N/min for 6 consecutive times. B) All data zeroed to better visualize differences in slope. Initial loading curve was slightly stiffer than subsequent loading curves. Modulus comparison indicated about 5% stiffer.
-0.01 0 0.01 0.02 0.03 0.04 0.05 0.06 0.07
-0.05 0 0.05 0.1 0.15 0.2
Stres s (MPa) Strain Run 2 Run 3 Run 1 Run 4 Run 5 Run 6 -0.01 0 0.01 0.02 0.03 0.04 0.05 0.06 0.07 0.08
-0.05 0 0.05 0.1 0.15 0.2