Metabolomics of biofluids:
from analytical tools to data interpretation
ISBN: 978-94-6182-038-9
The printing of this thesis was financially supported by: Bruker BioSpin GmbH, Germany
Dionex Benelux B.V.
Beckman Coulter (Nederland) B.V. Bruker Nederland B.V.
Cover: fragment of “To Touch The Grass - 1” by Anton Shirkin.
Printing: Off Page, Amsterdam
Metabolomics of biofluids:
from analytical tools to data interpretation
Proefschrift
ter verkrijging van
de graad van Doctor aan de Universiteit Leiden, op gezag van Rector Magnificus Prof. Mr. P.F. van der Heijden,
volgens besluit van het College voor Promoties te verdedigen op woensdag 23 november 2011
klokke 16:15 uur
door
Ekaterina Nevedomskaya
PROMOTIECOMMISSIE
Promotor: Prof. dr. A.M. Deelder
Co-promotor: Dr. O.A. Mayboroda
Overige leden: Prof. dr. M.S. Gelfand
Institute for Information Transmission Problems RAS, Moscow, Russia
Dr. H. Keun
Dept. of Surgery and Cancer, Faculty of Medicine, Imperial College,
London, UK
Prof. dr. T.W.J. Huizinga
Prof. dr. P. Slagboom
Prof. dr. J.T. van Dissel
TABLE OF CONTENTS
General Introduction 9
PART I
Method development
Chapter 1 Gas chromatography/atmospheric pressure chemical ionization-time of flight mass spectrometry: analytical
validation and applicability to metabolic profiling 23
Chapter 2 Alignment of capillary electrophoresis–mass
spectrometry datasets using accurate mass information 47
PART II
Application to animal studies
Chapter 3 CE-MS for metabolic profiling of volume-limited urine
samples: application to accelerated aging TTD mice 65
Chapter 4 Metabolic profiling of accelerated aging ERCC1d/- mice 83
PART III
Application to human studies
Chapter 5 Integrating study design and clinical data into
metabolic profiling of urinary tract infection 109
Chapter 6 Cross-platform analysis of
longitudinal data in metabolomics 127
General discussion 153
Summary 161
Nederlandse samenvatting 165
Acknowledgements 171
Curriculum vitae 173
General Introduction
11
Variability of genomes in populations is a necessary prerequisite for evolution. Owing to it, populations adapt to the changing environment, conquer new territories and new species evolve. However, this genetic variability can only be seen at the population level; at the level of the individual its genome is constant and static. The genome defines the possibilities of a given organism to adapt to the environment, but does not reflect its actual state. As in modern medicine there is a conceptual shift to personalized health, the attention is being redirected from populations to individuals. Though the importance of genetics is hard to overestimate, new ways of assessing human individuality, or, in other words, the phenotype, are sought. The biochemical representation of the phenotype is believed to be most closely approximated by the metabolome – a collection of low-molecular-weight (<1 kDa) compounds (metabolites) present in an organism.(1) Metabolites are the products of all the biochemical processes in the organism, which makes them a more appropriate target for phenotype-based research than transcripts and proteins, which are information messengers and executors of the biochemical reactions, respectively.
The key words that characterize metabolomics are diversity and variation. These characteristics can be both virtue and vice for the metabolomics workflow (Figure 1). At different steps variation has either to be explored and used or reduced to the possible minimum.
O O
N
N N
N CH3
CH3
C
3
H
PC1
PC2
(A) Sample
(B) Measurement
(C) Data
(D) Pre-processing
(E) Statistical analysis (F) Biological interpretation
The variability that occurs in metabolomics, as well as in other ‘omics’-experiments, has three sources – biological, pre-analytical and analytical.(2) Unlike in animal experiments, in which it is relatively easy to standardize both the conditions under which the animals are kept and the handling of the samples, clinical experiments are much more susceptible to bias and interference. This variability affects the outcome of the existing clinical tests(3), and without question influences metabolomics results as well.
Already at the stage of planning the experiments and the study design it is important to reduce the part of biological variation which is not related to the question addressed by the study. When, for example, two groups of patients or patients and healthy controls are to be compared, it is important that the selected groups have minimum differences not related to the research aim. These can be associated with gender, age and diet. These factors have been shown to have a large effect on metabolic profiles.(4;5) It also has been shown that the differences due to the fact that samples are collected in different countries and cities can be easily detected in urine metabolic profiles.(6;7) These extremes should be avoided of course, but it is not difficult to imagine that in a typical multi-center clinical study samples come from different hospitals, than the results obtained from the data should be considered with great caution.
When samples are collected (Figure 1(A)) it is very important that the collection is highly standardized. First of all, the time of collection is an important factor to consider. Diurnal variation is not that obvious in case of blood plasma, but has a strong impact on metabolic profiles of urine.(8) The subjects should also either follow a certain diet or fast before the sample collection. Sample handling obviously also plays a role and such factors as the collection tubes, time on ice before freezing, temperature and time of storage, the
number of thaw-freeze cycles can introduce a considerable bias.(9)
General Introduction
13
requires less sample pretreatment and is non-destructive. MS-based technologies are very sensitive, but the range of the compounds detected is defined by the separation method
used, thus making it more targeted compared to 1H NMR, which is universal for all
molecules containing hydrogen, which in case of biological samples means very few exceptions. The combination of analytical methods can increase the coverage of the metabolome and thus lead to better understanding of the biological process under study as well as improve identification of the compounds.(12) However, due to many factors, such as, for instance, the high costs of the different instruments, the whole range of the machines suitable for metabolomics experiments is rarely present in one lab. Though the analytical capabilities and drawbacks of each of the platforms are known, it is less known which impact they have on the recovery of biological information. This knowledge is essential for making a decision about the suitability of a given analytical method for a certain biological/clinical application.
The reproducibility of analytical methods is not perfect and this obviously can result in variability in the data. MS-based methods are more prone to this variability compared to NMR, not only due to the nature of the instrumentation, but also because the samples need more extensive pre-treatment and preparation. The reproducibility of every technique should be carefully assessed in order to understand the possible drawbacks and the extent of post-processing needed. Also each of the methods has to be optimized to give minimum variability. A way to control the instrument performance while running long sequences of measurements is to use a set of analytical standards and quality control (QC) samples.(13)
combination of alignment and peak picking is most regularly used with a variety of available algorithms and software.(18-20)
After all the manipulations mentioned above the only variability that should be left in a metabolomics dataset is of biological origin. The unwanted part of it is related to the different dilution of the samples, which is most prominent in the case of urine due to different water uptake by the subjects. Normalization is the step that removes this variation. For this, a few methods are available: normalization to the total sum, to some
“housekeeping” molecules (e.g. to creatinine) and more sophisticated ones (e.g. Probabilistic
Quotient Normalization(21)), but none of them are optimal for all cases and the choice should be made depending on the biological context.(22)
The rest of the variation in the data has to be explored as this represents the biological variability (Figure 1(E)). The first step of the analysis is to investigate data structure in order to find patterns, natural grouping of the samples and possible outliers. This is done by
means of unsupervised methods, which do not use any a priori information about the data
and thus give an unbiased view. The most often used procedures are Principal Component Analysis (PCA) and its variations and clustering.
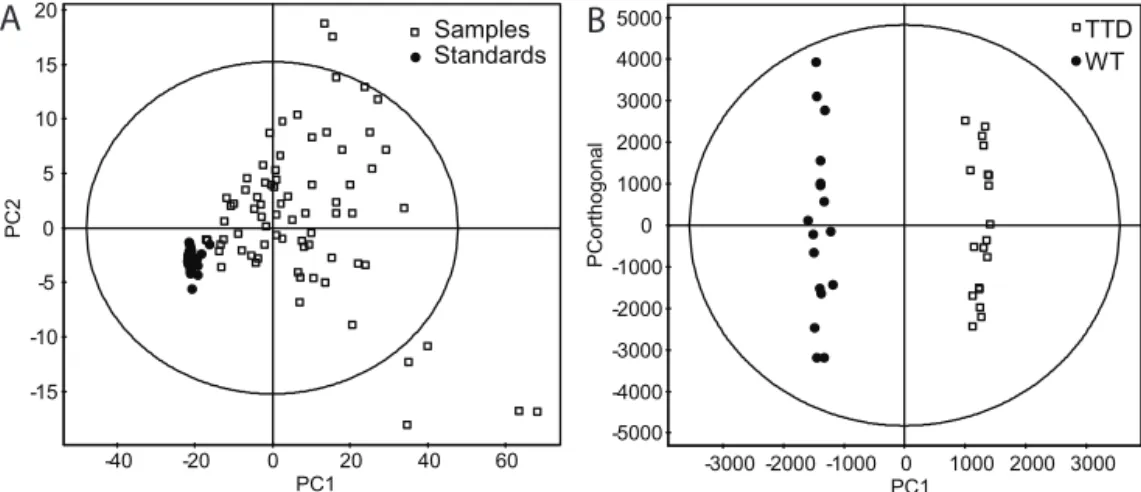
PCA is a projection-based method that summarizes the variation present in the data in a lower-dimension space. When applied to data containing both biological and QC samples it is possible to estimate the analytical variation in the data in comparison to the biological variability: QCs must have orders of magnitude less variation than the real samples, thus clustering tightly together. PCA is also extremely useful for identifying abnormal samples (outliers), which may have to be removed prior to any further analysis, and for detecting any grouping of samples. The latter might be related to the question of interest, addressed by the study, or might be related to other phenomena. The first case is very encouraging for continuation of the analysis. The second does not mean that subsequent analysis cannot be done, because often the studied differences are subtle and masked by other sources of biological diversity; it however implies a more careful selection of strategies for discrimination and especially for validation, as natural clustering of the samples might influence the results of cross-validation.
Clustering is a collection of unsupervised methods to assess inter-sample relations and identify natural groups of samples. There are many variants of clustering that use different
measures for the distance between the samples (Euclidean, Mahalanobis, Manhattan etc.),
different algorithms (hierarchical, partitioning etc.) and various initial assumptions (e.g.
General Introduction
15
As has already been mentioned above, in unsupervised methods the variation of interest is not necessarily reflected in the natural grouping of samples. The questions often posed in clinical metabolomics research are finding the differences between two and more groups of samples (from patients and controls, from subjects under various conditions and/or interventions) and predicting to which of the studied groups new samples belong. Statistically speaking the tasks are discrimination and classification, which are often carried out together in one method.
The abundance of discrimination/classification methods may appear confusing: projection-based methods (Partial Least Square Discriminant analysis (PLS-DA) and Orthogonal PLS-DA (OPLS-DA), Soft Independent Modelling of Class Analogies (SIMCA)), k-nearest neighbor algorithm (k-NN), artificial neural networks (ANN), support vector machine and others. The choice of a particular method for a certain application might to a large extent be based on the expertise of the user; however there are some factors that should be taken into consideration when selecting the procedure to be applied. One of them is the assumption about the distribution of the data: if there is the information available parametric methods can be used (for example, projection-based methods); without such information non-parametric methods are the preferred choice (k-NN, ANN). SIMCA, ANN, k-NN cope better with a large number of classes than discrimination methods. Discrimination methods show the best performance when the classes are tight, homogeneous in terms of dispersion and covariance structure; otherwise, classes should be modeled separately by means of SIMCA, for example. If samples belong to a number of definite classes, discrimination techniques are used; if not, class modeling techniques should be chosen.(23)
As mentioned above, most often in metabolomics and in particular in clinical metabolomics, the aim is to find the differences in profiles of two or more groups of samples. These differences might not be uncovered in a simple analysis. Thus larger groups have to be investigated in search of systematic variation and more sophisticated statistical methods are used. The latter can result in substantial overfitting and are more difficult to validate and interpret.
Modeling groups against each other averages the effects between the samples from one group and reduces the individual-specific variability. It already has been recognized by the clinical and especially the pharmaceutical community that averaging health and medication intervention effects between people is a dead end street for the development of future medicine and that more personalized approaches have to be found.(24)
due to unforeseen side effects. With the genomics boom after the completion of the Human Genome project, the answers for personalized medical care and treatment were sought with the help of genomics and resulted in the emergence of a new discipline – pharmacogenomics. Despite all the expectations of this new research field, the number of genomics-driven drug discoveries is low.(25) A possible explanation is that, despite the importance of genes for defining the phenotype, they are not the only factors responsible for determining the actual physiological and/or pathological state of the organism, the response to treatment and the clinical outcome. The metabolome, on the other hand, is much closer to the phenotype in comparison to other ‘omes’. The switch from genetic to metabolic “individuality” thus is logical and the need for such a switch is already recognized by the community.(26)
The idea of the connection of metabolism and human individuality and integrity is not new. It was first proposed and documented in the classical work of Sir Archibald E. Garrod “The incidence of alkaptonuria: a study in chemical individuality”, the title of which speaks for itself. "...No two individuals of a species are absolutely identical in bodily structure,” Garrod wrote as long ago as in 1902, “neither are their chemical processes carried out on exactly the same lines" .(27) The next progress in the field was made almost 50 years later by Roger J. Williams who demonstrated “evidence indicating that each individual possesses what may be called a "metabolic personality"-that is, a distinctive pattern of metabolic traits” and that these traits are maintained over a period of several months.(28)
As many other fundamental ideas, the idea of “metabolic personality”, although maybe
not enough appreciated at the time it appeared, came back in the 21st century. In the recent
publications of Assfalg et al. and Bernini et al. the two collaborating groups elaborated and
experimentally supported exactly the same basic thoughts – that “metabolic phenotypes” (the name changed slightly 60 years after R.J. Williams) do indeed exist and that they are stable over time.(29;30) As the analytical technologies have advanced enormously in the last decades, the analytical basis of the latest research is different from that of R.J. Williams – the use of NMR makes it possible to measure a large number of molecules in one run and to obtain precise quantitative information on these molecules. However, as shown by Assfalg et al., the full variety of metabolites assessed by NMR is not necessary to define the individual metabolic patterns – equally good results can be obtained using only a limited set of 12 compounds. The latter are even to a certain extent overlapping with those measured by Williams. The importance of metabolic phenotypes in relation to disease, nutrition and response to various stimuli has been outlined in both studies.
General Introduction
17
of such distinct profiles are related to homeostasis. Homeostasis is defined as “a state of dynamic balance with the variables fluctuating between tolerance limits”. The moment when “tolerance limits” are crossed and homeostasis lost can be considered as the moment of the onset of disease.(31) Detecting this occasion might enable early diagnosis, prognosis and possibilities for more successful intervention.
Both health and disease are dynamic entities, understanding of which would be possible only by monitoring them in time. As has been mentioned above, the key feature of the genome is that it is static. The metabolome, on the contrary, is highly dynamic, reflecting the changes happening over time and the reaction of the organism to the altering environment. As such, time-correlated changes of the metabolome will likely have more diagnostic and prognostic power than a single time point measurement.
There is an increasing awareness that metabolomics is of great importance for the medicine of the future due to its “personalized” and dynamic nature. However, to make this possible, the present strategies in metabolomics experiment design and data treatment should be changed. Currently metabolomics literature is dominated by “case-control” studies, which both average the effects between individuals and neglect the beneficial dynamic essence of metabolic profiles. Clinical metabolomics is not an exception, though the concept of “dynamic disease” has been around for a considerable time.(32) The advantages and the gain in information recovery obtained by dynamic profiling are starting to be recognized, but are not universally applied. In order to generalize its use it is important to change study design, sample collection and data analysis strategies.
Even when dynamic metabolomics data is being collected, the advantages of it are not always exploited as it is sometimes analyzed with the use of “classical” statistical methods, such as PCA and PLS-DA.(33) However, it has been clearly shown that those methods are not optimal for such data and optimized or new strategies should be applied.(34)
To sum up, metabolomics is an attractive methodology for clinical research as it is the most accurate reflection of the actual physiological and biochemical state of the organism. The dynamic and highly “individualized” nature of the metabolome is a strong indication that it could provide the means to make personalized medicine go all the way from an “elusive dream”(37), via “proof-of-principle”, to real application. The current thesis does not offer a recipe how to do it, but describes a number of essential components for the development of this new type of medicine, such as robust and reproducible analytical methods, pre-processing routines, various data analysis methods and also metabolomics applications to both animal and clinical experiments that use the longitudinal study design.
REFERENCES
1. Lindon,J.C., Holmes,E., Bollard,M.E., Stanley,E.G., and Nicholson,J.K. 2004. Metabonomics technologies and their applications in physiological monitoring, drug safety assessment and disease diagnosis. Biomarkers 9:1-31.
2. De Noo,M.E., Tollenaar,R.A., Deelder,A.M., and Bouwman,L.H. 2006. Current status and prospects of clinical proteomics studies on detection of colorectal cancer: hopes and fears. World J. Gastroenterol. 12:6594-6601.
3. Lippi,G., Guidi,G.C., Mattiuzzi,C., and Plebani,M. 2006. Preanalytical variability: the dark side of the moon in laboratory testing. Clin. Chem Lab Med. 44:358-365.
4. Holmes,E., Loo,R.L., Stamler,J., Bictash,M., Yap,I.K., Chan,Q., Ebbels,T., de,I.M., Brown,I.J., Veselkov,K.A. et al 2008. Human metabolic phenotype diversity and its association with diet and blood pressure. Nature 453:396-400.
5. Slupsky,C.M., Rankin,K.N., Wagner,J., Fu,H., Chang,D., Weljie,A.M., Saude,E.J., Lix,B., Adamko,D.J., Shah,S. et al 2007. Investigations of the effects of gender, diurnal variation, and age in human urinary metabolomic profiles. Anal Chem 79:6995-7004.
6. Lenz,E.M., Bright,J., Wilson,I.D., Hughes,A., Morrisson,J., Lindberg,H., and Lockton,A. 2004. Metabonomics, dietary influences and cultural
differences: a 1H NMR-based study of urine samples obtained from healthy British and Swedish subjects. J. Pharm. Biomed. Anal 36:841-849.
7. Holmes,E., Loo,R.L., Stamler,J., Bictash,M., Yap,I.K., Chan,Q., Ebbels,T., de,I.M., Brown,I.J., Veselkov,K.A. et al 2008. Human metabolic phenotype diversity and its association with diet and blood pressure. Nature 453:396-400.
8. Lenz,E.M., Bright,J., Wilson,I.D., Morgan,S.R., and Nash,A.F. 2003. A 1
H NMR-based metabonomic study of urine and plasma samples obtained from healthy human subjects. J. Pharm. Biomed. Anal 33:1103-1115.
9. Lindon,J.C., Nicholson,J.K., Holmes,E., Keun,H.C., Craig,A., Pearce,J.T., Bruce,S.J., Hardy,N., Sansone,S.A., Antti,H. et al 2005. Summary recommendations for standardization and reporting of metabolic analyses. Nat. Biotechnol. 23:833-838.
10. Lindon,J.C., and Nicholson,J.K. 2008. Analytical technologies for metabonomics and metabolomics, and multi-omic information recovery. Trac-Trends in Analytical Chemistry 27:194-204.
General Introduction
19
12. Crockford,D.J., Holmes,E., Lindon,J.C., Plumb,R.S., Zirah,S., Bruce,S.J., Rainville,P., Stumpf,C.L., and Nicholson,J.K. 2006. Statistical heterospectroscopy, an approach to the integrated analysis of NMR and UPLC-MS data sets: application in metabonomic toxicology studies. Anal Chem 78:363-371.
13. van der Greef,J., Martin,S., Juhasz,P., Adourian,A., Plasterer,T., Verheij,E.R., and McBurney,R.N. 2007. The art and practice of systems biology in medicine: mapping patterns of relationships. J. Proteome Res. 6:1540-1559.
14. Aberg,K.M., Alm,E., and Torgrip,R.J. 2009. The correspondence problem for metabonomics datasets. Anal Bioanal Chem.
15. Garcia-Perez,I., Vallejo,M., Garcia,A., Legido-Quigley,C., and Barbas,C. 2008. Metabolic fingerprinting with capillary electrophoresis. J. Chromatogr. A 1204:130-139.
16. De Meyer,T., Sinnaeve,D., Van,G.B., Tsiporkova,E., Rietzschel,E.R., De Buyzere,M.L., Gillebert,T.C., Bekaert,S., Martins,J.C., and Van,C.W. 2008. NMR-based characterization of metabolic alterations in hypertension using an adaptive, intelligent binning algorithm. Anal Chem 80:3783-3790.
17. Anderson,P.E., Reo,N.V., DelRaso,N.J., Doom,T.E., and Raymer,M.L. 2008. Gaussian binning: a new kernel-based method for processing NMR spectroscopic data for metabolomics. Metabolomics 4:261-272.
18. Katajamaa,M., and Oresic,M. 2007. Data processing for mass spectrometry-based metabolomics. J. Chromatogr. A 1158:318-328.
19. van Nederkassel,A.M., Daszykowski,M., Eilers,P.H., and Heyden,Y.V. 2006. A comparison of three algorithms for chromatograms alignment. J. Chromatogr. A 1118:199-210.
20. Lange,E., Tautenhahn,R., Neumann,S., and Gropl,C. 2008. Critical assessment of alignment procedures for LC-MS proteomics and
metabolomics measurements. BMC Bioinformatics 9:375.
21. Dieterle,F., Ross,A., Schlotterbeck,G., and Senn,H. 2006. Probabilistic quotient normalization as robust method to account for dilution of complex biological mixtures. Application in 1H NMR metabonomics. Anal Chem 78:4281-4290.
22. Craig,A., Cloarec,O., Holmes,E., Nicholson,J.K., and Lindon,J.C. 2006. Scaling and normalization effects in NMR spectroscopic metabonomic data sets. Anal Chem 78:2262-2267.
23. Gonzalez,A.G. 2007. Use and misuse of supervised pattern recognition methods for interpreting compositional data. Journal of Chromatography A 1158:215-225.
24. Woodcock,J. 2007. The prospects for "personalized medicine" in drug development and drug therapy. Clinical Pharmacology & Therapeutics 81:164-169.
25. Goldsmith,P., Fenton,H., Morris-Stiff,G., Ahmad,N., Fisher,J., and Prasad,K.R. 2010. Metabonomics: a useful tool for the future surgeon. J. Surg. Res. 160:122-132.
26. Nicholson,J.K., Wilson,I.D., and Lindon,J.C. 2010. Pharmacometabonomics as an effector for personalized medicine. Pharmacogenomics 12:103-111.
27. Garrod,A.E. 1902. THE INCIDENCE OF ALKAPTONURIA : A STUDY IN CHEMICAL INDIVIDUALITY. The Lancet 160:1616-1620.
28. Williams,R.J., Berry,L.J., and Beerstecher,E. 1949. Individual Metabolic Patterns, Alcoholism, Genetotrophic Diseases. Proceedings of the National Academy of Sciences of the United States of America 35:265-271.
30. Bernini,P., Bertini,I., Luchinat,C., Nepi,S., Saccenti,E., Schafer,H., Schutz,B., Spraul,M., and Tenori,L. 2009. Individual Human Phenotypes in Metabolic Space and Time. J. Proteome Res.
31. van der Greef,J., and Smilde,A. 2005. Symbiosis of chemometrics and metabolomics: past, present, and future. JOURNAL OF CHEMOMETRICS 19:376-386.
32. Glass,L., and Mackey,M.C. 1988. From clocks to chaos : the rhythms of life. Princeton University Press. Princeton, NJ.
33. Li,J.A., Wijffels,G., Yu,Y.H., Nielsen,L.K., Niemeyer,D.O., Fisher,A.D., Ferguson,D.M., and Schirra,H.J. 2011. Altered Fatty Acid Metabolism in Long Duration Road Transport: An NMR-based Metabonomics Study in Sheep. Journal of Proteome Research 10:1073-1087.
34. Smilde,A.K., Westerhuis,J.A., Hoefsloot,H.C.J., Bijlsma,S., Rubingh,C.M., Vis,D.J., Jellema,R.H., Pijl,H., Roelfsema,F., and van der Greef,J. 2010. Dynamic metabolomic data analysis: a tutorial review. Metabolomics 6:3-17.
35. Jansen,J.J., Hoefsloot,H.C.J., van der Greef,J., Timmerman,M.E., and Smilde,A.K. 2005. Multilevel component analysis of time-resolved metabolic fingerprinting data. Analytica Chimica Acta 530:173-183.
36. Westerhuis,J.A., van Velzen,E.J.J., Hoefsloot,H.C.J., and Smilde,A.K. 2010. Multivariate paired data analysis: multilevel PLSDA versus OPLSDA. Metabolomics 6:119-128.
Part I
Chapter
Gas chromatography/atmospheric pressure chemical
ionization-time of flight mass spectrometry:
analytical validation and applicability to metabolic
profiling
Carrasco-Pancorbo A., Nevedomskaya E., Arthen-Engeland T., Zey T., Zurek G., Baessmann C., Deelder A.M., MayborodaO.A.
ABSTRACT
Chapter 1
25
INTRODUCTION
There are different definitions of metabolomics. However, regardless of terminology and phrasing differences, any definition implies an enormous analytical challenges to cover a wide range of polarities, concentrations, and sizes of chemical entities composing the human metabolome. In response to this challenge, more and more efforts are directed toward cross-platform analysis and integration of data obtained on different analytical platforms. At the same time, a revision and modernization of proven technologies like, for example, gas chromatography (GC) is taking place. Since it was invented by Martin and James (1) in 1952, GC became one of the most important and widely applied techniques in modern analytical chemistry. Even before the term “metabolomics” was introduced, there were a number of published studies with GC as main analytical method, which could be described as metabolomics or metabolic profiling.(2) However, only with the introduction of fused-silica capillary columns at the end of 1980s, which significantly improved the separation quality of GC, and GC-MS instrumentation, GC turned into the one of the most effective techniques for large scale metabolic profiling.(3-8) GC-MS was the first analytical technique implemented in a real metabolic profiling workflow. It includes all steps from sample preparation to the compound identification and remains flexible because of a number of options in selection of mass analyzer and ionization techniques. There are several types of mass analyzers routinely used with GC systems, namely, ion trap (IT), single (Q) and triple-quadrupoles (QqQ), and time of flight (TOF). However, the characteristics of a TOF mass analyzer are most favorable for such application as metabolic profiling. Speed, sensitivity, resolving power, and multiplex detection are clear advantages over scanning instruments, such as quadrupoles. These performance factors make TOF mass analyzers almost ideal for metabolomics, especially in combination with GC.(9) Moreover, modern TOF analyzers provide a data quality sufficient for identification of metabolites using a combination of accurate mass, isotopic distribution, and retention time.(10;11)
technique and energy transfer usually does not exceed 5 eV. Consequently, fewer fragments are formed and information about the precursor ion is preserved. Moreover, since the fragmentation pattern depends on the properties of the reagent gas, different structural information can be obtained from different reagent gases. Atmospheric pressure ionization sources (API), which are probably the key of the “overnight success” of MS detectors in analytical sciences because of coupling with liquid chromatography, are rarely used with GC instruments. The first APCI source for GC-MS was described more than 30 years ago
by Horning et al.(13-16) Later, several papers were published in which the effluent from a
GC is ionized at atmospheric pressure with an interface coupling the GC to a 63Ni ion
source of a mass spectrometer built for APCI gas-phase studies.(17-19) Revelsky et al.(20)
and Schiewek et al.(21) have applied GC/APPI-MS for analyzing a wide variety of volatile
organic compounds, and ESI has been successfully applied for ionization of gaseous analytes separated by GC.(22;23) Even so, GC/API-MS has never become widely used, in part because of the high costs of the custom instrumentation needed for these analyses, in part because of availability of commercial “plug and play” EI and CI GC systems. Recently,
Schiewek et al. introduced a new multipurpose API source, which for the first time offers a
“user friendly” and robust solution for a GC/APCI technique.(24) In the current manuscript, we present a detailed analytical evaluation of GC/APCI in combination with a TOF mass spectrometer. In addition to the detailed examination of the analytical performance (repeatability, reproducibility, linearity, and detection limits), we demonstrate the applicability of this technique for metabolic profiling of cerebrospinal fluid (CSF).
MATERIALS AND METHODS
Chemicals. A standard solution of 17 amino acids at 1 mM each in 0.1 M HCl was purchased from Sigma-Aldrich. 4-Nitrobenzoic acid, dopamine hydrochloride, and Phe-Gly hydrate were obtained from Fluka. Sarcosine, theophylline, caffeine, nortriptyline
hydrochloride, hippuric acid, creatinine, 4-O-methyldopamine hydrochloride,
Chapter 1
27
Biological Samples. Human CSF samples were taken by lumbar puncture. The study was approved by the ethical committee at the Leiden University Medical Center. Samples were processed within 1 h, centrifuged at 300 × g to remove cells, aliquoted and stored at -80 °C until use.
Protein Precipitation and Metabolite Extraction. 250 μL sample aliquots were taken, 600 μL of cold extraction solvent (MeOH) were added, and the sample was shaken vigorously for 20 s. The samples were placed in an ice bath for 2 h, and then centrifuged at 20,800 rcf for 15 min. The liquid supernatant was collected and evaporated in a speed vacuum concentrator before derivatization.
Derivatization. A speed vacuum concentrator or lyophilizer was used for drying the standard mixture (100 μL at 100 μM) and the CSF extracts to complete dryness. A mixture of 20 mg/mL of methoxyamine·HCl in pyridine was freshly prepared using an ultrasonicator. The dried samples were taken from store and warmed up to room temperature before starting derivatization. Methoxyamine + pyridine mixture (100 μL) was added to each GC vial, closing it immediately, and the samples were agitated for 2 min. Methoxyamination was performed at 40 °C for 60 min. After the addition of the derivatization reagent containing 1% TMCS as the catalyst (100 μL) the solution was vortexed again for 2 min. Trimethylsilylation reaction was performed at 40 °C for 30 min. A minimum of 2 h equilibration time was necessary before sample injection.
GC-MS Analysis. The derivatized samples (1 μL) were applied by splitless injection with a programmable CTC PAL multipurposesampler (CTC Analytics AG, Zwingen, Switzerland) into an Agilent 7890A GC (Agilent, Palo Alto, U.S.A.) equipped with a HP-5-MS column (30 m, 0.25 mm ID, 0.25 μm film thickness). Injection programs included sequential washing steps of the 10 μL syringe before and after the injection, and a sample pumping step for removal of small air bubbles.
The injection temperature was set at 250 °C. Helium was used as carrier gas at a constant flow rate of 1 mL/min through the column. For every analysis splitless injection time was 60 s and after this the injector was purged at 20 mL/min flow rate. The column temperature was initially kept at 70 °C for 5 min and then raised at 5 °C/min over 42 min to 280 °C and held for 10 min.
As a detector an orthogonal-accelerated TOF mass spectrometer (oaTOF-MS) MicroTOF (Bruker Daltonik, Bremen, Germany) was used. The polarity of the APCI interface and all the parameters of TOF MS detector were optimized using the area of the MS signal for the metabolites included in the standard mixture and the chromatographic resolution as analytical parameters. The position of the column in the transfer line, the transfer line temperature, the flow rate and pressure of nebulizer gas (nitrogen), the vaporizer temperature, voltages in the corona, source and ion transfer settings: all those parameters were optimized empirically. These are essential for optimal performance of an instrument but may vary from instrument to instrument.
Data were acquired for mass range from 50 to 1000 m/z with a repetition rate of 1 Hz. DataAnalysis 4.0 software (Bruker Daltonik) was used for data processing. The SmartFormula tool within DataAnalysis was used for the calculation of elemental composition of compounds; it uses a CHNO algorithm, which provides standard functionalities such as minimum/maximum elemental range, electron configuration, and ring-plus double bonds equivalents, as well as a sophisticated comparison of the theoretical with the measured isotope pattern (Sigma-Value) for increased confidence in the suggested molecular formula.(11)
The instrument was calibrated externally using an APCI calibration tune mix. Because of the compensation of temperature drift in the mass spectrometer, this external calibration provided consistent mass values for a complete experimental sequence. Moreover, an additional internal calibration was performed using cyclic-siloxanes, a typical background in GC-MS.(25;26)
Linearity and Sensitivity. Linearity of the detector response (TOF-MS) was verified with standard solutions containing the 31 analytes under study at 5 different concentration levels over the range from the quantification limit to 100 μM. Each point of the calibration graph corresponded to the mean value from three independent replicate injections. Calibration curves were obtained for each standard by plotting the standard concentration as a function of the peak area obtained from GC/APCI-TOF MS analyses. The sensitivity of the analytical procedure was calculated by defining the limits of detection (LOD) and quantification (LOQ) for the individual analytes in standard solutions according to the IUPAC method.(27) The smallest concentration that could be detected with a reasonable certainty for our analytical procedure (LOD) was considered S/N = 3, while LOQ was S/N = 10.
Chapter 1
29
calculated with calibration curves obtained daily. The precision of the analytical procedure was expressed as the relative standard deviation (RSD). The intra- and interday repeatability in the peak areas was determined as the RSD obtained for six consecutive injections of each metabolite at an intermediate concentration value of the calibration curve, carried out within the same day and on three different days.
RESULTS AND DISCUSSION
Selection of Derivatization Conditions. BSTFA (+1% TMCS) and MSTFA (+1% TMCS) were used as derivatization reagents. They react with a range of polar compounds by replacing active hydrogen in alcohols, amines, carboxylic acids, and so forth. To find optimal derivatization conditions, we studied effects of derivatization time and temperature and the concentration ratio of the derivatization reagent to the concentration of pyridine/methoxyamine.
Regardless of the derivatization reagent, changing the reagent to pyridine/methoxyamine ratio from 0.8:1.2 until 1.2:0.8 did not affect peak areas of the test mixture significantly. Thus, the ratio 1:1 was chosen for further experiments. The effect of the derivatization time on peak areas was most significant in the interval between 10-30 min. Starting from 30 min incubation peak areas remained constant and further increase of derivatization time had little impact on data quality (Supplementary Materials, Figure S1). Thus, to reduce the error and shorten time, 30 min was selected as derivatization time. The influence of temperature on peak areas was minimal, at least in the evaluated interval between room temperature and 80 °C. However, at 40 °C we observed more compounds with just one TMS derivative. Thus, the final derivatization protocol consisted of a methoxyamination step (40 °C for 60 min) and subsequent trimethylsilylation (MSTFA + 1% TMCS, at 40 °C for 30 min).
The stability of derivatized samples is an important factor for large scale metabolomics temperature and performed analysis in equal time intervals between 0 and 72 h. Data proved to be rather consistent from 0 to 65 h. However, data collected on later time points demonstrated steadily increasing variability. Nevertheless, to avoid any possible risk of derivatization-dependent variability, material should preferably be processed within the first 48 h.
acids, organic acids, alcohols, xanthines, compounds with indole or imidazole groups, and one dipeptide.
Table 1. Compounds Included in the Standard Mixture
amino acids alanine
arginine
aspartic acid
cysteine
glutamic acid
glycine
histidine
isoleucine
leucine
lysine
methionine
phenylalanine
proline
serine
threonine
tyrosine
valine
sarcosine
organic acids benzoic acid
hippuric acid
4-nitrobenzoic acid
alcohols homovanillyl alcohol
xanthines and related coumpounds caffeine
theophylline
uric acid
compound with indoles group 5-hydroxyindole-3-acetic acid
amines nortriptyline hydrochloride
Compounds with hydroxyl and amine groups dopamine hydrochloride
4-O-Methyldopamine hydrochloride
compounds with imidazol groups creatinine
dipeptides Phe-Gly hydrate
Chapter 1
31
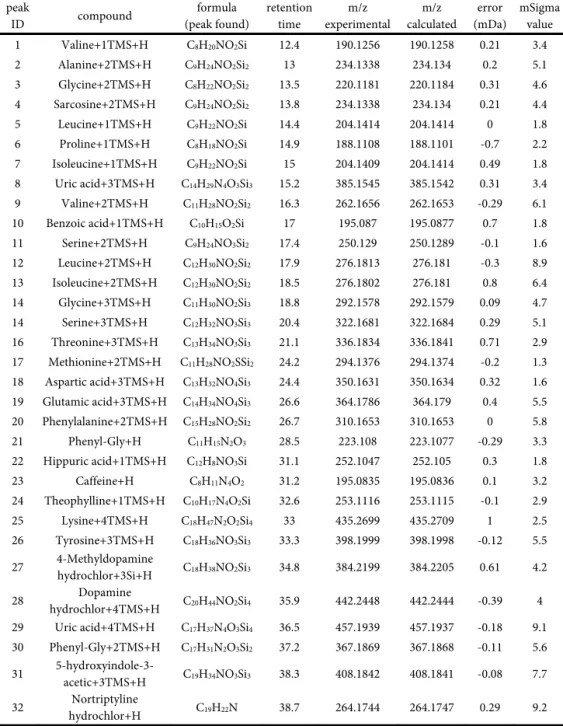
Figure 1. Extracted ion GC/APCI-TOF MS chromatograms of the 32 features corresponding to 25 compounds of the standard mix (100 μM). Numbering of compounds corresponds to Table 2.
With an analytical window of approximately 30 min, we observed 32 peaks, which could be assigned to 25 compounds. Table 2 shows all analytes detected, with their formula, retention time, measured and theoretical m/z, error (mDa) and sigma value. All values were calculated from samples with concentrations close to the LOQ; nevertheless the mass position error remained within 1.0 mDa and high quality sigma fit values (<10 mSigma) were obtained for all compounds.
Table 2. Forms of the Different Compounds Included in the Standard Mixture (at a Concentration Close to LOQ) Detected with GC/APCI-TOF MS Method.
peak
ID compound
formula (peak found)
retention time
m/z experimental
m/z calculated
error (mDa)
mSigma value
1 Valine+1TMS+H C8H20NO2Si 12.4 190.1256 190.1258 0.21 3.4
2 Alanine+2TMS+H C9H24NO2Si2 13 234.1338 234.134 0.2 5.1
3 Glycine+2TMS+H C8H22NO2Si2 13.5 220.1181 220.1184 0.31 4.6 4 Sarcosine+2TMS+H C9H24NO2Si2 13.8 234.1338 234.134 0.21 4.4
5 Leucine+1TMS+H C9H22NO2Si 14.4 204.1414 204.1414 0 1.8
6 Proline+1TMS+H C8H18NO2Si 14.9 188.1108 188.1101 -0.7 2.2
7 Isoleucine+1TMS+H C9H22NO2Si 15 204.1409 204.1414 0.49 1.8 8 Uric acid+3TMS+H C14H29N4O3Si3 15.2 385.1545 385.1542 0.31 3.4 9 Valine+2TMS+H C11H28NO2Si2 16.3 262.1656 262.1653 -0.29 6.1 10 Benzoic acid+1TMS+H C10H15O2Si 17 195.087 195.0877 0.7 1.8 11 Serine+2TMS+H C9H24NO3Si2 17.4 250.129 250.1289 -0.1 1.6 12 Leucine+2TMS+H C12H30NO2Si2 17.9 276.1813 276.181 -0.3 8.9 13 Isoleucine+2TMS+H C12H30NO2Si2 18.5 276.1802 276.181 0.8 6.4 14 Glycine+3TMS+H C11H30NO2Si3 18.8 292.1578 292.1579 0.09 4.7 14 Serine+3TMS+H C12H32NO3Si3 20.4 322.1681 322.1684 0.29 5.1 16 Threonine+3TMS+H C13H34NO3Si3 21.1 336.1834 336.1841 0.71 2.9 17 Methionine+2TMS+H C11H28NO2SSi2 24.2 294.1376 294.1374 -0.2 1.3 18 Aspartic acid+3TMS+H C13H32NO4Si3 24.4 350.1631 350.1634 0.32 1.6 19 Glutamic acid+3TMS+H C14H34NO4Si3 26.6 364.1786 364.179 0.4 5.5 20 Phenylalanine+2TMS+H C15H28NO2Si2 26.7 310.1653 310.1653 0 5.8 21 Phenyl-Gly+H C11H15N2O3 28.5 223.108 223.1077 -0.29 3.3 22 Hippuric acid+1TMS+H C12H8NO3Si 31.1 252.1047 252.105 0.3 1.8
23 Caffeine+H C8H11N4O2 31.2 195.0835 195.0836 0.1 3.2
24 Theophylline+1TMS+H C10H17N4O2Si 32.6 253.1116 253.1115 -0.1 2.9 25 Lysine+4TMS+H C18H47N2O2Si4 33 435.2699 435.2709 1 2.5 26 Tyrosine+3TMS+H C18H36NO3Si3 33.3 398.1999 398.1998 -0.12 5.5
27 4-Methyldopamine
hydrochlor+3Si+H C18H38NO2Si3 34.8 384.2199 384.2205 0.61 4.2
28 Dopamine
hydrochlor+4TMS+H C20H44NO2Si4 35.9 442.2448 442.2444 -0.39 4 29 Uric acid+4TMS+H C17H37N4O3Si4 36.5 457.1939 457.1937 -0.18 9.1 30 Phenyl-Gly+2TMS+H C17H31N2O3Si2 37.2 367.1869 367.1868 -0.11 5.6
31
5-hydroxyindole-3-acetic+3TMS+H C19H34NO3Si3 38.3 408.1842 408.1841 -0.08 7.7
32 Nortriptyline
hydrochlor+H C19H22N 38.7 264.1744 264.1747 0.29 9.2
Chapter 1
33
with trifluoroacetic anhydride,(32) although the last one has been mainly analyzed by HPLC. The same is true for 4-nitrobenzoic acid or homovanillyl alcohol. In general, we can conclude that those two compounds are analyzed more properly by HPLC.
At a first glance, the few compounds “missing” from our test mixture might be considered as serious drawback of the total workflow. However, metabolic profiling workflows always imply a compromise between analytical limitations of the methods and
their applicability. Even more, as Fiehn et al.(33) formulated in their validation criteria for
metabolite profiling protocols, comprehensiveness is more important than inclusion of a certain metabolite, and the overall dynamic range for the majority of the compounds is more important than the detection limit for one specific substance. Thus, we measured compounds belonging to nine different chemical families within one experiment (chromatogram). Moreover, the correct elementary composition of measured compounds was calculated from data acquired at levels close to the LOQ(11;34). Considering the chromatographic behavior, mass accuracy, and isotopic distribution, the described method could distinguish between isomers (i.e., Alanine/Sarcosine; Isoleucine/ Leucine).
Analytical Parameters. Calibration curves were obtained for each standard by plotting the standard concentration as a function of the peak area obtained from GC/APCI-TOF MS analyses. The parameters of the calibration functions, LOD, calibration range, correlation coefficient, precision, and accuracy are summarized in Table 3.
34
Table 3
. Analyt
ical Paramet
ers for t
h
e
GC/APCI-TOF
MS Met
h
od Described (Posit
ive Polarit y). Comp ou n d s LO D ( μ
M x 10
-3)
LO
Q
(
μ
M x 10
-3)
calib
rat
ion
range (μM)
calib
rat
ion curv
e
a r
2 co nsid er ed ion re pe at . intr a day b re pe at . inter day b re produ cibility c accu rac y d Valine+1TMS+H 28.5 95
y = 88131x
-77084 6 0.9311 190.1256 1.23 5.16 5.98 95.7 Alanine+2TMS+H 48.7 162.3
y = 51606x
-10073 31 0.9136 234.1338 1.51 4.1 6.39 96.4 Sarcosine+2TMS+ H 55.1 183.7
y = 45585x
+ 1523 067 0.921 234.138 1.9 3.76 7.01 98.3 Leucine+1TMS+H 24.7 82.3
y = 101739x
-1476 560 0.902 204.1414 0.95 5.37 7.55 102.1 Proline+1TMS+H 72.5 241.7
y = 34612x
+ 4571 2 0.9694 188.1108 0.73 5.05 6.5 101.6 Isoleucine+1TMS+H 25.3 84.3
y = 99186x
-
12325
51 0.9841 204.1409
1.87 6.37 8.78 99.5 Benzoic acid+1TM S+H 39.4 131.3
y = 63729x
+ 2013 38 0.9196 195.087 1.65 4.74 7.04 98.5 Glycine+3TMS+H 25.2 84
y = 99579x
+ 1491 920 0.9757 292.1578 1.23 6.01 6.57 99.2 Serine+3TMS+H 36.2 120.7
y = 69450x
- 71935 9 0.9814 322.1681 2.09 4.22 6.88 96.1 Threonine+3TMS+H 35 116.7
y = 71798x
- 17094 3 0.9233 336.1834 1.87 4.11 7.09 95.5 Methionin e+2TMS+H 45.4 151.3
y = 55355x
- 61979 4 0.9867 294.1376 1.11 5.01 6.44 98.1 Aspartic acid+3 T M S+H 38.2 127.3 y = 65717x + 2130 67 0.9338 350.1631 0.89 5.55 6.01 98.7 Glutamic acid+3T M S+H 48.1 160.3 y = 52232x - 76037 3 0.9391 364.1786 1.09 4.11 6.55 97.3
Phenylalanine+2TMS+H 32.6 108.7
y = 76927x - 48894 2 0.9057 310.1653 1.21 4.09 6.32 98.3 Phenyl-Gly+H 18.5 61.7
y = 135673x
+ 239 1638 0.9052 223.108 1.56 5.65 7.11 96.1 Hippuric acid+1T M S+H 16.6 55.3
y = 151185x
- 2387 767 0.962 252.1047 1.76 6.01 6.21 98.2 Caffeine+H 11.8 39.3
y = 212078x
- 1766 041 0.967 195.0835 1.44 5.98 6.09 98.1 Theophylline+1TMS+H 14.5 48.3
y = 172904x
- 4035 222 0.9309 253.1166 1.32 4.89 6.81 96.1 Lysine+4TMS+H 22.2 74
y = 112802x
-
8536
04 0.9372 435.2699
1.78 5.01 7.45 97.7 Tyrosine+3TMS+ H 19.1 63.7
y = 131596x
- 1252 913 0.9334 398.1999 1.66 5.22 8.9 96.3 4-Methyldopamine+3TMS+H 17.5 58.3 y = 143581x + 223 8266 0.9785 384.2199 1.56 5.76 7.91 95.9 Dopamine+4TMS+H 18.7 62.3
y = 134231x
+ 184 1824 0.976 442.2448 1.01 4.33 6.56 100.8 Uric acid+4 TMS+ H 23.8 79.3
y = 105543x
- 1922 989 0.9372 457.1939 0.91 4.52 8.32 99.7 5-Hydroxyindole-3-17 56.6
y = 147645x
+ 709 932 0.9339 408.1842 0.9 4.25 8.76 98.4 Nortriptyline+H 65.9 219.7 QL-100
y = 38120x
- 75816 9 0.9665 264.1744 1.81 5.11 6.04 96.4
a A (peak area)=
a
+ b ×
C (μM)
fo
r fi
ve points (n = 5).
b RSDs va
lues (%) f o r pea k a rea s c o rr espond ing to ea ch c o mpound ; measur ed f rom thr ee injec tions of ea ch a na lyte within the s ame day (intra -) a n
d on thre
e diffe re nt days (i nt er-).
c RSDs va
lues (%) fr
om two
co
nsec
utive injec
tions with t
w o d iff er ent tec h nic ia ns a n d
within two d
iff
er
ent d
ays
.
d The ac
cu ra cy of t h e a ssa
y is the c
loseness of
the test va
Chapter 1
35
Moreover, a proper comparison of APCI and EI/CI could only be done if data are obtained on the same mass analyzer type, with the same sample preparation and derivatization strategies. At the end, the output still will not be 100% conclusive. We see as more beneficial the strategy, which will explore complementarities of both methods, combining high quality MS data generated under APCI condition with highly reproducible fragmentation spectra of EI.
Finally, we calculated the two most important parameters for evaluation of the precision of the analytical procedure: repeatability and reproducibility. In terms of repeatability; calculated RSDs did not exceed 6.37%. Reproducibility was determined by calculation the RSDs values (%) from two consecutive injections with two different technicians and within two different days and it did not exceed 8.90%.
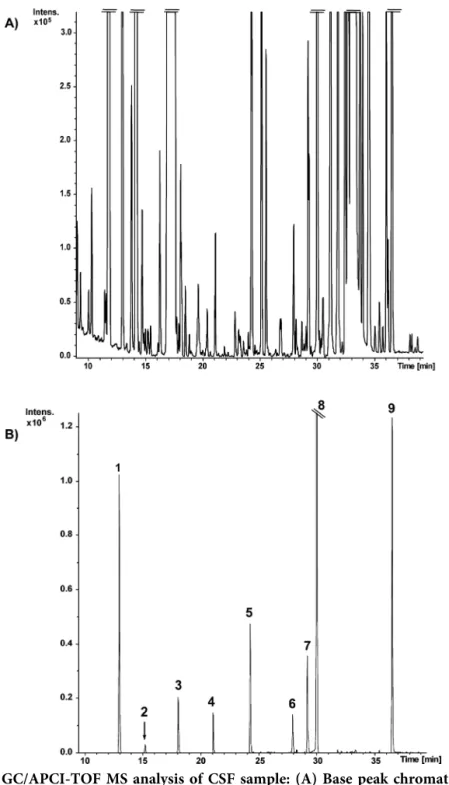
Applicability of GC/APCI-TOF MS for Metabolic Profiling in Biological Samples. A human CSF pool was extracted, dried, derivatized, and analyzed by GC/APCI-TOF MS as described above (see Materials and Methods). At first, we compared the chromatograms of the human CSF with those obtained for the standard mixture. Confirmation of compounds identity was accomplished by comparing retention time, mass position, and isotopic pattern of standards and sample.
Figure 2A shows the metabolic profile of human CSF as base peak chromatogram. The observed complexity and richness of the chromatogram demonstrates the potential of the method. In Figure 2B we show several EICs of metabolites, which were identified in the CSF. Several of them were assigned using only mass position and isotopic distribution. Supplementary Materials, Figure S2 shows an example of such assignment for N-acetyl-aspartate.
Chapter 1
37
Table 4. Compounds Included in the Standard Mixture Found in Human CSF Samples
compound formula
(peak found)
retention time
m/z experimental
m/z calculated
error (mDa)
mSigma value
Valine+1TMS+H C8H20NO2Si 12.4 190.1245 190.1258 1.29 5.2
Alanine+2TMS+H C9H24NO2Si2 13 234.133 234.134 1 4.5
Glycine+2TMS+H C8H22NO2Si2 13.1 220.1171 220.1184 1.3 5.1 Sarcosine+2TMS+H C9H24NO2Si2 13.8 234.1338 234.134 0.21 2.7
Leucine+1TMS+H C9H22NO2Si 14.4 204.1404 204.1414 1 4.1
Isoleucine+1TMS+H C9H22NO2Si 15 204.1422 204.1414 -0.79 2.7
Uricacid+3TMS+H C14H29N4O3Si3 15.2 385.153 385.1542 1.19 3.7
Valine+2TMS+H C11H28NO2Si2 16.3 262.1653 262.1653 0 5.3
Benzoicacid+1TMS+H C10H15O2Si 17 195.0869 195.0877 0.8 8.4
Serine+2TMS+H C9H24NO3Si2 17.4 250.129 250.1289 -0.1 1.9 Leucine+2TMS+H C12H30NO2Si2 17.9 276.1815 276.181 -0.49 10.1 Isoleucine+2TMS+H C12H30NO2Si2 18.5 276.1823 276.181 -1.3 6.4
Glycine+3TMS+H C11H30NO2Si3 18.8 292.1574 292.1579 0.5 9.3 Serine+3TMS+H C12H32NO3Si3 20.4 322.1689 322.1684 -0.52 5.2 Threonine+3TMS+H C13H34NO3Si3 21.1 336.1861 336.1841 -1.98 5.6 Methionine+2TMS+H C11H28NO2SSi2 24.2 294.138 294.1374 -0.59 7.4 Asparticacid+3TMS+H C13H32NO4Si3 24.4 350.1631 350.1634 0.32 1.6 Phenylalanine+2TMS+H C15H28NO2Si2 26.7 310.1663 310.1653 -0.99 6.9
Phenyl-Gly+H C11H15N2O3 28.5 223.1082 223.1077 -0.49 3.3
Hippuricacid+1TMS+H C12H8NO3Si 31.1 252.1047 252.105 0.3 1.8
Caffeine+H C8H11N4O2 31.2 195.0835 195.0836 0.1 3.5
Theophylline+1TMS+H C10H17N4O2Si 32.6 253.1116 253.1115 -0.1 2.9 Lysine+4TMS+H C18H47N2O2Si4 33 435.2697 435.2709 1.22 2.5 Tyrosine+3TMS+H C18H36NO3Si3 33.3 398.1999 398.1998 0.12 5.5 Uricacid+4TMS+H C17H37N4O3Si4 36.5 457.1949 457.1937 -1.19 9.1
5-hydroxyindole-3-acetic+3TMS+H C19H34NO3Si3 38.3 408.1834 408.1841 0.69 7.7
Nortriptyline+H C19H22N 38.7 264.1734 264.1747 1.29 9.2
discriminate between assignments validated by data from the standard mixture and those which were made solely based on sigma value calculation. If in the first case the reference to standard makes an assignment almost 100% correct, the second one is the best guess possible on the basis of available data. In Figure 3 we have shown MS spectra produced by GC/APCI-TOF MS for some compounds found in human CSF. Included compounds belong to different chemical families: amino acids, xanthines, organic acids, indoles and amines.
Valine was detected as valine+1TMS+H (m/z 190.1245), according to the reaction
described above [M+H]+ (in the current case [M+1TMS+H]+), observing mainly the
mentioned m/z signal and not its fragments. In the case of glycine and aspartic acid, the main peak in the spectrum was the amino acid+3TMS+H. Because of in source-fragmentation, some fragments were also observed. A neutral loss of 72.0387 appears after losing one of the trimethylsilane (TMS) groups, more precisely OH replacement with
-OSi(CH3)3, (=[C3H8Si]), trimethylsiloxane. The loss of two TMS groups should lead to
[M-2TMS+H]+, resulting in a loss of 144.0785. Moreover, for glycine we detected a fragment
produced for the loss of 82.0495, and for aspartic acid, another one after losing 118.1170.
The last one could be the result of losing one TMS group and three CH3 groups. One of the
xanthines, theophylline, showed in its spectrum [M+1TMS+H]+ and also [M-1TMS+H]+
with low intensity in comparison with [M+1TMS+H]+. [5-Hydroxyindole- 3-acetic
acid+3TMS+H]+ was the peak we found in CSF for the compound containing an indole
moiety. Again 72.0389 for the loss of one TMS group, 144.0801 for the loss of 2TMS, and 118.1171 for the loss of one TMS group and three CH3 groups were observed. The amine
nortriptyline hydrochloride showed up as [M+H]+ without undergoing any fragmentation.
Chapter 1
39
Figure 3. Typical APCI MS spectra of silylated compounds from different chemical families: amino acids (a−c), dipeptide (d), organic acid (e), xanthine (f), indole (g), and amine (h).
CONCLUSIONS
mass spectral libraries can then be used to identify the separated compounds or at least give structural clues to support the identification process. Here, we present an alternative to the classical GC-MS methods, namely, gas phase APCI as interface in combination with orthogonal TOF-MS. A very sensitive and accurate GC/APCI-TOF MS method was developed for the automated analysis of metabolites in biological samples. At present, the analytical evaluation of the method was made by using amino acids, organic acids, alcohols, xanthines, indoles, dipeptides, compounds with imidazole groups, amines, and analytes with hydroxyl and amine groups, demonstrating that 25 analytes of the 31 present in our mixture can be reliably determined. Excellent repeatability was obtained, with relative standard deviations (RSDs) of peak areas between 0.7% and 2.1% in the intraday study, and between 3.8% and 6.4% in the interday study.
Analysis of CSF has demonstrated a rich chromatographic pattern consisting of hundreds of features. The high quality of the spectra creates an opportunity to make structural assignments of metabolites based on mass position and isotopic distribution. However, the use of more advanced mass analyzers such as hybrid quadrupole TOF will be beneficial to resolve more difficult cases and support identification by fragmentation data. In summary, GC/APCI-TOF MS is an analytical procedure, which combines the best of chromatography with one of the most robust MS interfaces, and as such, it has a potential to become one of the standard methods in metabolic profiling.
REFERENCES
1. James,A.T., and Martin,A.J. 1952. Gas-liquid partition chromatography: the separation and micro-estimation of ammonia and the methylamines. Biochem. J. 52:238-242.
2. Pauling,L., Robinson,A.B., Teranishi,R., and Cary,P. 1971. Quantitative analysis of urine vapor and breath by gas-liquid partition chromatography. Proc. Natl. Acad. Sci. U. S. A 68:2374-2376.
3. Niwa,T., Asada,H., Maeda,K., Yamada,K., Ohki,T., and Saito,A. 1986. Profiling of organic acids and polyols in nerves of uraemic and non-uraemic patients. J. Chromatogr. 377:15-22.
4. Jiye A, Trygg,J., Gullberg,J., Johansson,A.I., Jonsson,P., Antti,H., Marklund,S.L., and Moritz,T. 2005. Extraction and GC/MS analysis of the human
blood plasma metabolome. Anal Chem 77:8086-8094.
5. Koek,M.M., Muilwijk,B., van der Werf,M.J., and Hankemeier,T. 2006. Microbial metabolomics with gas chromatography/mass spectrometry. Anal Chem 78:1272-1281.
6. Kind,T., Tolstikov,V., Fiehn,O., and Weiss,R.H. 2007. A comprehensive urinary metabolomic approach for identifying kidney cancerr. Anal Biochem. 363:185-195.
Chapter 1
41
8. Fiehn,O. 2008. Extending the breadth of metabolite profiling by gas chromatography coupled to mass spectrometry. Trends Analyt. Chem 27:261-269.
9. Begley,P., Francis-McIntyre,S., Dunn,W.B., Broadhurst,D.I., Halsall,A., Tseng,A., Knowles,J., Goodacre,R., and Kell,D.B. 2009. Development and Performance of a Gas Chromatography-Time-of-Flight Mass Spectrometry Analysis for Large-Scale Nontargeted Metabolomic Studies of Human Serum. Anal Chem.
10. van Deurse,M.M., Beens,J., Janssen,H.G., Leclercq,P.A., and Cramers,C.A. 2000. Evaluation of time-of-flight mass spectrometric detection for fast gas chromatography. J. Chromatogr. A 878:205-213.
11. Ojanpera,S., Pelander,A., Pelzing,M., Krebs,I., Vuori,E., and Ojanpera,I. 2006. Isotopic pattern and accurate mass determination in urine drug screening by liquid chromatography/time-of-flight mass spectrometry. Rapid Commun. Mass Spectrom. 20:1161-1167.
12. Sparkman,O.D., Penton,Z., and Kitson,F.G. 2011. Gas Chromatography and Mass Spectrometry: A Practical Guide. Elsevier Science & Technology.
13. Horning,E.C., Horning,M.G., Carroll,D.I., Dzidic,I., and STILLWEL.RN 1973. New Picogram Detection System Based on A Mass-Spectrometer with An External Ionization Source at Atmospheric-Pressure. Analytical Chemistry 45:936-943.
14. Horning,E.C., Carroll,D.I., Dzidic,I., Haegele,K.D., Lin,S.N., Oertli,C.U., and Stillwell,R.N. 1977. Development and Use of Analytical Systems Based on Mass-Spectrometry. Clinical Chemistry 23:13-21.
15. McEwen,C.N., and McKay,R.G. 2005. A combination atmospheric pressure LC/MS:GC/MS ion source: advantages of dual AP-LC/MS:GC/MS instrumentation. J. Am. Soc. Mass Spectrom. 16:1730-1738.
16. McEwen,C.N. 2007. GC/MS on an LC/MS instrument using atmospheric pressure
photoionization. International Journal of Mass Spectrometry 259:57-64.
17. Mitchum,R.K., Korfmacher,W.A., Moler,G.F., and Stalling,D.L. 1982. Capillary Gas-Chromatography Atmospheric-Pressure Negative Chemical Ionization Mass-Spectrometry of the 22 Isomeric Tetrachlorodibenzo-P-Dioxins. Analytical Chemistry 54:719-722.
18. Korfmacher,W.A., Rushing,L.G., Engelbach,R.J., Freeman,J.P., Djuric,Z., Fifer,E.K., and Beland,F.A. 1987. Analysis of 3 Aminonitropyrene Isomers Via Fused-Silica Gas-Chromatography Combined with Negative-Ion Atmospheric-Pressure Ionization Mass-Spectrometry. Journal of High Resolution Chromatography & Chromatography Communications 10:43-45.
19. Kinouchi,T., Miranda,A.T.L., Rushing,L.G., Beland,F.A., and Korfmacher,W.A. 1990. Detection of 2-Aminofluorene at Femtogram Levels Via High-Resolution Gas-Chromatography Combined with Negative-Ion Atmospheric-Pressure Ionization Mass-Spectrometry. Hrc-Journal of High Resolution Chromatography 13:281-284.
20. Revelsky,I.A., Yashin,Y.S., Sobolevsky,T.G., Revelsky,A.I., Miller,B., and Oriedo,V. 2003. Electron ionization and atmospheric pressure photochemical ionization in gas chromatography-mass spectrometry analysis of amino acids. Eur. J. Mass Spectrom. (Chichester, Eng) 9:497-507.
21. Schiewek,R., Schellentrager,M., Monnikes,R., Lorenz,M., Giese,R., Brockmann,K.J., Gab,S., Benter,T., and Schmitz,O.J. 2007. Ultrasensitive determination of polycyclic aromatic compounds with atmospheric-pressure laser ionization as an interface for GC/MS. Anal Chem 79:4135-4140.
22. Wu,C., Siems,W.F., and Hill,H.H., Jr. 2000. Secondary electrospray ionization ion mobility spectrometry/mass spectrometry of illicit drugs. Anal Chem 72:396-403.
chromatography to electrospray ionization mass spectrometry. Anal Chem 80:8334-8339.
24. Schiewek,R., Lorenz,M., Giese,R., Brockmann,K., Benter,T., Gab,S., and Schmitz,O.J. 2008. Development of a multipurpose ion source for LC-MS and GC-API MS. Anal Bioanal Chem 392:87-96.
25. Tong,H., Bell,D., Tabei,K., and Siegel,M.M. 1999. Automated data massaging, interpretation, and E-mailing modules for high throughput open access mass spectrometry. Journal of the American Society for Mass Spectrometry 10:1174-1187.
26. Keller,B.O., Sui,J., Young,A.B., and Whittal,R.M. 2008. Interferences and contaminants encountered in modern mass spectrometry. Anal Chim. Acta 627:71-81.
27. Currie,L.A. 1995. Nomenclature in Evaluation of Analytical Methods Including Detection and Quantification Capabilities (Iupac Recommendations 1995). Pure and Applied Chemistry 67:1699-1723.
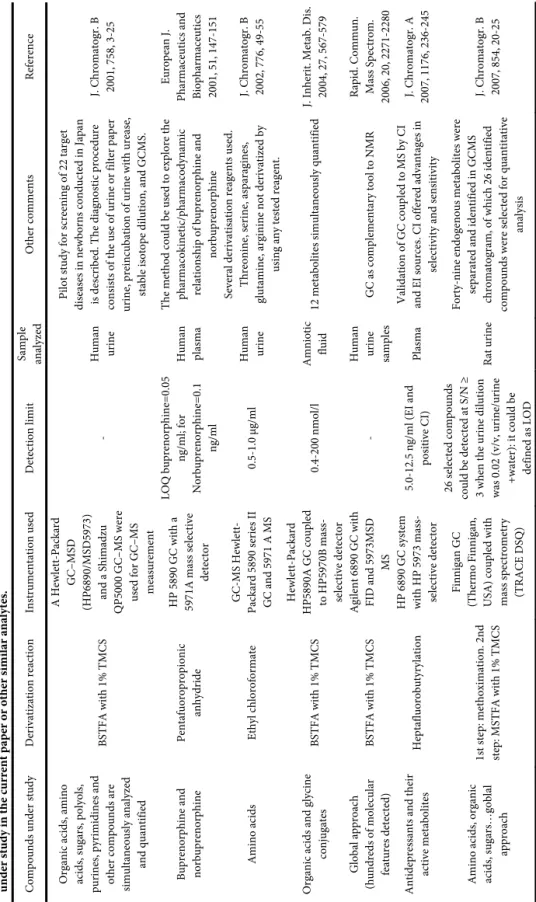
28. Kaspar,H., Dettmer,K., Gronwald,W., and Oefner,P.J. 2008. Automated GC-MS analysis of free amino acids in biological fluids. J. Chromatogr. B Analyt. Technol. Biomed. Life Sci. 870:222-232.
29. Namera,A., Yashiki,M., Nishida,M., and Kojima,T. 2002. Direct extract derivatization for determination of amino acids in human urine by gas chromatography and mass spectrometry. J. Chromatogr. B Analyt. Technol. Biomed. Life Sci. 776:49-55.
30. Halket,J.M., Waterman,D., Przyborowska,A.M., Patel,R.K., Fraser,P.D., and Bramley,P.M. 2005. Chemical derivatization and mass spectral libraries in metabolic profiling by GC/MS and LC/MS/MS. J. Exp. Bot. 56:219-243.
31. Welch,M.J., Cohen,A., Hertz,H.S., Ng,K.J., Schaffer,R., Van der,L.P., and White,E. 1986.
Determination of serum creatinine by isotope dilution mass spectrometry as a candidate definitive method. Anal Chem 58:1681-1685.
32. MacNeil,L., Hill,L., MacDonald,D., Keefe,L., Cormier,J.F., Burke,D.G., and Smith-Palmer,T. 2005. Analysis of creatine, creatinine, creatine-d3 and creatinine-d3 in urine, plasma, and red blood cells by HPLC and GC-MS to follow the fate of ingested creatine-d3. J. Chromatogr. B Analyt. Technol. Biomed. Life Sci. 827:210-215.
33. Fiehn,O., and Kind,T. 2007. Metabolite profiling in blood plasma. Methods Mol. Biol. 358:3-17.
34. Bristow,A.W., and Webb,K.S. 2003. Intercomparison study on accurate mass measurement of small molecules in mass spectrometry. J. Am. Soc. Mass Spectrom. 14:1086-1098.
35. Rodier,C., Sternberg,R., Raulin,F., and Vidal-Madjar,C. 2001. Chemical derivatization of amino acids for in situ analysis of Martian samples by gas chromatography. Journal of Chromatography A 915:199-207.
36. Mohabbat,T., and Drew,B. 2008. Simultaneous determination of 33 amino acids and dipeptides in spent cell culture media by gas chromatography-flame ionization detection following liquid and solid phase extraction. J. Chromatogr. B Analyt. Technol. Biomed. Life Sci. 862:86-92.
Chapter 1
43
SUPPLEMENTARY MATERIALS
Table S 1 . Som e relevant informa ti o
n about other G
C
-MS
methods pr
eviously publish
ed for the determi
n
atio
n in b
iologi cal samples of the same compou nds as those
under study in the current pape
r or other sim ilar anal ytes. Comp ounds unde r study Deri vati za ti on reacti o n Instrume ntati o n use d Detecti on li mi t Samp le analyzed Other comm ents R eference
Organic acids, amin
o acids, su gar s, poly o ls, p uri nes, p yri mi di nes and other comp ounds ar e si mul taneousl y anal yz ed and quantified
BSTFA with 1% TMCS
A Hewlett-Packard
GC–MSD
(HP6890/MSD5973
)
and a Shimadzu
QP5000 GC– M S we re used for GC–MS measurem ent -
Human uri
ne
Pi
lo
t study for scr
ee
ni
ng
of 22 targ
et di seases i n new b
orns conducted i
n
Jap
an
is descr
ibed. The di
agn o stic pr ocedu re consi
sts of the use o
f uri ne o r fi lter p ap er uri ne, p rei ncub ati o
n of u
ri n e w ith urea se, stable isot ope di lu ti on , an d G C MS .
J. Chromatogr. B 2001, 758, 3-25
Bu pr en or phin e an d norb up renorp hi ne Pentafuorop rop io nic anhydride
HP 5890 GC
with a
5971A mass selective
detector L O Q bu pr en or phine=0.05 ng /ml ; for Norb up renorp hi ne= 0. 1 ng /ml
Human plasma
The method could be used to
explore the pharmacokinetic/ pharmacodynami c re lation shi p of bu pr en or phin e an d norb up renorp hi ne Europ ean J.
Pharmaceutics and Bio
pharmaceutics
2001, 51, 147-151
Ami no aci ds Ethyl chl o roformate GC-MS
Hewlett-Packard 5890 series
II
GC and 5971
A MS
0.5-1
.0 μg/ml
Human uri
ne Several derivatisatio n reagents used. Threoni n e, seri ne, asparagines, glu tam in e, ar gin in e n ot der ivatized by
using any tested
rea
gent.
J. Chromatogr. B 2002, 776, 49-55
Organic acids and glycine
conjug
ates
BSTFA with 1% TMCS
Hewlett-Packard
HP5890A GC
coupled
to HP5970B mass- selective detector
0.4-200 nmol/l
Amni
oti
c
fluid
12 metabolites simulta
neously quantified
J. Inherit. Metab. Dis. 2004, 27, 567-579
Global a pproach (hundreds of mol ecul ar features det ected)
BSTFA with 1% TMCS
Agilent 6890 GC with FID and 5973MSD
MS
-
Human uri
ne
samples
GC as comp
lementa ry tool to NMR R api d. Commun. Mass Spectrom.
2006, 20, 2271-2280
Antidepressants and their
active metabolites Hep tafl u orob utyryl ati o n
HP 6890 GC
system
with HP 5973 mass- selective detector
5.0-12
.5 ng/ml (EI a
n d posit ive CI) Plasma Val id at io
n of GC coup
led to MS b
y
CI
and EI sources. CI o
ffered advantages in
selectivity an d sen sitivity J. Chromatog r. A
2007, 1176, 236-245
Ami no aci ds, org anic acids, sugars…gobla l appr oac h
1st step: m
ethoxim
ation
. 2n
d
step: MSTFA with 1% TMCS
Fi nni ga n GC (Thermo Fi nni ga n, USA) coup led w ith
mass spectrometry (TRACE DSQ)
26 selected compounds
could be detected at
S/N
≥
3 when the u
rine dilution w as 0. 02 (v/v, uri ne/ uri ne +water ): it cou ld be
defined as LOD
R at uri ne Forty-ni ne endog en o us metab o li tes w ere
separated and identified in GCMS
chr
om
atogr
am
, of which 26 iden
tified
comp
ounds w
ere sel
ected for qua
n
ti
tati
ve
analysis
Chapter 1
45
468.244
469.245
470.244
471.244
5. +MS , 27.8-28.0min #(1663-1671), -S pectral Bkgrnd
468.245
469.245
470.242
471.245
5. C 18 H 46 N O 5 S i 4 ,468.25
0.0 0.2 0.4 0.6 0.8 1.0 5 x10 Intens .
0.0 0.2 0.4 0.6 0.8 1.0 1.2 5 x10
467 468 469 470 471 472 473 474 475 m/z
recorded isotopic pattern
simulated isotopic pattern
Chapter
Alignment of capillary electrophoresis–mass
spectrometry datasets using accurate mass
information
Nevedomskaya E., Derks R., Deelder A.M., Mayboroda O.A., Palmblad M.
Analytical and Bioanalytical Chemistry 2009,
ABSTRACT
Chapter 2
49
INTRODUCTION
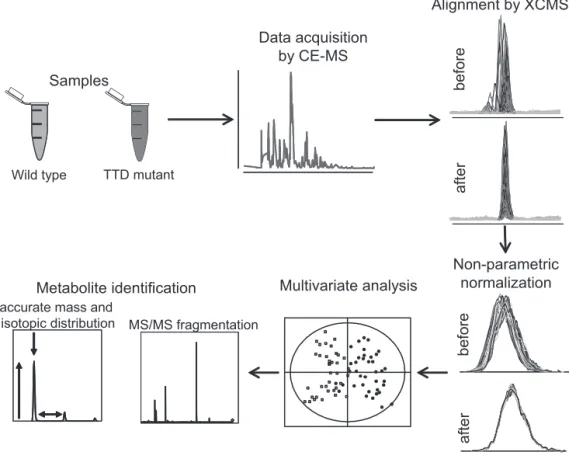
Capillary electrophoresis (CE) is an ideal technique for separation of small soluble polar compounds that are present in biological fluids.(1) There are also other advantages of CE for analysis of biological fluids, such as relatively short separation times with good resolution and low sample consumption.(2) CE is often criticized for its low loading capacity. However, pre-concentration techniques such as pH-mediated stacking (3) can overcome this drawback. If a mass spectrometer is used as a detector (CE–mass spectrometry (MS)), additional information on mass and isotopic distribution (4) is provided, which enables compounds and potential biomarkers to be identified. For comparison of multiple samples, elution or migration time precision is also very important. This is a serious concern for CE which, especially when bare-fused silica capillaries are used, lacks reproducibility of migration time.(5) Low reproducibility of migration time affects not only identification of compounds and their synchronization between samples but also statistical analysis. Misalignment introduces variation in the data that will noticeably affect results of multivariate statistics (6) and for studies involving numerous samples, as typically encountered in clinical research, manually assisted alignment of CE–MS datasets is not feasible.
The data produced by CE–MS is three-dimensional: intensity as a function of time and mass-to-charge ratio. There are two main strategies for alignment of this type of data: (1) to group features together in matrices that can be further statistically analyzed or (2) to transform all time axes to a common axis with further analysis of aligned signals. (7) The former works well for protein and peptide data, as some peaks can be identified and used as internal standards for quantification and correction, but is problematic in case of metabolomics.(8) In addition, for complex and overlapped electropherograms, peak assignment is less reliable.(9) For the second strategy, there are already many algorithms and software packages available. However, most of these programs have been developed for liquid chromatography- mass spectrometry (LC-MS) and cannot deal with the large and irregular time shifts typically encountered in CE–MS. Furthermore, a majority of these programs use only chromatographic information, aligning base peak or total ion chromatograms using different time warping procedures. As has been mentioned by
Daszykowski et al.(10), the next step in the development of alignment methods should take
advantage of mass as well as chromatographic information.