THE RISK OF COMMUNITY-DWELLING OLDER ADULTS BECOMING DISABLED: APPLICATION OF COX HAZARD MODEL WITH AGE AS TIME
UNIT
Yeong Hun Yeo
A dissertation submitted to the faculty of the University of North Carolina at Chapel Hill in partial fulfillment of the requirements for the degree of Doctor of Philosophy in the
School of Social Work.
Chapel Hill 2011
Approved by:
Kathleen A. Rounds, PhD
Peggye Dilworth-Anderson, PhD Dean F. Duncan III, PhD
iii
ABSTRACT
YEONG HUN YEO: The Risk of Community-Dwelling Older Adults Becoming Disabled: Application of Cox Hazard Model with Age as Time Unit
(Under the direction of Kathleen A. Rounds)
As the population of older adults increases, disability among older adults is becoming a critical issue for the disabled themselves and society as a whole. The traditional medical perspective views disability as a direct consequence of injury or disease, and disability among the elderly is regarded as an inevitable result of aging. However, the disablement process model (Verbrugge & Jette, 1994) posits that disability is not only the product of medical conditions, but rather the result of interactions between medical conditions and various intra- and extra-individual factors.
iv
describe disability onset by obtaining survivor/hazard plots. To examine the mediating roles of disease, health behaviors, and SES, a series of Cox hazard models with age as time unit were utilized.
SES was found to be the largest contributing factor in the black/white disability gap. On average, controlling for SES decreased the gap by 67.7%. When disease, health behaviors, and SES were all controlled for, the gap was narrowed even further.
v
ACKNOWLEDGEMENTS
This dissertation would not have been possible without the valuable contribution of my committee members. I feel so fortunate to have wonderful committee members for this dissertation. Most of all, my deepest gratitude is to my advisor and the chair of my dissertation committee, Dr. Kathleen Rounds. Whenever my steps faltered, Dr. Rounds encouraged me to make my steps forward by providing me excellent guidance. I also would like to express my deep appreciation to all my other committee members. Dr. Susan Parish’s insightful comments and constructive criticisms helped me enrich my research ideas and learn important issues in the area of disability. The data analysis of this dissertation research could not be completed without Dr. Shenyang Guo’s always guidance. Data management skills learned from Dr. Dean Duncan made me possible to utilize efficiently the complex longitudinal structure of the data set used for this
dissertation. Dr. Peggye Dilworth-Anderson’s expertise on aging helped me recognize crucial aspects of disability among the older adults population, which contributed the implication chapter of this dissertation.
vi
I am heartily thankful to Dr. Martha Ozawa. Since I started to work with her, Dr. Ozawa has been my mentor not only by instructing me social work values and the
importance of rigorous research but also by offering me warmth advice and various supports.
I would like to acknowledge Mrs. Mary Woytowich at the Center for Community Capital for her continuous support by providing me updated information related to the area of this dissertation, Ms. Jennie Vaughn for her great editorial help, and Dr. Margaret Morse for her kindness advice for me to arrive at this stage and our warmth friendship.
Finally, and most importantly, I would like to thank my wife, two lovely
vii
TABLE OF CONTENTS
LIST OF TABLES ... ix
LIST OF FIGURES ... x
Chapter I. INTRODUCTION ...1
II. DISABILITY AMONG OLDER ADULTS ...4
Definition of Disability ... 4
Significance of Disability among Older Adults ... 16
III. THE BLACK/WHITE DISABILITY GAP AMONG OLDER ADULTS ...23
Research Findings on the Black/White Disability Gap among Older Adults ... 24
Critique of Research Methods ... 30
Conceptual Framework of the Study ... 38
IV. RESEARCH METHODS ...42
Data ... 42
Sample ... 43
Censoring, Study Window, and Time Origin ... 45
Measures ... 47
Data Analysis ... 52
V. RESULTS ...60
viii
Univariate and Bivariate Results ... 61
Bivariate Relationship between Black/White and Disability ... 65
Mediation Analysis ... 70
Full Model ... 77
VI. DISCUSSION AND CONCLUSION ...86
Summary of Major Findings ... 87
Strengths and Limitations ... 93
Implications ... 97
Conclusion ... 108
APPENDICES ...110
ix
LIST OF TABLES
Table
1. Sample Characteristics by All, Black, and White Respondents
in the RAND HRS Wave 4 ... 62
2. Median Survival Ages of Each Disability Indicator ... 64
3. Disability Survival Ages and Incidence Rates by Black and White Respondents ... 66
4. Changes in the Black Hazard Ratios of ADL Disability Indicators ... 72
5. Changes in the Black Hazard Ratios of IADL Disability Indicators ... 75
6. Hazard Ratios of ADL Disability Indicators ... 78
x
LIST OF FIGURES
Figure
1. The Disablement Model and the Disablement Process Model. ... 15 2. The Conceptual Framework of the Study ... 39 3. Survival Curves for Black and White Respondents:
Survivor Function by Age ... 67 4. Smooth Hazard Curves for Black and White Respondents:
Hazard Function by Age ... 69 5. Model Predicted Survival Curves for Black and White Respondents:
Survivor Function by Age ... 83 6. Model Predicted Hazard Curves for Black and White Respondents:
CHAPTER 1
INTRODUCTION
The older population in the U.S. is projected to grow substantially in the coming years because of the aging baby boom generation and the increasing longevity of Americans. According to the most recent Census projections (U.S. Census Bureau, 2010), the number of persons age 65 and older is expected to increase from 40 million in 2010 to 72 million by the year 2030. Given that disability becomes increasingly common as people age, the number of older adults with a disability is also expected to grow to a large extent. Estimates show that 6 million adults age 65 years and older had a disability in 2010; that number will grow to 8.7 million by 2030 and 13.3 million by 2050 (Smith, Rayer, & Smith, 2008). As the number of older adults with a disability increases, disability among older adults is becoming a critical issue for society as well as for the older adults themselves and their relatives, and this issue is attracting considerable public attention.
Disability among older adults is an important concern because it is associated with various negative socioeconomic and health outcomes, such as lower financial resources, an increased need for affordable housing, greater barriers to social participation, lower life satisfaction, depression, higher mortality, greater family caregiver burdens, and higher spending for health care. Indeed, disability affects every aspect of life for older adults, their families, and society as well.
2
According to U.S. Census projections (U.S. Census Bureau, 2010), the proportion of white Americans age 50 and older is expected to decrease from 84% in 2010 to 75% by 2050, whereas the proportion of black Americans age 50 and older will increase from 10% to 13% during that same period. With this increase in the proportion of blacks in the older adult population, the disability gap between black and white adults in old age appears to be an important social phenomenon.
Research on the black/white disability gap among older adults in the U.S. has grown since Verbrugge and Jette (1994) developed the disablement process model that provided an important and thoughtful theoretical guideline for studying disability in old age. The two main trends of studies on the black/white disability gap among older adults in the U.S. have been 1) research focusing on the changes in the disability gap brought about by aging, and 2) research focusing on the source of the disability gap.
3
important factors (e.g., disease, health behaviors, housing and neighborhood conditions) in addition to SES that contribute to the black/white disability gap among the aging population. The relative contributions of SES, disease, and health behaviors to the black/white disability gap also differ in various studies. These inconsistent results mostly stem from differences in the data (longitudinal or cross-sectional), methods, definition and measurement of disability, and sample representativeness used by researchers. The conflicting results underscore the need for a more comprehensive investigation of the black/white disability gap utilizing a nationally representative sample drawing from a longer period of longitudinal data.
Importantly, the black/white gap for each indicator of Activities of Daily Living (ADL) and Instrumental Activities of Daily Living (IADL) disability is still unknown because most previous studies utilized ADLs and IADLs aggregately to measure disability. Further, studies that include adults approaching older age (e.g., ages 50 to 64) are limited because most earlier studies focused exclusively on the elderly (e.g., ages 65 and older) or the oldest old (e.g., ages 80 and older) to investigate the black/white disability gap.
4
CHAPTER 2
DISABILITY AMONG OLDER ADULTS
Interpretation of disability differs by scholar, and scholars’ differing perspectives on disability lead to fundamentally different ways of conceptualizing and defining it. These differences are important, because an examination of the causes and influencing factors of disability and/or the racial disability gap is significantly affected by the perspective adopted by the researcher. Thus this chapter begins by introducing three fundamentally different approaches to interpret disability: individual-focused, social-focused, and integrated models.
After reviewing disability perspectives in terms of their strengths, limitations, and applicability to this study, this chapter will discuss the prevalence of disability among older adults in the U.S. and its importance. The older population in the U.S. is growing
substantially as baby boomers age and their longevity increases. While the prevalence of disability among older Americans has declined slightly since the early 1980s (Freedman, 2006), the number of older persons with disabilities is expected to grow substantially (Congressional Budget Office [CBO], 1999; Waidmann & Liu, 2000). Disability among older adults is an important issue for the disabled themselves and for society as a whole because it is associated with negative socioeconomic and health outcomes.
Definition of Disability
The meaning of disability differs among scholars. Approaches to interpreting
5
consequence of a disease or illness. In contrast, the social perspective on disability regards disability as a consequence of physical, attitudinal, social, and environmental barriers
encountered by persons having physical or mental impairments. Some approaches to defining disability integrate the individual and the social perspectives. These integrated approaches stress both individuals’ functional abilities and environmental and social context to explain disability (Verbrugge & Jette, 1994).
The choice of perspective is important, because different perspectives on disability lead to fundamentally different ways of conceptualizing and defining disability. When disability is interpreted as an individual’s medical condition in favor of the individual perspective, the black/white disability gap is regarded as the result of the individual’s fixed characteristics such as disease and impairment. As such, the individual model does not account for any social, environmental, or behavioral factors that might be influencing
disability (Oliver, 1996). However, when disability is interpreted using the social perspective, disability is regarded as the result of prejudice, discrimination, and disadvantages imposed on the persons with chronic conditions and impairments (Depoy, 2002; Hahn, 1993; Oliver, 1996). This perspective largely ignores the influence of the individual’s physical or mental impairments to explain the black/white disability gap.
6
This section reviews the individual and social perspectives on disability, as well as the integrated approaches, in terms of their important assumptions, limitations, and
applicability to empirical studies that examine influencing factors on the black/white disability gap.
Individual-focused perspective. The individual perspective on disability, also called the medical model, is related to the personal tragedy theory, which explains disability as a tragic personal matter caused by the person’s deficit (Oliver, 1996). The individual perspective on disability is also called the old paradigm of disability (Dejong & O’Day, 1998) and the medical-diagnostic approach (Gilson & Depoy, 2002).
This individual perspective regards disability as a personal problem directly caused by disease, accident, or other chronic condition(s). In this view, disability is conceptualized as a direct outcome of pathology (Leclair, Leclair, & Brigham, 2009; Minaire, 1992). The important assumptions of this perspective are: 1) disability is defined primarily as a disease or deficit state and absolutely in medical terms; 2) persons with disabilities are viewed as biologically and psychologically inferior; and 3) medication and individual treatment are the primary focuses of intervention, and medical professionals play a key role in intervention (Barnes & Mercer, 2010; Barnes, Mercer, & Shakespeare, 1999; Shakespeare & Watson, 1997; Smith, 2009; Weiss & Lonnquist, 1997).
7
impairment), and disability (inability to perform physical and social roles required in daily living) (Nagi, 1991). The pathway from pathology to disability is referred to as
“disablement.” This model introduced social context as important to the concept of disability. Disability is regarded as a distinctly different stage from functional limitation or impairment. In this model, functional limitation is a functional incapacity itself; however, disability is a functional incapacity that keeps an individual from performing a socially defined role (Freedman, Martin, & Schoeni, 2004).
Independent from the development of the Nagi model, the World Health Organization (WHO) developed the International Classification of Impairments, Disabilities, and
Handicaps (ICIDH) model in late 1970s to “provide a classification scheme . . . with the intent to facilitate study of the consequences of disease” (WHO, 1980, p. 35). Like the Nagi model, the ICIDH model distinguished disability from disease or impairment by introducing the following four distinct concepts: disease, impairment, disability, and handicap. The ICIDH model defines disability as “any restriction or lack of ability to perform an activity in the manner or within the range considered normal for a human being” (WHO, 1980, p.143).
Although both the Nagi and ICIDH models expand the traditional individual
8
responsible for accommodating persons with disabilities (Abberley, 1987; Oliver, 1996). Third, the individual perspective privileges medical professionals in intervention strategies by ignoring the roles of persons with disabilities themselves (Abberley, 1987; Taylor, 2005). Finally, the individual perspective does not make any efforts to address the social, economic, and environmental factors that influence the lives of the persons with disabilities (Begum, 1992).
Despite its limitations, the individual perspective still plays a dominant role in disability policy as well as in clinical settings (Taylor, 2005). Because disability has long been regarded as a medical issue rather than a social issue, medical professionals have played a key role in this area. Both the Nagi and ICIDH models, as expansions of the individual perspective, also have been advanced as important frameworks for rehabilitation practice (Barnes et al., 1999; Lutz & Bowers, 2007). However, the individual perspective has major limitations in the examination of the black/white disability gap. This perspective recognizes disability in older adults exclusively as an unavoidable result of detriments of individual medical conditions. Therefore, the source of the black/white disability gap is understood as racial differences in pathology and impairment caused mainly by inherent biological and genetic detriments. This viewpoint has been challenged by most studies on the racial disability gap. Previous studies (e.g., Dunlop, Song, Manheim, Daviglus, & Chang, 2007), consistently reported that while individual medical conditions explain some portions of the racial disability gap, these were not the main causes of the gap.
9
disability (Dejong & O’Day, 1998) or the constructionist approach (Gilson & Depoy, 2002). The social perspective has its roots in the tradition of the civil rights movement, social justice, consumerism, and the disability rights movement (DeJong, 1979; Malhotra, 2001). British scholar and activist Michael Oliver first introduced this binary categorization between the individual and the social perspectives of disability, echoing and elaborating upon the distinction between impairments and disability claimed by the Union of the Physically Impaired against Segregation in the United Kingdom (UPIAS) (Oliver, 1983). UPIAS insisted that “disability is something imposed on top of our impairments by the way which we are unnecessarily isolated and excluded from full participation in society” (UPIAS, 1976, p. 14).
This perspective is related to social oppression theory, which argues that the problems faced by persons with disabilities are not the result of physical impairment but rather the result of the existing social and political inequality in society (Abberley, 1987). The social perspective is also called the minority model of disability, because it views persons with disabilities as a minority group within a society controlled by persons without disabilities (Hahn, 1994).
10
persons with disabilities (Barnes & Mercer, 2009; Hahn, 1993); and 3) the problems of persons with disabilities should be addressed by the removal of attitudinal, physical, and institutional barriers toward people with disabilities, rather than through individual
adaptation to society by medical treatment (Abberley, 1987; Barnes, Mercer, & Shakespeare, 2009; DeJong, 1979; Oliver, 1996).
The major limitation of the social perspective is its neglect of the individual’s physical or mental impairments, as it sees societal structures as the sole cause of disability and focuses only on environmental barriers and social attitudes (Morris, 1998; Smith, 2009). Therefore, the social perspective provides only a limited and partial explanation of the relation between impairments, disability, and society (Terzi, 2004). Moreover, there are no standard or widespread instruments to measure disability using the social perspective because of difficulties in quantifying social prejudice, discrimination, and environmental barriers against persons with chronic conditions and impairments.
According to the social perspective, the black/white disability gap is explained solely by racial differences in confronting social and environmental barriers against persons with illness and impairments. An examination of the black/white disability gap using the social perspective is incomplete and limited because it does not include the influence of individual characteristics such as medical conditions and health behaviors.
11
These integrated approaches of disability are supported by theories of aging. First, the ecological model of aging by Lawton and Nahemow (1973) posits that health among the elderly is determined by the interplay among biological, behavioral, social environmental, and physical environmental factors. The ecological model also posits that satisfaction or personal well-being can be achieved when environmental demands and individual capacities are balanced (Putnam, 2002). Satariano (2005) points to the disablement process model by Verbrugge and Jette as an important example of the ecological model of aging.
Second, the life course theory of aging (Elder, 1999) emphasizes the importance of three key demographic factors—age, period, and cohort—to explain the onset of disease or disability in the lives of individuals. According to Guo (2010, p. 9), age refers to
physiological change related to the aging process. For example, impairments and frailty increase with advancing age. Period denotes the time at which an outcome occurred, and period effect refers to outcomes that are common to the entire population that lived during a particular time period. A cohort is a group that shares a common characteristic, and a cohort effect is the result of an event that affects only a particular group. In this view, differences in health outcomes or disabilities among older adults can be explained by age, cohort, and period effects together with cumulative risk factors and personal biological and behavioral factors (Halfon & Hochstein, 2002). In other words, each older adult experiences different a health or disability trajectory determined by interactions of biological characteristics, accumulation of risk factors, and environmental and historical contexts (Baker, Eriksson, Forsen, & Osmond, 2002; Young, 1998).
12
viewed negatively with the belief that decrements of physical and mental functioning in old age are normal (Ashauer, 2010). In gerontology, this negative view is mainly influenced by the biomedical model, which focuses on physical processes affecting illness through biological factors such as genetics while disregarding influences of psychological, socioeconomic, and environmental factors (Victor, 2005). This negative view, called the decline and loss paradigm (Minkler & Fadem, 2007), results in ageism that reflects a prejudice and discrimination in society against older adults. According to this viewpoint, aging is defined as a process toward gradual deterioration of physiological function with age (Partridge & Mangel, 1999). The increase in vulnerability of older adults is viewed as
inevitable, intrinsic, and irreversible (Comfort, 1964). Thus, aging itself is the most powerful determinant of illness and disability. In contrast to this negative view of aging, the successful aging paradigm (Rowe & Kahn, 1987, 1997) recognizes the important role of
extra-individual factors to explain disability among older persons. In the successful aging paradigm, the aging process is described with categories: “usual aging” (also called typical aging), focusing on extrinsic factors that exacerbate the effects of aging, and “successful aging” highlighting extrinsic factors that neutralize these effects (Minkler, 1990). This paradigm explains that health, illness, and disability associated with the aging process are the result of various extrinsic factors such as lifestyle, health behaviors, and psychosocial factors (Minkler & Fadem, 2007; Rowe & Kahn, 1987, 1997).
13
The ICF model is a modification of its earlier framework, the ICIDH model. The ICF model was originally developed to provide a standard framework for the description of health-related states and to be used as a diagnostic guide by clinicians (Stamm & Machold, 2007; WHO, 2002). The ICF model regards disability as a multi-dimensional concept comprised of the following three aspects: body functions and structures, activity limitations, and participation restrictions. Body functions and structures can be seen as similar to
impairments. Activity limitations imply difficulties in performing tasks or actions.
Participation restrictions are difficulties in involvement in life situations (WHO, 2001). The meaning of disability in this model includes all aspects of impairments, activity, and social participation. The model also introduces personal and environmental factors that can
influence body functions and structures, activity, and participation (WHO, 2001). Therefore, the ICF model is viewed as a holistic perspective of disability based on the biopsychosocial model (Stamm & Machold, 2007) and on the ecological model (Smart, 2007). Further, by positioning disability as part of the continuum of health status, the ICF model views disability as a universal human experience (WHO, 2008a).
14
including the ICF measure1 is quite limited in the United States. Fourth, in the ICF model, measures of disability are ambiguous because disability is regarded as a comprehensive condition having multi-dimensional aspects, including functional impairments, activity limitations, and participation restrictions.
The disablement process model by Verbrugge and Jette (1994) extensively revised the earlier disablement model by Nagi (1965). Figure 1 provides a comparison between the two models. Nagi’s disablement model has been criticized on two points. First, the Nagi model views disablement as a static or unidirectional process, rather than a dynamic process (Marge, 1988). Second, and more importantly, most experts now believe that disablement can be influenced by various personal, social, and environmental factors, and that the process of disablement can be accelerated or slowed by various individual and environmental
characteristics. However, the Nagi model stresses the individual’s chronic condition or impairments as the only cause of disability (Verbrugge & Jette, 1994).
In response to these criticisms, Verbrugge and Jette (1994) introduced the disablement process model by expanding Nagi’s disablement model to include comprehensive intervening factors in the main pathway of disablement (pathology to disability). Verbrugge and Jette categorize these intervening factors as risk factors, intra-individual factors, and extra-intra-individual factors. Risk factors are defined as predisposing characteristics that exist before the onset of disability, such as socio-demographic
background. Intra-individual factors represent characteristics or behaviors within a person that occur after the onset of a disabling condition; examples include lifestyle and behavior changes and psychological attributes. Extra-individual factors are factors outside the person,
1
15
such as medical and rehabilitation services, personal assistance, access to buildings, discrimination, prejudice, access to care, and access to public transportation. The main pathway of disablement is the same as that in Nagi’s disablement model: pathology, impairments, functional limitations, and disability (Verbrugge & Jette, 1994).
By combining the main disablement pathway (pathology impairments
functional limitations disability) with influencing factors (risk, intra-individual, extra-individual) in their model, Verbrugge and Jette’s disablement process model makes a clear distinction between 1) the effect of chronic and acute conditions on disability, through the disablement pathway, and 2) influencing factors that interplay between medical conditions and disability (Jette, Hamilton, Liang, & Whiteneck, 1997).
Figure 1
16
In the disablement process model, disability is regarded not as a personal
characteristic, but as a gap between personal capability and the sociocultural environment. In other words, disability refers to the expression of functional limitation within the social context. Disease or impairments do not necessarily lead to disability in this model, because influencing factors affect each person differently (Verbrugge & Jette, 1994). That is,
disability is defined as the inability to perform specific social roles in everyday life (such as bathing, dressing, using a phone) because of these functional limitations. The transition from pathology or impairment to disability depends on the interactions between the individual’s capacity, risk factors, intra- and extra-individual factors, and demands of their social and physical environments (Satariano, 2004; Verbrugge & Jette, 1994).
The disablement process model provides the most complete and clear definition of the intervening factors of disablement. The model also implies that disablement is differently experienced by each individual, with intervening factors (risk, intra-individual, and extra-individual) playing a key role to explain this difference. Therefore, the disablement process model is the most appropriate model for this study of influencing factors on the black/white disability gap among older adults. As Satariano (2004) emphasized, the model has been used as an important guide for researchers investigating disability among older persons.
Significance of Disability among Older Adults
Since disability is defined and measured in different ways, estimates of the prevalence of older adults with disabilities vary across studies. Manton, Gu, and Lamb (2006), who defined disability as any difficulties in ADLs or IADLs,2 estimated that 19% of
2
17
U.S. adults age 60 and older had a disability, as did 49.7% of adults age 80 and older,
according to data gathered by the National Long Term Care Survey (NLTCS) in 2004-2005. The U.S. Census Bureau has adopted a broader definition of disability, defining disabled persons as persons who have any difficulties in ADLs or IADLs, functional limitations, a mental or emotional condition, work limitations because of impairments, or who use assistive tools. Using this definition, the Census estimated that in 2005, the
prevalence of disability among the entire U.S. population was 18.7%; among adults ages 55 and older, it was much higher, 41.8%.3 The prevalence of disability among black adults age 55 and older was 51.0%, compared to 40.5% among white adults in that age group.
While the prevalence of disability among older Americans has declined slightly since the early 1980s (Freedman, 2006), the number of older persons with disabilities is expected to grow substantially in coming years (Congressional Budget Office [CBO], 1999;
Waidmann & Liu, 2000) because of the increase in the elderly population due to the the aging of the baby boom generation and the increasing longevity of Americans. For example, Smith and colleagues (2008) estimate that the number of adults ages 65 and older with a disability will grow from 6 million in 2010 to 8.7 million by the year 2030, and 13.3 million by 2050.4
The expected gradual increase in the number of older adults with a disability is an important issue for aging adults because disability affects every aspect of life for older adults
Health Interview Survey (NHIS). In many studies that estimate the prevalence of persons with disability, “persons with disabilities” is defined as persons with any difficulties in ADLs or IADLs.
3
The estimation is based on this author’s calculation using Tables D-1, D-2, and D-3 in the Census report Americans with Disabilities: 2005 (U.S. Census Bureau, 2008).
4
The estimates by Smith and colleagues (2008) are based on three mobility related ADLs, whether the
18
and their families. The negative relationship between disability among older adults and various individual and social outcomes has been well-established in numerous studies.
First, there is a strong relationship between disability and lower financial resources (i.e., higher poverty rates, lower income, and fewer assets) among older adults, and this relationship appears to be strengthening (Schoeni, Martin, Andreski, & Freedman, 2005). Studies have consistently reported that disability among older adults was highly associated with lower economic backgrounds, such as higher risk of being poor, lower income, and fewer assets (Costa-Font, 2008; Kaye, Kang, & LaPlante, 2004; Matthews, Smith, Hancock, Jagger, & Spiers, 2005; Ozawa & Yeo, 2007, 2008). For example, Ozawa and Yeo (2007) found the total net worth of elderly persons with a disability was only about half of the net worth of the elderly without a disability. In spite of more limited financial resources, the elderly with disabilities spend more money on medical care and medical aids than the elderly without disabilities (Trupin, Rice, & Max, 1995). Because of lower financial resources, higher medical spending, and a higher cost of living, elderly persons with a disability face severe financial pressure.
19
communities as long as possible (Reynolds & Silverstein, 2003; Smith et al., 2008). However, most housing units in the United States are not accessible to older adults with a disability. Although more than 30% of adults ages 65 or older had difficulty with walking or using stairs, less than 10% of housing units in the United States are accessible to individuals with mobility problems (Steinfeld, Levine, & Shea, 1998). Most housing units for the elderly with disabilities have not been modified with accessibility features (Smith et al., 2008). Older adults with a disability who do not live in adequately accessible housing are often forced to move into institutions such as nursing homes, which imposes high financial costs on both individuals and society (Smith et al., 2008).
Third, disability creates barriers to social participation, life satisfaction, and quality of life. A major aim of disability policies and programs in the U.S. is to encourage persons with a disability to contribute to society by maximizing their abilities (Freedman et al., 2004). This aim can be achieved when there are no barriers to social activities, productive activities, and social interaction. However, studies have consistently reported that older adults with a disability had significantly fewer social relationships and limited social participation
compared to older adults without a disability (Avlund, Lund, Holstein, & Due, 2004; Cerhan & Wallace, 1993; Kuo, Raji, Peek, & Goodwin, 2004; Mendes de Leon, Gold, Glass, Kaplan, & George, 2001). Further, older adults with a disability have lower levels of life satisfaction (Husani & Moore, 1990; Kemp & Krause, 1999). These lower levels of social participation and life satisfaction result in a poorer quality of life among older adults with a disability (Noreau et al., 2004).
20
Merrill, & Blazer, 1994; Bruce et al., 2002; Cole & Dendukuri, 2003; Ormel, Rijsdijk, Sullivan, van Sonderen, & Kempen, 2002; Penninx, Leveille, Ferrucci, van Eijk, & Guralnik, 1999). For example, Cole and Dendukuri (2003) conducted a meta-analysis based on 22 empirical studies published between 1967 and 2001, and they found that disability was one of the major risk factors for depression among older adults. Higher rates of depression among older adults with a disability are associated with lower participation in community activities and a lower quality of life (Kemp, 1999), and depression is also a critical risk factor in mortality (Schulz et al., 2000; Yaffe, Edwards, Covinsky, Lui, & Eng, 2003).
Fifth, disability among older adults influences health care spending, which places a large burden on the disabled themselves as well as their families and the government funding that supports health care services. Studies have reported that older adults with a disability spend more on health care than older adults without a disability. For example, Trupin and associates (1995) found that the cost of medical care for older adults with a disability was three times higher than for older adults without disabilities. More specifically, Chernew, Goldman, Pan, and Shang (2005) reported that the cost of medical care for the elderly without a disability was half as much as the amount spent on the elderly with a mild
21
expenditures (Bhattacharya et al., 2004; RAND, 2005) and Medicaid expenditures (Stearns, Norton, & Yang, 2007).
Sixth, family caregivers play a crucial role in supporting older adults with a disability. According to the Family Caregiving Alliance (2006), more than 80% of older adults with ADL disabilities live in the community thanks to informal assistance primarily from their families. The major reason for this heavy reliance on informal family care is the expense of long-term care and paid services (Johnson, 2007). Family caregivers provide various types of support, such as help with activities inside the home (i.e., bathing, eating, preparing meals, monitoring medications) and outside the home (i.e., transportation, shopping), contacting service agencies (i.e., physicians, local community aging centers), and emotional support (Schmieding, 2006). In the United States, the number of family caregivers for the frail elderly is estimated at 29 million (Arno, 2006). This crucial role of the family caregiver to support the frail elderly inevitably places various burdens on the caregiver.Studies have reported that caregivers encounter a variety of poor health outcomes such as headaches, exhaustion, sleep disorders, pain, depression, and anxiety (Beach et al., 2005; Braithwaite, 2000; Mittelman, 2002; Ory, Hoffman, Yee, Tennstedt, & Schulz, 1999; Polen & Green, 2001), and increased risk of mortality (Christakis & Allison, 2006). Also, caregivers lack time for themselves, social activities, and exercise (Moen, Erickson, & Dempster-McClain, 2000).
Financial pressure is another significant burden for family caregivers of frail older adults. Financial pressure includes both the direct costs of medical services, hiring helpers, and purchasing assistive equipment, and the indirect costs of lost income because of
22
home helper was about $20, resulting in an annual cost of about $14,000 for 60 hours of home help services per month (Metlife Mature Market Institute, 2006). Further, caring for frail older adults is significantly associated with reduced work hours, leading to part-time jobs or unemployment, and higher risk of being in poverty (Ettner, 1996; National Alliance for Caregiving and AARP, 2004; Rubin, 2002).
After investigating the prevalence of older adults with a disability, this section
23
CHAPTER 3
THE BLACK/WHITE DISABILITY GAP AMONG OLDER ADULTS
With the more rapid growth of the population of minority older adults compared to that of the white older adults, the overall older adult population in the U.S. has become more racially diverse. For example, the proportion of white Americans ages 50 and older is
expected to decrease from 84% in 2010 to 72% by 2050, whereas the proportion of black Americans will increase from 10% to 13% during that same period (U.S. Census Bureau, 2010). This increase in the proportion of older black adults raises the subject of health disparities (i.e., mortality, diseases, and impairments, as well as disability) between older white and black adults as a crucial topic among gerontologists, especially given that health-related problems (i.e., higher mortality rate, lower longevity, and higher prevalence of disability) are more prevalent among older black adults.
24
Research Findings on the Black/White Disability Gap among Older Adults
Among older adults in the U.S., the prevalence of disability is much higher among blacks than whites. According to the Census Bureau (2008), the prevalence of disability in 2005 among blacks ages 55 and older was 51.0% compared to 40.5% among whites in the same age group. One theory that is frequently cited to explain the higher proportion of disability among older black adults compared to older white adults is the cumulative disadvantage theory (Merton, 1968).
This theory explains how earlier success could increase the likelihood of future success without continuing efforts, and also emphasizes the importance of early advantage or disadvantage to different outcomes in later life such as health, income, and work status (Ferraro & Kelley-Moore, 2003). In the literature on racial health disparities, the cumulative disadvantage theory has been applied to underscore accumulated exposure to stressors across the life course among racial minorities (Taylor, 2008). Specifically for the black/white disability gap, the theory posits that older black persons are more likely to be disabled due to disadvantages associated with their minority status, such as discrimination and a lack of socioeconomic resources over the life course (Maddox & Clark, 1992).
The double jeopardy hypothesis (Dowd & Bengtson, 1978) also attracted the attention of gerontology researchers examining the racial health gap among older adults. The
hypothesis posits that greater health inequalities experienced by racial minorities worsen with advancing age (Ferraro & Farmer, 1996). According to this hypothesis, the black/white disability gap increases in older age because of the double disadvantage of age and minority status.
25
white older adults, this topic had not received much attention until the 1990s. Since the development of the Verbrugge and Jette (1994) disablement process model that provided a fundamental frame to investigate disability among older adults, research focusing on the black/white disability gap among older adults in the U.S. has grown to test the double
jeopardy hypothesis by asking whether the black/white disability gap widens or narrows with advancing age, and to identify the influencing factors of this gap.
With a few exceptions (Andresen & Brownson, 2000), most studies have reported that older black adults were more likely to be disabled than older white adults. While some studies found that this disability gap continued well into the oldest ages, suggesting a persistent disparity between whites and blacks (Clark, 1997; Hayward et al., 2000; Kelley-Moore & Ferraro, 2004; Mendes de Leon, Barnes, Bienias, Skarupski, & Evans, 2005), many others found that the racial disability gap among older adults diminished with advancing age. Further, some studies found that the disability gap converged among the oldest adults (Clark & Maddox, 1992; Clark et al., 1993; Gibson, 1991; Johnson, 2000; Mendes de Leon, Seeman, Baker, Richardson, & Tinetti, 1996; Mutchler & Burr, 1991). For example, Clark and
colleagues (1993) found that while blacks ages 70 to 84 were more likely to have ADL decline compared to whites in the same age range, blacks ages 85 and over were less likely to experience ADL decline than whites in that age range. Johnson (2000) also found the
black/white ADL disability gap converged at age 86.This convergence of the disability gap between black and white older adults is called the crossover phenomenon of disability 5 (Kelley-Moore & Ferraro, 2004).
5
26
Ozawa and Yeo (2008) offered several possible explanations for this phenomenon: 1) in the later stages of life, black survivors are physically and mentally stronger compared to white survivors (mortality selection or selective survival); 2) older black persons have a greater ability to cope with difficulties in old age because they had significant experiences with hardship earlier in their lives; 3) older black persons have stronger social networks than older white persons, which could help them deal with frail health conditions in old age; and 4) race or ethnicity is not necessarily directly related to developing a disability; rather,
individual strengths and status (e.g., SES, physical health and disease, health behaviors) were better predictors of developing a disability in later life. That is, the racial disability gap is mediated by other factors.
27
significant mediating role of SES in the relationship between race and disability among older adults (August & Sorkin, 2010; Fuller-Thompson, Naru-Jeter, Minkler, & Guralnik, 2009; Guralnik, Land, Blazer, Fillenbaum, & Branch, 1993; Kelley-Moore & Ferraro, 2004;
Kington & Smith, 1997; Song et al., 2007; Mendes de Leon et al., 2005; Schoeni et al., 2005; Taylor, 2008). These studies found that while a racial disparity existed, it was largely due to differences in SES between older black and older white adults.
However, findings regarding the extent to which SES contributes to the racial disability gap have varied. For example, Guralnik and colleagues (1993) and Dunlop and colleagues (2007) found that the black/white disability gap in older adults was eliminated after controlling for SES. Fuller-Thompson and colleagues (2009) also found the odds ratios for disability in older black men vs. older white men became no longer significant after controlling for income and education, which explained 90% of the black/white ADL disability gap. Kington and Smith (1997) reported that SES explained almost all the racial disability gap, but accounted for only moderate amounts of the gap between races in disease prevalence. Mendes de Leon and colleagues (2005) and Liang, Xu, Bennett, Ye, and
Quinones (2009) found that the black/white disability gap among older adults was still present even when controlling for SES, although SES substantially reduced this gap. Clark and colleagues (1993) also found that SES did not fully account for the racial disability gap. These findings suggest that there are other important factors in addition to SES that
contribute to the black/white disability gap among the aging population.
28
Reynolds, and Small (2007) found that health behaviors narrowed the black/white IADL disability gap but not the ADL gap. They also reported that none of the health behavior variables significantly affected ADL or IADL disability trajectories among black respondents after controlling for both SES and health status together. Dunlop and colleagues (2007) found the hazard ratio for developing an ADL disability among black adults ages 65 and older decreased from 1.57 to 1.28 after including health behavior variables when using Cox regression to explore the racial gap in ADL disability onset. A study by Bolen, Rhodes, Powell-Griner, Bland, and Holtzman (2000) found that poorer health behaviors and lifestyles (e.g., smoking, lower physical exercise, and heavy alcohol consumption) among the minority population led to a greater risk of morbidity and mortality, as well as disability. Examining black and white older adults separately, Clark (1996) found that increased “walking
frequency” decreased the risk of becoming disabled for both groups.
Chronic disease is another mediator that has been frequently investigated by researchers (Dunlop et al., 2007; Kelley-Moore & Ferraro, 2004; Moody-Ayers, Mehta, Lindquist, Sands, & Covinsky, 2005; Song et al., 2007; Taylor, 2008; Zsembik et al., 2000). According to the disablement models of Nagi (1965) and Verbrugge and Jette (1994),
29
their disablement process model, the racial disability gap stems not only from chronic conditions but also from various individual and social factors such as SES, health behaviors, built environment, and health care access, as well as prejudice and discrimination. Verbrugge and Jette further state that the difference in chronic health conditions among races is not a direct representation of biological differences but rather the result of interaction among various individual, social, and environmental characteristics.
30
disability gap, and that health behaviors and diseases are also contributing factors. However, the magnitude of the contribution of each of these factors (i.e., SES, health behaviors, and diseases) to the disability gap varied in each study.
Critique of Research Methods
As Kelley-Moore and Ferraro (2004) noted, the inconsistency in outcomes stems mostly from variations in the data and methods used by previous researchers. Previous studies have examined the black/white disability gap by focusing on disability prevalence, disability severity, disability onset, the risk of becoming disabled, and changes in disability severity.6 The nature of the data (i.e., cross-sectional or longitudinal) and disability measures (i.e., dichotomous or continuous) have varied across studies. This section summarizes and critiques the research methods used in previous studies according to study design, data and sample, measurement of disability, inclusion of covariates, and statistical methods.
Limitations of earlier approaches and directions for future studies are also discussed.
Study design. Many of the earlier studies relied heavily on cross-sectional data (e.g., Fuller-Thomson et al., 2009; Ozawa & Yeo, 2008). The major limitation of cross-sectional studies is that they cannot confirm directionality, and the direction of effects can be the opposite of what is assumed. This limitation is especially critical in examining how various factors influence disability; the black/white disability gap among older adults could be caused by factors that are behavioral, socio-economic, or environmental in nature. Although analyses based on cross-sectional data can reveal associations between disability and these related factors, they cannot confirm that these factors contributed to disability. For example, Jang, Haley, Mortimer, and Small (2003) found that social support was significantly and positively related to the presence of disability among the elderly based on cross-sectional
6
31
data. One cannot conclude from this study that a higher level of social support causes disability, as it is possible that the elderly with disabilities received a higher level of social support because of their needs. Another important limitation with using cross-sectional data is that it fails to incorporate the effects of selective mortality (Ferraro & Farmer, 1996; Kelley-Moore & Ferraro, 2004). In other words, cross-sectional data do not account for the higher mortality rates experienced by blacks. Accordingly, researchers’ reliance on cross-sectional data likely underestimates the size of the black/white disability gap because the sample they have drawn from is more likely to be healthier (Ferraro & Farmer, 1996; Kelley-Moore & Ferraro, 2004). It appears that studies using cross-sectional data are useful in estimating disability prevalence and severity. However, cross-sectional studies are highly limited because they do not determine causality and do not address the issue of selective mortality. Therefore, it is strongly recommended that when studying the black/white disability gap, researchers use longitudinal data to examine the risk of disability onset or changes in disability severity over time.
32
California Health Interview Surveys (CHIS) (August & Sorkin, 2010), or data from the Chicago Health and Aging Project (Mendes de Leon et al., 2005). Although data from regional samples often provide more in-depth information on health (e.g., physical tests such as grasp strength), they present a major drawback. The proportion of the population that is minorities varies by region and thus cannot be assumed to be representative of the entire U.S. population. Also, characteristics of an older adult regional sample are not identical to those of the U.S. older adult population as a whole. Therefore, the findings from regional data are limited in that they cannot be generalized to the entire U.S. older adult population. To correctly estimate the black/white disability gap in the United States, a nationally representative sample must be used.
Disability measurements. Disability measurements were not consistent among studies. Most studies reviewed for this dissertation research utilized ADLs to measure
disability (Dunlop et al., 2007; Fuller-Thompson et al., 2009; Kelley-Moore & Ferraro, 2004; Moody-Ayers et al., 2005; Song et al., 2007), and many studies further examined IADLs in addition to ADLs (Johnson, 2000; Liang et al., 2009; Ozawa & Yeo, 2008; Reynolds & Silverstein, 2003; Taylor, 2008; Zsembik et al., 2000). Unlike most researchers, Clark (1996) used Nagi’s functional limitation indicators to measure disability. However, functional limitation indicators are not an appropriate way to measure disability because the disablement process model clearly separates disability (e.g., difficulties with ADLs and IADLs) from functional limitation.
33
living. For example, even though using a telephone, shopping for groceries, and preparing a meal are considered IADLs, making a phone call can save one’s life, and shopping for food and cooking may prevent malnutrition, especially for older persons. Further, many national family caregiver support programs and state-funded programs have adopted IADLs (in addition to ADLs) to evaluate eligibility.7 Therefore, examination of the black/white disability gap using indicators of both ADL and IADL disability will provide a broader and more comprehensive view of disability, which is important for policy and practice contexts.
Some studies measured disability in a dichotomous way—for example, dividing the sample into persons with at least one ADL disability vs. persons with no ADL disability (August & Sorkin, 2010; Dunlop et al., 2007; Fuller-Thomson et al., 2009; Hayward et al., 2000; Kingston & Smith, 1997; Moody-Ayers et al., 2005; Ozawa & Yeo, 2008; Reynolds & Silverstein, 2003; Song et al., 2007). Others measured disability in a continuous manner, by using total ADL score as a continuous variable, for example (Johnson, 2000; Kelly-Moore & Ferraro, 2004; Liang et al., 2009; Mendes de Leon et al., 2005; Popa et al., 2007; Taylor, 2008; Zsembik et al., 2000). The selection of dichotomous vs. continuous measures of disability was based on the study’s research questions. Generally, if the study investigated prevalence, onset, or risk of disability, a dichotomous measure was adopted. Studies investigating severity or trajectory (change in severity over time) employed a continuous measure of disability.
Using a dichotomous measure can be advantageous in a longitudinal study because it highlights the stage when a participant becomes disabled. In contrast, a continuous measure
7
34
of disability should be applied when a study investigates the change in disability severity over time because a continuous measure accounts for all degrees of disability severity. The major drawback of the continuous approach, however, is that it assumes constant and linear change across different levels of severity.
Measurement of independent variables. To examine the black/white disability gap among older adults, researchers have included a variety of control variables or control factors. In general, these variables can be grouped into four categories: demographics (race, age, gender, marital/living status), disease, health behaviors, and socioeconomic status (SES). Although many studies included all four factors as covariates in their analyses, some studies used a very limited number of covariates. For example, Clark (1997) included age and gender as the only covariates to examine the black/white gap in disability prevalence between 1982 and 1989. Other studies included demographics and SES as covariates but ignored disease and health behaviors (Fuller-Thomson et al., 2009, Guralnki et al., 1993; Mendes de Leon et al., 2005, Ozawa & Yeo, 2008; Schoeni et al., 2005). Liang and colleagues (2009) included self-rated health and diseases as covariates but did not include any measures of SES and health behaviors
35
could be related more significantly to disability than diabetes. Using a severity scale cannot adjust for the relative importance of each type of chronic condition.
The most commonly used measures of health behaviors in the literature are body mass index (BMI) (Andresen & Brownson, 1999; Dunlop et al., 2007; Hayward et al., 2007; Johnson, 2000; Song et al., 2007; Zsembik et al., 2000), physical exercise or activity
(Andresen & Brownson, 1999; Clark, 1996; Dunlop et al., 2007; Hayward et al., 2007; Song et al., 2007; Zsembik et al., 2000), and smoking (Dunlop et al., 2007; Hayward et al., 2007; Moody-Ayers et al., 2005; Reynolds & Silverstein, 2003; Song et al., 2007; Taylor, 2008). Some studies also included alcohol use as a covariate (Dunlop et al., 2007; Popa et al., 2007; Song et al., 2007). Unlike disease and SES, health behavior variables have not been widely used in studies because of data limitations.
To measure SES, most studies included the respondent’s level of education and income. Some studies expanded the SES factor by including assets or net worth (Dunlop et al., 2007; Hayward et al., 2000; Johnson, 2000; Kelly-Moore & Ferraro, 2004; Ozawa & Yeo, 2008; Reynolds & Silverstein, 2003; Song et al., 2007), home ownership (Taylor, 2008), employment (Hayward et al., 2000; Kelly-Moore & Ferraro, 2004), earlier occupation prestige (Kelly-Moore & Ferraro, 2004; Mendes de Leon et al., 2005 ), and poverty index (Fuller-Thompson et al., 2009). Interestingly, Dunlop and colleagues (2007) included type of health insurance as an indicator of SES.
36
Silverstein, 2003; Kelly-Moore & Ferraro, 2004), social services use (Reynolds & Silverstein, 2003), religious service attendance (Kelly-Moore & Ferraro, 2004), home modification
(Reynolds & Silverstein, 2003; Zsembik et al., 2000), and health care utilization such as doctor visits (August & Sorkin , 2010; Taylor, 2008). As the disablement process model posits, home and neighborhood environment, social services use, and health care utilization significantly influence each of the four stages of disablement (i.e., pathology, impairments, functional limitations, and disability). However, most studies failed to include these
important variables because of data limitations, especially studies that used public data sets.
Statistical methods. Researchers have adopted several types of statistical tools to examine the black/white disability gap, with their selections depending upon their data collection methods and primary research questions (e.g., prevalence, onset, or severity of disability). When studies used cross-sectional data to investigate the black/white disability gap, logistic or probit models were typically used to analyze prevalence (August & Sorkin, 2010; Fuller-Thomson et al., 2009; Kingston & Smith, 1997; Moody-Ayers, et al., 2005; Ozawa & Yeo, 2008; Reynolds & Silverstein, 2003), while OLS regression was often used to analyze severity (Johnson, 2000; Zsembik et al., 2000). Researchers who utilized
37
onset but did not affect disability severity, whereas financial resources affected the trajectory of disability but not onset. Therefore, it is important to note that findings regarding the black/white disability gap and the factors that influence it may vary depending on the type of statistical analysis used.
The limitations, inconsistencies, and differing results of previous studies underscore the need for a more comprehensive investigation of the black/white disability gap utilizing longitudinal data from a nationally representative sample over an extended period of time.. Furthermore, although there have been an increasing number of studies focusing on the racial disability gap among older adults, most of these studies included only adults ages 65 and older or ages 70 and older. Studies that include adults approaching older age (i.e., ages 50 to 64) are scarce. An investigation of adults ages 50 and older will provide a more
comprehensive examination of the black/white disability gap. More importantly, most previous studies examined the black/white disability gap using aggregate measures of ADLs and IADLs. Among the research reviewed for this dissertation study, only one published study (Reynolds & Silverstein, 2003) investigated individual ADL disability indicators. No study has investigated individual IADL indicators. Therefore, the black/white disability gap for each ADL and IADL indicator is still unknown.
38
developing a disability. This dissertation study focuses on disability risk and uses 11 years of longitudinal data. This dissertation study also addresses the change in the racial disability gap as respondents aged. Ozawa and Yeo employed logistic regression because they used cross-sectional data. This dissertation study employs Cox regression to analyze longitudinal data. Ozawa and Yeo measured disability by using aggregated measures of ADLs and IADLs (i.e., one or more ADL disabilities vs. none, one or more IADL disabilites vs. none). This dissertation study investigates each ADL and IADL disability indicator individually. Ozawa and Yeo’s sample included adults ages 62 and older. The sample for this dissertation study includes non-disabled adults ages 50 and older. Finally, this dissertation study
includes a more comprehensive set of covariates (i.e., health behaviors and diseases in addition to SES) than Ozawa and Yeo’s study.
Conceptual Framework of the Study
As previously stated, the disablement process model by Verbrugge and Jetta (1994) has served as an important guide for research in aging and disability (e.g., Jang et al., 2003; Janke, Payne, & Puymbroeck, 2008; Porell & Miltiades, 2001) as well as research examining the racial disability gap among older adults (e.g., Song et al., 2007; Zsembik et al., 2000). Although the disablement process model does not provide a clear explanation for the disability gap that exists between older black and white adults, the model implies that each group may experience developing and living with a disability differently, with various mediating factors playing a key role in this difference.
Guided by the disablement process model (Verbrugge & Jette, 1994), disability in this dissertation study is defined as having one or more physical or mental limitations in
39
Disability is assessed by ADLs and IADLs, criteria that have been widely used in previous studies to assess disability in later life. The use of ADLs and IADLs to measure disability is also recommended by the disablement process model (Verbrugge & Jette, 1994). This dissertation study focuses on differences in disability onset between community-dwelling older black (non-Hispanic) and white (non-Hispanic) adults ages 50 and older in the U.S. by investigating each indicator of ADL and IADL disability on an individual basis. In addition, this study examines the mediators that account for the differences between these two groups. Specifically, it examines the role of three possible mediating factors—chronic disease, health behaviors, and socioeconomic status—to explain the black/white gap in disability onset.
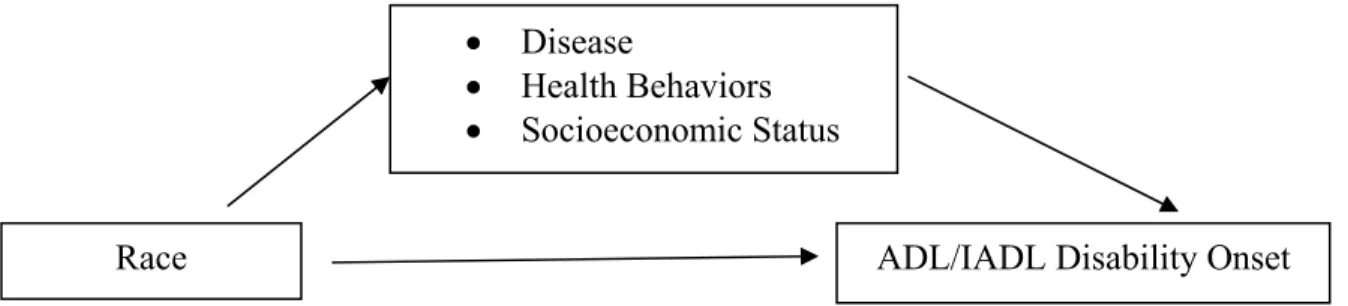
Figure 2 depicts the conceptual framework used in this study. According to this framework, disease, health behaviors, and SES are mediators that connect race with the onset of each ADL or IADL disability (outcome). This mediation model seeks to identify and explicate the mechanism that underlies an observed relationship between race and the onset of ADL or IADL disability by the inclusion of three mediating factors.
Figure 2. The Conceptual Framework of the Study
Based on this conceptual framework, this study focuses on the following two research questions.
Race ADL/IADL Disability Onset
• Disease
40
Research Question 1: Is there a difference in the risk of disability onset between non-Hispanic white adults and non-non-Hispanic black adults ages 50 and older? Does it change with advancing age?
Research Question 2: If so, to what extent do chronic disease, health behaviors, and SES contribute to the gap in the risk of disability onset between these two groups?
To answer these two research questions, this study investigates each of the 12 ADL and IADL indicators individually when measuring disability instead of aggregating ADL and IADL indicators, which was the method employed in previous studies.
Regarding Research Question 1, earlier studies on the black/white disability gap consistently reported that older black persons were more likely to be disabled than older white persons (Hayward et al., 2000; Kelley-Moore & Ferraro, 2004). Therefore, this study hypothesizes that the risk of disability onset will differ for older non-Hispanic white adults vs. older non-Hispanic black adults according to most disability indicators (i.e., the 12 ADL and IADL indicators examined in this study). It is expected that older whites will have a lower risk of becoming disabled than older blacks.
For Research Question 2, this study hypothesizes that chronic diseases, health
41
42
CHAPTER 4
RESEARCH METHODS
Data
This study used six waves of longitudinal data from the RAND Health and
Retirement Study (HRS) collected between 1998 and 2008. Conducted by the University of Michigan with the support from the National Institute on Aging, the HRS has collected data on various measures, especially health and disability, assets and income, health behaviors, employment, and retirement. The HRS is a biennial (once every two years) panel survey of a nationally representative sample of non-institutionalized Americans ages 50 and older. Its main goal is to provide longitudinal data for research to support the creation of effective policies on retirement, health, and economic well-being of older adults in the U.S. (National Institute on Aging, 2007).
The HRS was launched in 1992 with an original cohort sample of individuals ages 51 to 61. In 1998, HRS expanded to create a nationally representative sample of U.S. older adults ages 50 and older by adding three cohorts—the oldest cohort (persons born before 1924), the children of the Great Depression cohort (born between 1924 and 1930), and the World War II baby cohort (born between 1948 and 1953)—to its initial HRS cohort.
Because of the complexity of the HRS raw data (e.g., missing data and inconsistent measuring of variables across waves, which makes it difficult to match respondent
43
Administration and the National Institute on Aging, developed the RAND HRS, a user-friendly version of the HRS with a subset of important variables from the original HRS. In creating RAND HRS, the RAND Corporation has undertaken extensive efforts to make the data uniform and accessible to researchers, include cleaning and checking the consistency of data across waves, missing data imputation (especially for financial measures8), and using bracketing methodsto minimize non-response and matching structure of variables across waves. The RAND HRS is a leading source of research on the older population of the U.S. because of the richness of the original HRS and the relative ease of access to the data (Phillips, 2003/2004).As of December 2010, the RAND HRS is publicly available from wave 1 (collected in 1992) to wave 9 (collected in 2008).
This study utilized the RAND HRS to explore the black/white disability gap for the following reasons. First, the data encompasses a lengthy study period and has a nationally representative sample. Second, the data contains the most relevant variables, such as various chronic disease and health behavior measures, as well as information about net worth, which provides a more comprehensive measure of respondents’ SES. Third, the data provides the most complete information on ADL and IADL indicators for all waves. Fourth, the RAND HRS has been widely used in previous studies on the topic of health and disability among older adults. This study used the RAND HRS from wave 4 (collected in 1998) through wave 9 (collected in 2008) because the sample from the earlier waves included only the initial HRS sample, which was limited to persons ages 51 to 61.
Sample
The RAND HRS wave 4 included 18,104 non-institutionalized adults ages 50 and
8
44
older: 2,774 non-Hispanic blacks and 15,530 non-Hispanic whites. Because this dissertation study focused on the timing of disability onset since age 50, the study sample was restricted to respondents who were not disabled (i.e., respondents without any limitations in
ADLs/IADLs) in wave 4, which decreased the sample to 13,447 respondents (11,693 whites and 1,765 blacks).
This study is designed to use time-varying covariates for most variables, which requires complete records of variables from wave 4 until the wave in which disability onset or censoring9 occurs. Although the RAND HRS provided the most complete information across all waves owing to RAND’s extensive cleaning of the HRS raw data and imputation of missing data, a small number of missing values were still present in the RAND HRS data. The percentage of missing values for the independent variables ranged from 0% (entering cohort, gender, living status, income, and net worth) to 1.3% (BMI) of the 13,447
respondents in wave 4. The proportion of missing cases was similar across all study waves (i.e., waves 4 to 9).
To deal with these missing values, this study adopted forward imputation (also called carry-forward imputation), which replaced missing values with the values from the previous waves. Forward imputation was selected according to the following rationale. First, it is a feasible and credible strategy and it protects the dependence between an outcome and a covariate with missing imputation (Singer & Willett, 2003). Second, this method has been recommended and widely employed in previous studies using HRS/RAND HRS data (e.g., Doshi, Cen, & Polsky, 2008; Feinglass et al., 2007; Hoffmann, 2005; Lachance & Seligman, 2009). Third, list-wide deletion resulted in inconsistent samples across all study outcomes
9
45
(i.e., all 12 disability indicators) because the timing of onset was different among each disability outcome. Fourth, the results from sensitivity analyses with a list-wide deleted sample for two study outcomes (the ADL indicator walking across a room and the IADL indicator using a map) were very similar to those of Cox models with a forward-imputed sample. Therefore, the decision was made to use the forward-imputed sample.
Of the 13,447 respondents, 29 (0.001%) were deleted from the sample because of missing cases on covariates10 even after performing forward imputation. Removal of the missing cases was not likely to affect the study results because the number of missing cases is relatively small given the size of the total sample. The final sample size for this study was determined to be 13,429 respondents (11,673 whites and 1,756 blacks).11
Censoring, Study Window, and Time Origin
In survival analysis, there are three types of censoring which occur when the timing of the event of interest is unknown. First, left censoring occurs when an individual
experiences the event of interest, but it is unknown when the event started. In other words, the event of interest occurs before the start of the observation period. Second, right censoring occurs when an individual has the event of interest after the end of observation period. Third, random censoring indicates when an individual has the event of interest after he or she dropped from the sample because of loss of contact or death.
This study did not have left censoring cases since the study sample was limited to the respondents who were not disabled at baseline (i.e., wave 4). However, the majority of the study sample was right- or random-censored cases. The right censoring in this study refers to the respondents who did not experience a disability by the wave 9. Across the 12 study
10
Missing cases included 28 BMI, 1 hypertension, 1 lung disease, 3 heart disease, 1 stroke, 2 arthritis, and 12 education records.
11