ARTICLE
REVEL: An Ensemble Method for Predicting
the Pathogenicity of Rare Missense Variants
Nilah M. Ioannidis,1,2,34 Joseph H. Rothstein,2,3,4,34 Vikas Pejaver,5 Sumit Middha,6 Shannon K. McDonnell,7 Saurabh Baheti,7 Anthony Musolf,8 Qing Li,8 Emily Holzinger,8 Danielle Karyadi,9 Lisa A. Cannon-Albright,10 Craig C. Teerlink,10 Janet L. Stanford,11
William B. Isaacs,12Jianfeng Xu,13 Kathleen A. Cooney,10,14Ethan M. Lange,15 Johanna Schleutker,16,17 John D. Carpten,18 Isaac J. Powell,19 Olivier Cussenot,20 Geraldine Cancel-Tassin,20
Graham G. Giles,21,22 Robert J. MacInnis,21,22 Christiane Maier,23,24 Chih-Lin Hsieh,25
Fredrik Wiklund,26 William J. Catalona,27 William D. Foulkes,28 Diptasri Mandal,29 Rosalind A. Eeles,30 Zsofia Kote-Jarai,30 Carlos D. Bustamante,1,31 Daniel J. Schaid,7 Trevor Hastie,31,32 Elaine A. Ostrander,9 Joan E. Bailey-Wilson,8 Predrag Radivojac,5 Stephen N. Thibodeau,33 Alice S. Whittemore,2,31
and Weiva Sieh2,3,4,*
The vast majority of coding variants are rare, and assessment of the contribution of rare variants to complex traits is hampered by low sta-tistical power and limited functional data. Improved methods for predicting the pathogenicity of rare coding variants are needed to facil-itate the discovery of disease variants from exome sequencing studies. We developed REVEL (rare exome variant ensemble learner), an ensemble method for predicting the pathogenicity of missense variants on the basis of individual tools: MutPred, FATHMM, VEST, Poly-Phen, SIFT, PROVEAN, MutationAssessor, MutationTaster, LRT, GERP, SiPhy, phyloP, and phastCons. REVEL was trained with recently discovered pathogenic and rare neutral missense variants, excluding those previously used to train its constituent tools. When applied to two independent test sets, REVEL had the best overall performance (p<1012) as compared to any individual tool and seven ensemble methods: MetaSVM, MetaLR, KGGSeq, Condel, CADD, DANN, and Eigen. Importantly, REVEL also had the best performance for distin-guishing pathogenic from rare neutral variants with allele frequencies<0.5%. The area under the receiver operating characteristic curve (AUC) for REVEL was 0.046–0.182 higher in an independent test set of 935 recent SwissVar disease variants and 123,935 putatively neutral exome sequencing variants and 0.027–0.143 higher in an independent test set of 1,953 pathogenic and 2,406 benign variants recently reported in ClinVar than the AUCs for other ensemble methods. We provide pre-computed REVEL scores for all possible human missense variants to facilitate the identification of pathogenic variants in the sea of rare variants discovered as sequencing studies expand in scale.
Introduction
Interpreting genetic variation from next-generation seq-uencing (NGS) datasets is essential for the advancement of personalized medicine.1,2 The vast majority of vari-ants discovered by NGS are rare.3,4 Recent exome and
genome sequencing studies have found that roughly 85% of nonsynonymous variants have alternate allele frequencies (AFs) less than 0.5%, and roughly 100–400 rare nonsynonymous variants are discovered per sequenced individual.3,4 Rare coding variants play major roles in disease causation and might contribute
1Department of Genetics, Stanford University, Stanford, CA 94305, USA;2Department of Health Research and Policy, Stanford University, Stanford, CA
94305, USA;3Department of Genetics and Genomic Sciences, Icahn School of Medicine at Mount Sinai, New York, NY 10029, USA;4Department of Pop-ulation Health Science and Policy, Icahn School of Medicine at Mount Sinai, New York, NY 10029, USA;5Department of Computer Science and Informatics, Indiana University, Bloomington, IN 47405, USA;6Department of Pathology, Memorial Sloan Kettering Cancer Center, New York, NY 10065, USA;7 Depart-ment of Health Sciences Research, Mayo Clinic, Rochester, MN 55905, USA;8Computational and Statistical Genomics Branch, National Human Genome Research Institute, Baltimore, MD 21224, USA;9Cancer Genetics and Comparative Genomics Branch, National Human Genome Research Institute, Be-thesda, MD 20892, USA;10Department of Internal Medicine, University of Utah School of Medicine, Salt Lake City, UT 84108, USA;11Public Health Sci-ences Division, Fred Hutchinson Cancer Research Center, Seattle, WA 98109, USA;12Brady Urological Institute, Sidney Kimmel Comprehensive Cancer Center, Johns Hopkins University School of Medicine, Baltimore, MD 21287, USA;13NorthShore University HealthSystem Research Institute, Evanston, IL 60201, USA;14Departments of Internal Medicine and Urology, University of Michigan Medical School, Ann Arbor, MI 48109, USA;15Department of Genetics, University of North Carolina at Chapel Hill, Chapel Hill, NC 27599, USA;16Department of Medical Biochemistry and Genetics, University of Turku, Turku 20014, Finland;17Department of Medical Genetics, Tyks Microbiology and Genetics, Turku University Hospital, Turku 20520, Finland;18Integrated Cancer Genomics Division, Translational Genomics Research Institute, Phoenix, AZ 85004, USA;19Department of Urology, Wayne State University, Detroit, MI 48201, USA;20Centre de Recherche sur les Pathologies Prostatiques et Urologiques, Universite Paris, Paris, 75013, France;21Cancer Epidemiology Centre, Cancer Council Victoria, Melbourne, VIC 3004, Australia;22Centre for Epidemiology and Biostatistics, University of Melbourne, Melbourne, VIC 3010, Australia;23Institute of Human Genetics, University Hospital of Ulm, Ulm 89075, Germany;24Department of Urology, University Hospital of Ulm, Ulm 89075, Germany;25Department of Urology, University of Southern California, Los Angeles, CA 90033, USA; 26
Department of Medical Epidemiology and Biostatistics, Karolinska Institutet, Stockholm 171 77, Sweden;27Department of Urology, Northwestern Uni-versity Feinberg School of Medicine, Chicago, IL 60611, USA;28Departments of Oncology and Human Genetics, Montreal General Hospital, Montreal, QC H3G 1A4, Canada;29Department of Genetics, Louisiana State University Health Sciences Center, New Orleans, LA 70112, USA;30Division of Genetics and Epidemiology, Institute of Cancer Research, London SM2 5NG, UK;31Department of Biomedical Data Science, Stanford University, Stanford, CA 94305, USA;32Department of Statistics, Stanford University, Stanford, CA 94305, USA;33Department of Laboratory Medicine and Pathology, Mayo Clinic, Rochester, MN 55905, USA
34These authors contributed equally to this work
*Correspondence:[email protected] http://dx.doi.org/10.1016/j.ajhg.2016.08.016.
to the missing heritability from genome-wide association studies.5,6However, the majority of nonsynonymous var-iants discovered by NGS have unknown significance because experimental validation of large numbers of rare variants is infeasible, and association studies require prohibitively large sample sizes to detect rare variants with modest effect sizes with high statistical power. Therefore, computational tools that can accurately pre-dict the pathogenicity of rare variants are needed to help identify those variants that are most likely to cause disease.
Many tools for predicting the pathogenicity of missense variants have been developed based on features such as amino acid or nucleotide conservation and biochemical properties of the amino acid substitutions.7–18However, individual tools often disagree, in part because they utilize different predictive features. Ensemble methods that combine the results of multiple individual predictors can improve performance.19–28 However, few existing pathogenicity prediction tools have targeted the interpre-tation of rare variants.24Current tools are often trained on predominantly common neutral variants and some explicitly impose a minimum AF threshold for defining neutral training variants.15,21,25In contrast, most disease training variants are rare. As a result of this AF imbalance between disease and neutral training variants, tools that rely on AF as a predictive feature might have a lower ability to distinguish disease variants from rare neutral variants than from common ones.24Biological differences such as higher conservation scores for rare versus com-mon variants might also make rare neutral variants more difficult to distinguish from disease variants.24,29 Despite the fact that the vast majority of nonsynonymous variants discovered by NGS are rare, the performance of existing prediction tools on rare variants is not well known.30Thus, there is a growing need for the develop-ment and evaluation of tools for predicting the pathoge-nicity of rare variants.
Here, we present an ensemble method for predicting the pathogenicity of missense variants that outper-forms existing approaches overall and when applied to rare variants. The rare exome variant ensemble learner (REVEL) method incorporates recently devel-oped individual prediction tools as features and was trained on recently discovered disease and rare neutral missense variants that did not overlap with the training data for its constituent predictors. We also assembled two large independent test sets of recently discovered pathogenic and benign variants that parallel the likely application of REVEL to newly discovered variants from NGS studies. We benchmark the performance of REVEL and existing ensemble predictors for distin-guishing disease mutations from neutral variants across a broad range of AFs. To make our method easily accessible for research and clinical use, we pro-vide pre-computed REVEL scores for all possible human missense variants.31
Material and Methods
Random Forest
We trained a random forest on the set of variants described below by using the R ‘‘randomForest’’ package32 with 1,000 binary classification trees.33,34 We selected the number of trees to be sufficiently large for the out-of-bag (OOB) error rate to plateau; sensitivity analyses showed that increasing the number of trees to 3,000 did not improve performance on the training dataset. The OOB prediction for a given training variant is the proportion of trees that classified the variant as pathogenic across only those trees in the forest that excluded the variant from their bootstrap-ped training sample.33Four features were selected at random as candidates for each split in the random forest trees, which was the default value for 18 features described below. To address the imbalance in the numbers of available disease and neutral training variants, we sampled the same number (n¼6,182) of disease and neutral variants when generating the bootstrapped training set for each tree in the forest. The importance of each predictive feature was measured by the total decrease in the Gini index33 (improve-ment in node purity) for all splits on that feature, averaged over all trees in the forest.
Training Variants
REVEL was trained with putative rare neutral and disease missense variants. Disease variants were obtained from the Human Gene Mutation Database (HGMD)35version 2015.2 and were restricted to the set of missense disease mutations (DMs) added to HGMD since August 1, 2012 to minimize overlap with variants previously used to train component features in the REVEL random forest. Missense exome sequencing variants (ESVs) were obtained from the Exome Sequencing Project (ESP)4 European-American and African-American populations, the Atherosclerosis Risk in Communities (ARIC) study36 European-American and African European-American populations, and the 1000 Genomes Project (KGP)3European, Yoruban, and Asian popula-tions, as recorded in dbNSFP31 version 2.7. After excluding all disease variants in HGMD and the data sources for test sets 1 and 2 described below, the remaining missense ESVs were considered putatively neutral. For both the disease and neutral training variants, we also excluded all variants that had previ-ously been used to train individual component features in the REVEL random forest; specifically, MutPred,8 PolyPhen-2,10 MutationTaster,11 FATHMM v2.3,14 and VEST 3.0.15 Finally, when a given genetic variant corresponded to multiple amino acid substitutions (AASs) at the protein level, only one AAS was selected at random. After applying all exclusion criteria, a total of 6,182 disease variants and 281,972 putatively neutral ESVs re-mained. We randomly selected approximately half (n¼140,921) of the putatively neutral ESVs, of which 123,706 rare ESVs (with a maximum alternate AF between 0.1% and 1% across the seven study populations) were used for training, and 17,215 ESVs with an AF>1% were used for initial evaluation of performance across a range of AFs. The remaining half of ESVs were held out for use as independent test variants as described below. Thus, the final training set consisted of 6,182 HGMD disease variants and 123,706 rare neutral ESVs.
Features
were newly computed for this study with the UniProt37canonical protein sequence when available and the Ensembl38 canonical transcript otherwise. PROVEAN13 scores were obtained from dbNSFP v2.9 (February 3, 2015). 16 additional scores were obtained from dbNSFP v2.7 (September 12, 2014), including eight functional prediction scores (SIFT,7 PolyPhen-2 HVAR and HDIV, LRT,9 MutationTaster, MutationAssessor,12 FATHMM v2.3, and VEST 3.0) and eight conservation scores (GERPþþ,39 SiPhy,40 three phyloP41scores for primates, placental mammals, and vertebrates, and three phastCons42 scores for primates, placental mammals, and vertebrates). For PolyPhen-2, FATHMM, and PROVEAN, when multiple protein isoforms were associated with a given variant, we used the average score across all isoforms. Missing features were imputed with thek-nearest neighbors method implemented in the R ‘‘impute’’ package.43Missing feature values for a given variant were assigned the average value of the non-missing values of that feature from itsk¼40 nearest neighboring variants; when more than 50% of features were missing for a given variant, we assigned to each missing feature its overall mean across all variants.
Test Sets
We assembled two independent test sets that did not overlap with either the REVEL training data or the training data for the compo-nent features of REVEL. Test set 1 consisted of 935 disease variants added to SwissVar44(release 2015_10) since August 1, 2012 and approximately half (n ¼ 141,051) of the putatively neutral missense ESVs described above that had not been included in the REVEL training set or initial evaluation. Test set 2 consisted of 1,953 pathogenic or likely pathogenic and 2,406 benign or likely benign variants recently deposited into ClinVar45,46by sub-mitters following variant classification guidelines similar to the American College of Medical Genetics and Genomics (ACMG) guidelines.47,48Specifically, all single-nucleotide missense variants submitted to ClinVar by GeneDx, Emory Genetics Laboratory, Partners HealthCare Laboratory for Molecular Medicine,49 Univer-sity of Chicago Genetic Services Laboratory, Ambry Genetics, and Invitae were downloaded on October 13, 2015. We excluded the following from both test sets 1 and 2: all REVEL training variants, all DM variants added to HGMD prior to August 1, 2012, and all variants that had previously been used to train individual compo-nent features in REVEL. Finally, to eliminate overlap between the two test sets, we excluded any variants that were present in both SwissVar and ClinVar from test set 1 if benign (n¼9) and from test set 2 if pathogenic (n¼12).
Comparators
We compared the performance of REVEL to seven ensemble pre-diction tools that were recently developed, widely used, and readily implemented: MetaLR,28 MetaSVM,28 Eigen,50 CADD16 v1.3, DANN,17Condel,19and KGGSeq23,24v0.8. We ran KGGSeq with the default model selection option that chooses an optimized set of features for each variant.24 We plotted receiver operating characteristic (ROC) curves and compared the area under the ROC curve (AUC) estimates for different tools by using Delong’s test51implemented in the R ‘‘pROC’’ package.52We also computed the area under the precision-recall (PR) curve by using the R ‘‘ROCR’’ package.53For the training variants, REVEL scores were computed by using only the OOB predictions, which have been shown to provide performance estimates that are as accurate as for an independent test set of equal size consisting of variants with similar characteristics.33
Results
Characterization of REVEL Features
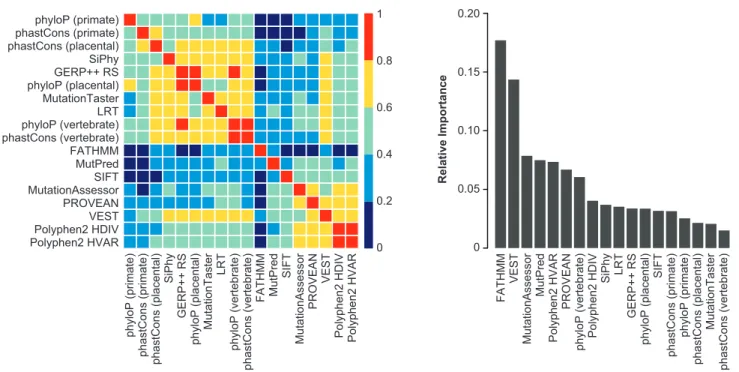
The REVEL ensemble score combines pathogenicity pre-dictions from 18 individual scores (features), including 8 conservation scores and 10 functional scores. Figure 1A shows the correlation among individual features. The con-servation scores, as well as LRT and Mutation Taster, were almost all highly (Spearman rank correlation coefficient, R>0.6) to moderately correlated (0.4<R<0.6). Five func-tional scores (MutationAssessor, PROVEAN, VEST, and PolyPhen-2 HDIV and HVAR) were almost all highly correlated. VEST was also highly correlated with several conservation scores, LRT, and MutationTaster. In contrast, FATHMM had low correlation (R < 0.4) with all other scores, and MutPred and SIFT had low to moderate correla-tion with other scores. The five most important features in the REVEL random forest were FATHMM, VEST, Mutation-Assessor, MutPred, and PolyPhen-2 HVAR (Figure 1B). The importance measure for an individual feature reflects corre-lations with other features as well as its intrinsic predictive ability because importance may be shared among corre-lated features.34
Overall Performance of REVEL as Compared with Other Methods
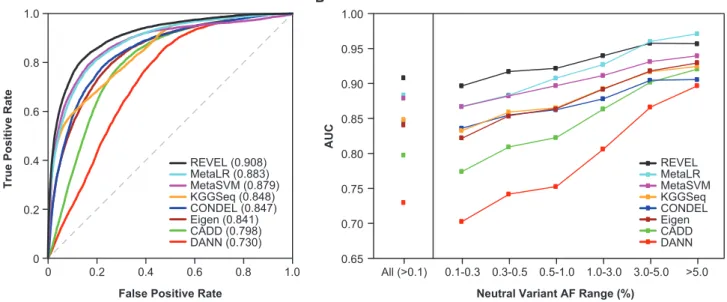
The REVEL ensemble score discriminated well between HGMD disease mutations and putatively neutral ESVs, and an overall AUC of 0.908 was estimated with OOB pre-dictions for the training set (Figure 2A). The AUC for REVEL was significantly better than any of its constituent features (maximum p< 1012for any pairwise compari-son), among which VEST (AUC ¼ 0.844) and FATHMM (AUC ¼ 0.824) had the highest AUCs (Table S1). AUCs for the other individual prediction tools ranged from 0.589 to 0.809 and tended to be higher for functional pre-dictors (0.717–0.844) than for conservation scores (0.589– 0.791). The AUC for REVEL was also significantly better than the other ensemble methods (maximum p <1012 for any pairwise comparison), among which MetaLR (AUC ¼ 0.883) and MetaSVM (AUC ¼ 0.879) had the next highest AUCs (Figure 2A;Table S2).
Performance for Rare versus Common Neutral Variants
improvements in AUC for rare variants with AF< 0.5%
(Figure 2B;Table S2). For neutral variants with AF> 3%,
REVEL had the second highest AUC after MetaLR. In addition, the performance of REVEL appeared to be less sensitive to neutral variant AF than other methods. The AUC range for very rare to common variants was nar-rowest for REVEL (0.897–0.957) and widest for DANN (0.703–0.897), which appeared to be most sensitive to AF
(Table S2).
Performance Evaluation in Two Independent Test Sets In test set 1, consisting of 935 independent disease muta-tions from SwissVar and 141,051 putatively neutral ESVs, the relative performance of all eight ensemble predictors
(Figure 3; Table S3) was similar to that observed in the
training set. REVEL had the best performance both overall (p<1012) and for neutral variants within all AF ranges up to 5%. For common neutral variants with AF>5%, REVEL was again surpassed only by MetaLR. The improvement in AUC obtained with REVEL versus with the other ensemble methods was again greatest for rare neutral variants. In test set 2, consisting of 1,953 pathogenic and 2,406 benign var-iants from ClinVar, we confirmed that REVEL had the best performance among the ensemble methods both overall (p< 1012) and for neutral variants within all AF ranges up to 3% and that the improvement in AUC was greatest for rare neutral variants (Figure 4; Table S4). All of the ensemble methods had a better overall ability to distin-guish benign versus pathogenic variants from ClinVar than putatively neutral ESVs versus disease variants from
SwissVar or HGMD, which could be a consequence of the more stringent definition of benign variants from ClinVar. REVEL also had the best overall performance measured by the area under the PR curve (Table S5) across a wide range of proportions of disease variants represented in the training set (4.8%) and test sets 1 (0.7%) and 2 (44.8%).
Interpretation of REVEL Scores
The REVEL score for an individual variant can range from zero to one, reflecting the proportion of trees in the random forest that classified the variant as pathogenic. REVEL score distributions for the 6,182 HGMD disease and 123,706 putatively neutral ESV training variants, and for all 1,125,160 ESVs reported by ESP, ARIC, and KGP, are shown inFigure 5A. The distributions of REVEL scores were very similar for all reported ESVs and the subset of pu-tatively neutral ESV training variants, with only a small shift toward higher scores for all ESVs. Figure 5B shows the percentiles of the REVEL scores separately for disease and neutral training variants or all ESVs.Figure S1shows the sensitivity and specificity corresponding to different REVEL score thresholds, above which a variant would be classified as pathogenic. For example, 75.4% of disease mu-tations but only 10.9% of neutral variants (and 12.4% of all ESVs) have a REVEL score above 0.5, corresponding to a sensitivity of 0.754 and specificity of 0.891. Selecting a more stringent REVEL score threshold of 0.75 would result in higher specificity but lower sensitivity, with 52.1% of disease mutations, 3.3% of neutral variants, and 4.1% of all ESVs being classified as pathogenic.
A B
phyloP (primate)
phastCons (primate)
phastCons (placental)
SiPhy
GERP++ RS
phyloP (placental)
MutationTaster
LRT
phyloP (vertebrate)
phastCons (vertebrate)
FATHMM MutPred
SIFT
MutationAssessor
PROVEAN
VEST
Polyphen2 HDIV Polyphen2 HVAR 0 0.2 0.4 0.6 0.8 1 phyloP (primate)
phastCons (primate) phastCons (placental) SiPhy GERP++ RS phyloP (placental) MutationTaster LRT phyloP (vertebrate) phastCons (vertebrate) FATHMM MutPred SIFT MutationAssessor PROVEAN VEST Polyphen2 HDIV Polyphen2 HVAR
FATHMM
VEST
MutationAssessor
MutPred
Polyphen2 HVAR
PROVEAN
phyloP (vertebrate)
Polyphen2 HDIV
SiPhy LRT
GERP++ RS
phyloP (placental)
SIFT
phastCons (primate)
phyloP (primate)
phastCons (placental)
MutationTaster
phastCons (vertebrate)
0.20
0.15
0.10
0.05
0
Relative Importance
Figure 1. Individual Prediction Tools Included as Features in the REVEL Random Forest
(A) Correlation among the individual features, ordered by hierarchical clustering. The heatmap illustrates the Spearman rank correlation coefficients between features computed for the REVEL training variants.
Discussion
REVEL is an ensemble method for predicting the pathoge-nicity of rare missense variants. Rare variants are likely to comprise the vast majority of variants of unknown signif-icance discovered in future sequencing studies. We have shown that REVEL consistently has the best overall perfor-mance as compared to existing methods, particularly for distinguishing disease mutations from uncommon neutral missense variants with an AF below 3%. To facilitate use by clinicians and researchers, we have pre-computed REVEL scores for all missense variants in dbNSFP v2.7, a database of all potential nonsynonymous single-nucleotide variants in the human genome. REVEL thus addresses the need for a pathogenicity prediction tool with improved accuracy for interpreting rare genetic variants.
The REVEL method has several strengths. First, REVEL was trained and tested on recently identified disease and neutral variants that could closely resemble novel variants discovered by future NGS studies, which are likely to include variants with lower AFs and more modest effects than previously discovered variants. The REVEL neutral training variants were specifically restricted to AFs between 0.1% and 1% to improve performance when interpreting rare variants. Second, REVEL incorporates a larger number of individual predictors than prior ensemble methods, including both MutPred and VEST, which were among the most important features in the REVEL random forest. MutPred scores, in particular, were not previously widely available and have now been computed for all missense variants in dbNSFP v2.7 as part of this study. Finally, we carefully removed from the training and test sets all
variants used to train any of the component predictors in REVEL to reduce overfitting and inflated performance estimates.
A key limitation of this study and others is the reliance on pathogenicity assertions from existing databases, which might be inaccurate and incomplete. Misclassifica-tion of training and test variants as disease or neutral would limit both the accuracy of the prediction method and the resulting performance estimates. Nonetheless, we expect that the putative disease variants used to train REVEL are enriched for true disease variants as compared to the putative neutral variants, allowing identification of key predictive features of pathogenic variants. An addi-tional complication is that existing pathogenicity asser-tions for some variants might have been based in part on predictions from popular tools, such as SIFT and Poly-Phen-2, potentially resulting in inflated performance of these predictors and ensemble scores that use them. Finally, the performance of REVEL and other ensemble methods is limited by the accuracy of the component dictors and could benefit from inclusion of additional pre-dictors as they become available in the future.
REVEL had the highest overall performance of any method in independent test sets, although its performance on common variants with AFs>3%–5% was slightly worse than that of MetaLR or MetaSVM. The strong overall per-formance of REVEL reflects the fact that the majority of neutral variants in the training and test datasets were rare, as expected for novel variants discovered by NGS. Furthermore, although we carefully removed all variants used to train REVEL and its constituent features from the two test sets, we did not systematically exclude training
A B
REVEL (0.908) MetaLR (0.883) MetaSVM (0.879) KGGSeq (0.848) CONDEL (0.847)
CADD (0.798) DANN (0.730) Eigen (0.841) 1.0
0.8
0.6
0.4
0 0.2
1.0 0 0.2 0.4 0.6 0.8
True Positive Rate
False Positive Rate
REVEL MetaLR MetaSVM KGGSeq CONDEL
CADD DANN Eigen 1.00
0.90
0.85
0.80
0.65 0.70 0.95
0.75
AUC
Neutral Variant AF Range (%)
0.1-0.3 0.3-0.5 0.5-1.0 1.0-3.0 3.0-5.0 >5.0 All (>0.1)
Figure 2. Performance of Ensemble Methods for Discrimination of Disease Training Variants from Putatively Neutral ESVs
(A) ROC curves for 6,182 HGMD disease mutations and 123,706 rare (AF 0.001–0.01) neutral ESVs used to train REVEL. REVEL scores were computed with only the OOB predictions for its training variants.
variants for the comparator ensemble scores; thus, the per-formance estimates for the comparators could be overly optimistic. MetaLR and MetaSVM had the next highest overall performance. These two ensemble methods in-cluded many of the same predictive features as REVEL, except for VEST, MutPred, and PROVEAN, and also included the AF, which could contribute to their greater sensitivity to the neutral variant AF. Condel is a weighted average of FATHMM and MutationAssessor, and its lower performance relative to some ensemble methods could
be due to the inclusion of fewer predictive features. Eigen employs an unsupervised approach to separate variants into two classes and also uses fewer predictive features than REVEL, MetaLR, and MetaSVM. CADD and DANN differ from the other ensemble methods in their use of many basic genomic and protein annotations from ENCODE and Ensembl as features in addition to functional predictions from PolyPhen-2 and SIFT. Although CADD and DANN did not perform as well as the other ensemble methods for missense variants, they have important
A B
REVEL (0.893) MetaLR (0.849) MetaSVM (0.837) KGGSeq (0.844) CONDEL (0.804)
CADD (0.774) DANN (0.726) Eigen (0.803) 1.0
0.8
0.6
0.4
0 0.2
1.0 0 0.2 0.4 0.6 0.8
True Positive Rate
False Positive Rate
REVEL MetaLR MetaSVM KGGSeq CONDEL
CADD DANN Eigen 1.00
0.90
0.85
0.80
0.65 0.70 0.95
0.75
AUC
Neutral Variant AF Range (%)
0.1-0.3 0.3-0.5 0.5-1.0 1.0-3.0 3.0-5.0 >5.0 All (>0.1)
Figure 3. Performance of Ensemble Methods in an Independent Test Set of SwissVar Disease Mutations and Putatively Neutral ESVs
(A) ROC curves for 935 SwissVar disease mutations and 123,935 rare (AF 0.001–0.01) neutral ESVs that did not overlap with the training set.
(B) AUC for 935 SwissVar disease mutations and 141,051 neutral ESVs, excluding REVEL training variants, stratified by neutral variant AF.
A B
REVEL (0.957) MetaLR (0.917) MetaSVM (0.933) KGGSeq (0.893) CONDEL (0.898)
CADD (0.902) DANN (0.833) Eigen (0.910) 1.0
0.8
0.6
0.4
0 0.2
1.0 0 0.2 0.4 0.6 0.8
True Positive Rate
False Positive Rate
REVEL MetaLR MetaSVM KGGSeq CONDEL
CADD DANN Eigen 1.00
0.90
0.85
0.80
0.65 0.70 0.95
0.75
AUC
Neutral Variant AF Range (%)
<0.1 0.1-0.5 0.5-1.0 1.0-3.0 >3.0 All (>0)
Figure 4. Performance of Ensemble Methods in an Independent Test Set of 1,953 Pathogenic and 2,406 Benign Variants from ClinVar
(A) ROC curves and the AUC for all variants.
advantages for genome-wide NGS applications because they provide scores for noncoding and regulatory variants that are on the same scale as for coding variants.
The improved performance of REVEL relative to other ensemble methods was greatest for discriminating be-tween disease and rare neutral variants. This result might be partly explained by the fact that REVEL was trained on rare neutral variants with AF< 1% and did not rely on AF as a predictive feature. To our knowledge, one other ensemble predictor, KGGSeq,24 was similarly trained on rare neutral variants. KGGSeq uses many of the same component predictors as REVEL, except for MutPred, and also includes CADD as a predictive feature. However, KGGSeq adaptively selects an optimal subset of features rather than using all features to predict the pathogenicity of each variant, in part to allow exclusion of features with missing data. Possible explanations for the improved performance of REVEL over KGGSeq include use of all fea-tures for all variants by first imputing missing scores, importance of MutPred as a predictive feature, and use of a random forest approach rather than logistic regression.
REVEL also outperformed its individual constituent pre-diction tools, as expected for ensemble methods.19–28The top-performing individual tools on our training dataset were VEST,15FATHMM,14and MutPred,8consistent with their high importance in the REVEL random forest. VEST predictions are based on a particularly large set of 86 basic genomic and protein annotations and had the best perfor-mance among the individual tools. FATHMM uses a hidden Markov modeling approach to analyze multiple sequence alignments and alignments of conserved protein domain
families to compute position-specific amino acid probabili-ties. The uniqueness of this method might contribute to the low correlation between FATHMM and other prediction tools and high importance in REVEL.28Finally, the strong performance of MutPred could be because its predictions are based on a particularly detailed model of protein tural and functional properties, including secondary struc-ture, solvent accessibility, functional domains, methylation, phosphorylation, and glycosylation, with quantitative esti-mates of the probability of losing each property as a result of a particular amino acid change.
In conclusion, REVEL is an ensemble method that out-performs existing tools for distinguishing disease variants from rare neutral variants. REVEL can be used to prioritize the most likely clinically or functionally relevant variants among the sea of rare variants that are increasingly discov-ered as sequencing studies expand in scale. For example, REVEL scores have been used by the International Consortium of Prostate Cancer Genetics as weights for combining variants discovered by exome sequencing in gene-level case-control studies. Pre-computed REVEL path-ogenicity scores for all possible human missense variants, based on GENCODE v9 gene annotations54for hg19, are available for download (seeWeb Resources). To aid inter-pretation, we also provide estimates of REVEL sensitivity and specificity for different score thresholds and the quan-tiles of the REVEL score in over one million ESVs observed in KGP, ESP, and ARIC. Future studies might explore the application of REVEL to specific genes to evaluate its clinical utility for interpreting variants of unknown signif-icance for a broad spectrum of clinical conditions.
0.0 0.2 0.4 0.6 0.8 1.0 0.0
0.2 0.4 0.6 0.8 1.0
REVEL Score
Cumulative Proportion
A B
0.05 0.15 0.25 0.35 0.45 0.55 0.65 0.75 0.85 0.95
REVEL Score
Proportion
0.00 0.05 0.10 0.15 0.20
All ESVs Neutral variants Disease variants 0.25
Figure 5. Interpretation of REVEL Scores
(A) Distribution of REVEL scores for 6,182 disease (red) and 123,706 neutral (blue) training variants and 1,125,160 ESVs (black). REVEL scores were computed with only the OOB predictions for training variants.
Supplemental Data
Supplemental Data include one figure and five tables and can be found with this article online at http://dx.doi.org/10.1016/j. ajhg.2016.08.016.
Acknowledgments
This research was funded by NIH grants U01CA089600, R01CA094069, R01LM009722, R01MH105524, K07CA143047, and F32HG008330 and by the Intramural Research Program of the National Human Genome Research Institute, NIH.
Received: April 18, 2016 Accepted: August 23, 2016 Published: September 22, 2016
Web Resources
ClinVar,https://www.ncbi.nlm.nih.gov/clinvar/ dbNSFP,https://sites.google.com/site/jpopgen/dbNSFP Human Gene Mutation Database,http://www.hgmd.cf.ac.uk/ REVEL,https://sites.google.com/site/revelgenomics/
SwissVar,http://swissvar.expasy.org/
References
1. Peterson, T.A., Doughty, E., and Kann, M.G. (2013). Towards precision medicine: advances in computational approaches for the analysis of human variants. J. Mol. Biol.425, 4047– 4063.
2. Yang, Y., Muzny, D.M., Reid, J.G., Bainbridge, M.N., Willis, A., Ward, P.A., Braxton, A., Beuten, J., Xia, F., Niu, Z., et al. (2013). Clinical whole-exome sequencing for the diagnosis of mende-lian disorders. N. Engl. J. Med.369, 1502–1511.
3. Abecasis, G.R., Auton, A., Brooks, L.D., DePristo, M.A., Durbin, R.M., Handsaker, R.E., Kang, H.M., Marth, G.T., and McVean, G.A.; 1000 Genomes Project Consortium (2012). An inte-grated map of genetic variation from 1,092 human genomes. Nature491, 56–65.
4. Tennessen, J.A., Bigham, A.W., O’Connor, T.D., Fu, W., Kenny, E.E., Gravel, S., McGee, S., Do, R., Liu, X., Jun, G., et al.; Broad GO; Seattle GO; NHLBI Exome Sequencing Project (2012). Evolution and functional impact of rare coding variation from deep sequencing of human exomes. Science337, 64–69. 5. Cirulli, E.T., and Goldstein, D.B. (2010). Uncovering the roles of rare variants in common disease through whole-genome sequencing. Nat. Rev. Genet.11, 415–425.
6. Bamshad, M.J., Ng, S.B., Bigham, A.W., Tabor, H.K., Emond, M.J., Nickerson, D.A., and Shendure, J. (2011). Exome sequencing as a tool for Mendelian disease gene discovery. Nat. Rev. Genet.12, 745–755.
7. Kumar, P., Henikoff, S., and Ng, P.C. (2009). Predicting the effects of coding non-synonymous variants on protein func-tion using the SIFT algorithm. Nat. Protoc.4, 1073–1081. 8. Li, B., Krishnan, V.G., Mort, M.E., Xin, F., Kamati, K.K.,
Cooper, D.N., Mooney, S.D., and Radivojac, P. (2009). Auto-mated inference of molecular mechanisms of disease from amino acid substitutions. Bioinformatics25, 2744–2750. 9. Chun, S., and Fay, J.C. (2009). Identification of deleterious
mutations within three human genomes. Genome Res.19, 1553–1561.
10. Adzhubei, I.A., Schmidt, S., Peshkin, L., Ramensky, V.E., Gera-simova, A., Bork, P., Kondrashov, A.S., and Sunyaev, S.R. (2010). A method and server for predicting damaging missense mutations. Nat. Methods7, 248–249.
11. Schwarz, J.M., Ro¨delsperger, C., Schuelke, M., and Seelow, D. (2010). MutationTaster evaluates disease-causing potential of sequence alterations. Nat. Methods7, 575–576.
12. Reva, B., Antipin, Y., and Sander, C. (2011). Predicting the functional impact of protein mutations: application to cancer genomics. Nucleic Acids Res.39, e118.
13. Choi, Y., Sims, G.E., Murphy, S., Miller, J.R., and Chan, A.P. (2012). Predicting the functional effect of amino acid substitu-tions and indels. PLoS ONE7, e46688.
14. Shihab, H.A., Gough, J., Cooper, D.N., Stenson, P.D., Barker, G.L., Edwards, K.J., Day, I.N., and Gaunt, T.R. (2013). Predict-ing the functional, molecular, and phenotypic consequences of amino acid substitutions using hidden Markov models. Hum. Mutat.34, 57–65.
15. Carter, H., Douville, C., Stenson, P.D., Cooper, D.N., and Karchin, R. (2013). Identifying Mendelian disease genes with the variant effect scoring tool. BMC Genomics14(Suppl 3), S3.
16. Kircher, M., Witten, D.M., Jain, P., O’Roak, B.J., Cooper, G.M., and Shendure, J. (2014). A general framework for estimating the relative pathogenicity of human genetic variants. Nat. Genet.46, 310–315.
17. Quang, D., Chen, Y., and Xie, X. (2015). DANN: a deep learning approach for annotating the pathogenicity of genetic variants. Bioinformatics31, 761–763.
18. Niroula, A., Urolagin, S., and Vihinen, M. (2015). PON-P2: prediction method for fast and reliable identification of harm-ful variants. PLoS ONE10, e0117380.
19. Gonza´lez-Pe´rez, A., and Lo´pez-Bigas, N. (2011). Improving the assessment of the outcome of nonsynonymous SNVs with a consensus deleteriousness score, Condel. Am. J. Hum. Genet. 88, 440–449.
20. Crockett, D.K., Ridge, P.G., Wilson, A.R., Lyon, E., Wil-liams, M.S., Narus, S.P., Facelli, J.C., and Mitchell, J.A. (2012). Consensus: a framework for evaluation of uncer-tain gene variants in laboratory test reporting. Genome Med.4, 48.
21. Lopes, M.C., Joyce, C., Ritchie, G.R., John, S.L., Cunningham, F., Asimit, J., and Zeggini, E. (2012). A combined functional annotation score for non-synonymous variants. Hum. Hered. 73, 47–51.
22. Olatubosun, A., Va¨liaho, J., Ha¨rko¨ nen, J., Thusberg, J., and Vihinen, M. (2012). PON-P: integrated predictor for pathogenicity of missense variants. Hum. Mutat. 33, 1166–1174.
23. Li, M.X., Gui, H.S., Kwan, J.S., Bao, S.Y., and Sham, P.C. (2012). A comprehensive framework for prioritizing variants in exome sequencing studies of Mendelian diseases. Nucleic Acids Res.40, e53.
24. Li, M.X., Kwan, J.S., Bao, S.Y., Yang, W., Ho, S.L., Song, Y.Q., and Sham, P.C. (2013). Predicting mendelian disease-causing non-synonymous single nucleotide variants in exome sequencing studies. PLoS Genet.9, e1003143.
26. Capriotti, E., Altman, R.B., and Bromberg, Y. (2013). Collec-tive judgment predicts disease-associated single nucleotide variants. BMC Genomics14(Suppl 3), S2.
27. Bendl, J., Stourac, J., Salanda, O., Pavelka, A., Wieben, E.D., Zendulka, J., Brezovsky, J., and Damborsky, J. (2014). Pre-dictSNP: robust and accurate consensus classifier for predic-tion of disease-related mutapredic-tions. PLoS Comput. Biol. 10, e1003440.
28. Dong, C., Wei, P., Jian, X., Gibbs, R., Boerwinkle, E., Wang, K., and Liu, X. (2015). Comparison and integration of deleteri-ousness prediction methods for nonsynonymous SNVs in whole exome sequencing studies. Hum. Mol. Genet. 24, 2125–2137.
29. Hodgkinson, A., Casals, F., Idaghdour, Y., Grenier, J.C., Her-nandez, R.D., and Awadalla, P. (2013). Selective constraint, background selection, and mutation accumulation vari-ability within and between human populations. BMC Geno-mics14, 495.
30. Grimm, D.G., Azencott, C.A., Aicheler, F., Gieraths, U., MacAr-thur, D.G., Samocha, K.E., Cooper, D.N., Stenson, P.D., Daly, M.J., Smoller, J.W., et al. (2015). The evaluation of tools used to predict the impact of missense variants is hindered by two types of circularity. Hum. Mutat.36, 513–523.
31. Liu, X., Jian, X., and Boerwinkle, E. (2013). dbNSFP v2.0: a database of human non-synonymous SNVs and their func-tional predictions and annotations. Hum. Mutat.34, E2393– E2402.
32. Liaw, A., and Wiener, M. (2002). Classification and regression by randomForest. R News2, 18–22.
33. Breiman, L. (2001). Random forests. Mach. Learn.45, 5–32. 34. Hastie, T., Tibshirani, R., and Friedman, J.H. (2009). The
Elements of Statistical Learning: Data Mining, Inference, and Prediction (Springer).
35. Stenson, P.D., Mort, M., Ball, E.V., Shaw, K., Phillips, A., and Cooper, D.N. (2014). The Human Gene Mutation Database: building a comprehensive mutation repository for clinical and molecular genetics, diagnostic testing and personalized genomic medicine. Hum. Genet.133, 1–9.
36. The ARIC investigators (1989). The Atherosclerosis Risk in Communities (ARIC) Study: design and objectives. The ARIC investigators. Am. J. Epidemiol.129, 687–702.
37. Magrane, M.; UniProt Consortium (2011). UniProt Knowl-edgebase: a hub of integrated protein data. Database (Oxford) 2011, bar009.
38. Flicek, P., Amode, M.R., Barrell, D., Beal, K., Billis, K., Brent, S., Carvalho-Silva, D., Clapham, P., Coates, G., Fitzgerald, S., et al. (2014). Ensembl 2014. Nucleic Acids Res.42, D749–D755. 39. Davydov, E.V., Goode, D.L., Sirota, M., Cooper, G.M., Sidow,
A., and Batzoglou, S. (2010). Identifying a high fraction of the human genome to be under selective constraint using GERPþþ. PLoS Comput. Biol.6, e1001025.
40. Garber, M., Guttman, M., Clamp, M., Zody, M.C., Friedman, N., and Xie, X. (2009). Identifying novel constrained elements by exploiting biased substitution patterns. Bioinformatics25, i54–i62.
41. Pollard, K.S., Hubisz, M.J., Rosenbloom, K.R., and Siepel, A. (2010). Detection of nonneutral substitution rates on mamma-lian phylogenies. Genome Res.20, 110–121.
42. Siepel, A., Bejerano, G., Pedersen, J.S., Hinrichs, A.S., Hou, M., Rosenbloom, K., Clawson, H., Spieth, J., Hillier, L.W., Ri-chards, S., et al. (2005). Evolutionarily conserved elements in vertebrate, insect, worm, and yeast genomes. Genome Res.15, 1034–1050.
43. Troyanskaya, O., Cantor, M., Sherlock, G., Brown, P., Hastie, T., Tibshirani, R., Botstein, D., and Altman, R.B. (2001). Missing value estimation methods for DNA microarrays. Bio-informatics17, 520–525.
44. Mottaz, A., David, F.P., Veuthey, A.L., and Yip, Y.L. (2010). Easy retrieval of single amino-acid polymorphisms and phenotype information using SwissVar. Bioinformatics26, 851–852. 45. Landrum, M.J., Lee, J.M., Riley, G.R., Jang, W., Rubinstein,
W.S., Church, D.M., and Maglott, D.R. (2014). ClinVar: public archive of relationships among sequence variation and hu-man phenotype. Nucleic Acids Res.42, D980–D985. 46. Landrum, M.J., Lee, J.M., Benson, M., Brown, G., Chao, C.,
Chitipiralla, S., Gu, B., Hart, J., Hoffman, D., Hoover, J., et al. (2016). ClinVar: public archive of interpretations of clinically relevant variants. Nucleic Acids Res. 44 (D1), D862–D868.
47. Richards, C.S., Bale, S., Bellissimo, D.B., Das, S., Grody, W.W., Hegde, M.R., Lyon, E., and Ward, B.E.; Molecular Subcommit-tee of the ACMG Laboratory Quality Assurance CommitSubcommit-tee (2008). ACMG recommendations for standards for interpreta-tion and reporting of sequence variainterpreta-tions: Revisions 2007. Genet. Med.10, 294–300.
48. Richards, S., Aziz, N., Bale, S., Bick, D., Das, S., Gastier-Foster, J., Grody, W.W., Hegde, M., Lyon, E., Spector, E., et al.; ACMG Laboratory Quality Assurance Committee (2015). Standards and guidelines for the interpretation of sequence variants: a joint consensus recommendation of the American College of Medical Genetics and Genomics and the Association for Molecular Pathology. Genet. Med.17, 405–424.
49. Duzkale, H., Shen, J., McLaughlin, H., Alfares, A., Kelly, M.A., Pugh, T.J., Funke, B.H., Rehm, H.L., and Lebo, M.S. (2013). A systematic approach to assessing the clinical significance of genetic variants. Clin. Genet.84, 453–463.
50. Ionita-Laza, I., McCallum, K., Xu, B., and Buxbaum, J.D. (2016). A spectral approach integrating functional genomic annotations for coding and noncoding variants. Nat. Genet. 48, 214–220.
51. DeLong, E.R., DeLong, D.M., and Clarke-Pearson, D.L. (1988). Comparing the areas under two or more correlated receiver operating characteristic curves: a nonparametric approach. Biometrics44, 837–845.
52. Robin, X., Turck, N., Hainard, A., Tiberti, N., Lisacek, F., San-chez, J.C., and Mu¨ller, M. (2011). pROC: an open-source pack-age for R and Sþto analyze and compare ROC curves. BMC Bioinformatics12, 77.
53. Sing, T., Sander, O., Beerenwinkel, N., and Lengauer, T. (2005). ROCR: visualizing classifier performance in R. Bioinformatics 21, 3940–3941.