GWAS for male-pattern baldness identi
fi
es
71 susceptibility loci explaining 38% of the risk
Nicola Pirastu
1
, Peter K. Joshi
1
, Paul S. de Vries
2
, Marilyn C. Cornelis
3
, Paul M. McKeigue
4
, NaNa Keum
5,6
,
Nora Franceschini
7
, Marco Colombo
4
, Edward L. Giovannucci
6,8,9
, Athina Spiliopoulou
4,10
, Lude Franke
11
,
Kari E. North
7
, Peter Kraft
12
, Alanna C. Morrison
2
, Tõnu Esko
13,14
& James F. Wilson
1,15
Male pattern baldness (MPB) or androgenetic alopecia is one of the most common
condi-tions affecting men, reaching a prevalence of ~50% by the age of 50; however, the known
genes explain little of the heritability. Here, we present the results of a genome-wide
asso-ciation study including more than 70,000 men, identifying 71 independently replicated loci, of
which 30 are novel. These loci explain 38% of the risk, suggesting that MPB is less genetically
complex than other complex traits. We show that many of these loci contain genes that are
relevant to the pathology and highlight pathways and functions underlying baldness. Finally,
despite only showing genome-wide genetic correlation with height, pathway-speci
fi
c genetic
correlations are signi
fi
cant for traits including lifespan and cancer. Our study not only greatly
increases the number of MPB loci, illuminating the genetic architecture, but also provides a
new approach to disentangling the shared biological pathways underlying complex diseases.
DOI: 10.1038/s41467-017-01490-8
OPEN
1Centre for Global Health Research, Usher Institute of Population Health Sciences and Informatics, University of Edinburgh, Teviot Place, Edinburgh EH8 9AG,
Scotland.2Human Genetics Center, Department of Epidemiology, Human Genetics and Environmental Sciences, School of Public Health, The University of Texas Health Science Center at Houston, Houston, TX 77030, USA.3Department of Preventive Medicine, Northwestern University Feinberg School of Medicine, Chicago, IL 60611, USA.4Centre for Population Health Sciences, Usher Institute of Population Health Sciences and Informatics, University of Edinburgh, Teviot Place, Edinburgh EH8 9AG, Scotland.5Department of Food Science and Biotechnology, Dongguk University, Goyang, South Korea.
6Department of Nutrition, Harvard T. H. Chan School of Public Health, Boston, MA 02115, USA.7Department of Epidemiology and Carolina Center for
Genome Sciences, University of North Carolina, Chapel Hill, NC 27599, USA.8Department of Epidemiology, Harvard T. H. Chan School of Public Health, Boston, MA 0211, USA.9Channing Division of Network Medicine, Department of Medicine, Brigham and Women’s Hospital and Harvard Medical School, Boston, MA 02115, USA.10Pharmatics Ltd., Edinburgh EH16 4UX, Scotland.11Department of Genetics, University Medical Center, 9713 GZ Gröningen, The Netherlands.12Program in Genetic Epidemiology and Statistical Genetics, Harvard T. H. Chan School of Public Health, Boston, MA 02115, USA.13Estonian
Genome Center, University of Tartu, 51010 Tartu, Estonia.14Broad Institute of Harvard and MIT, Cambridge, MA 02142, USA.15MRC Human Genetics Unit,
Institute of Genetics and Molecular Medicine, University of Edinburgh, Western General Hospital, Crewe Road, Edinburgh EH4 2XU, Scotland. Correspondence and requests for materials should be addressed to N.P. (email:[email protected])
123456789
M
ale pattern baldness (MPB) is a common multifactorial
condition characterised by a progressive thinning of
scalp hair with a very specific pattern. First, the hairline
recedes at the temples (widow
’
s peak) and then a bald patch
develops on the crown, progressing such that eventually only a
horseshoe of hair is left on the sides and back of the head (the
Hippocratic wreath).
MPB co-exists with numerous other important pathologies
such as cardio-metabolic diseases
1and prostate cancer
2,
sug-gesting a common underlying biology, and has negative impacts
on body image and social perceptions
3.
The development of MBP is clearly linked to the response to
androgens although many other pathways, such as
Wnt
and
TGF-beta
, come into play. Despite MPB
’
s high heritability (~80%), after
the
first identification of the
AR/EDA2R
locus on the X
chromo-some
4,5it took several years to identify additional loci, bringing the
overall number to 12
6–8. Recently, a larger study including 20,000
people has greatly increased the number of loci although
inde-pendent replication was not demonstrated
9. Studies investigating
the genetic correlations of MBP with other traits/diseases have been
inconclusive. Despite the identification of several loci associated
with MBP, a number of questions remain unanswered. It is unclear
if multiple SNPs at the same locus substantially contribute to MBP
risk; moreover, although many predisposing loci have been
iden-tified, which genes are actually causal to MPB and which common
pathways they share is not always clear;
finally, despite numerous
described co-morbidities with MPB, the biology responsible for
these correlations remains largely unknown.
In order to shed light on these issues, we performed a large-scale
genome-wide association (GWA) analysis to uncover the genetic
architecture of baldness. We
find 71 significantly associated loci, 30
of which were previously undescribed. These loci account for 38%
of the heritability of MPB, suggesting a relatively low level of
complexity in the genetic architecture. Further, we show that the
identified loci contain genes which are enriched in pathways known
to be important for hair follicle development and growth. Finally,
we reveal that although MBP shows overall genetic correlation only
with height, this changes once the correlations are estimated only
over the enriched pathways, helping to understand the observed
epidemiological results.
Results
Genome-wide association
. The discovery analysis was conducted
using 25,662 MPB cases and 17,928 controls (see
“
Methods
”
for
definition) from UK Biobank (UKB)
10, who self-identified as
British and were also considered genomically British by UKB. All
imputed SNPs on the autosomes and genotyped SNPs on
chro-mosome X were used, for a total of 27,512,692. Discovery GWA
identified 12,192 SNPs significantly (
p
<
5 × 10
−8) associated with
MBP. Replication was sought for significant SNPs using several
independent cohorts: UKB participants of non-British origin, two
prospective cohorts of European Americans (ARIC
11and
HPFS
12) and 23andMe Inc.
13(Supplementary Data
1
describes
each cohort), for a total of 16,824 cases and 14,288 controls. We
replicated 11,624 SNPs at
p
<
0.05, corresponding to 95.3% of the
SNPs identified in discovery (Supplementary Data
2
). SNPs were
then divided into 71 independent loci (as defined in
“
Methods
”
and Table
1
), hereafter referred to using numbers 1
–
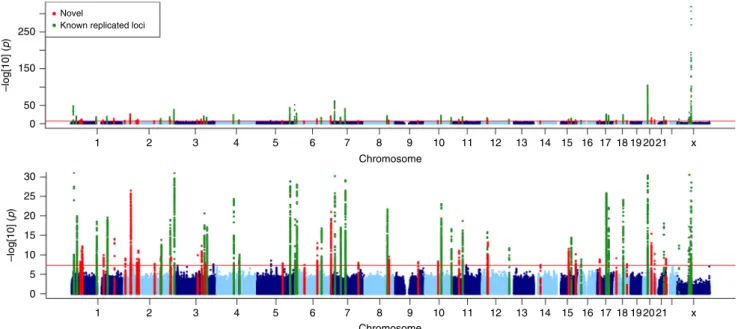
71. Of the 71
loci, 30 were newly identified in this study and 41 loci had
pre-viously been described and replicated in association studies
9,14.
(Fig.
1
; regional Manhattan plots of the associated loci can be seen
in Supplementary Figs.
1
–
71
.)
In order to understand if at each locus the association was due
to a single SNP or if multiple association signals were present, we
conducted GCTA-COJO analysis
15. The 71 loci contain 107
distinct SNPs (Supplementary Data
3
): 22 loci include from 2 up
to 5 distinct associations (Table
1
).
No heterogeneity of effect was detected between the genomically
and non-genomically British sub-cohorts over the 107 SNPs (Fig.
2
;
the comparison of effects for each distinct SNP). Genomic
heritability analysis using 20,000 random unrelated UKB samples
reveals that 94% of variance on the liability scale could be attributed
to genetic variation: 82% of heritability could be attributed to the
autosomes and 12% could be attributed to the X chromosome. Our
107 genome-wide significant SNPs explain 38% of the total
heritability; 32% of the autosomal and 73% of the X chromosome
contributions. MBP is therefore probably one of the most heritable
complex traits
16,17and one for which we can explain a remarkably
large part of heritability with relatively few SNPs compared to other
complex traits
18including autoimmune diseases
19.
Functional annotation of discovered loci
. All distinct SNPs and
their LD proxies were annotated with Haploreg v4.1
20. This set
contains only one coding SNP: rs17265513, a non-synonymous
variant of
ZHX3
. Tissue-specific enhancer enrichment analysis
highlights various tissues (Supplementary Data
4
), the most
sig-nificant of which are mesenchymal stem cell-derived chondrocyte
cultured cells (
p
=
3 × 10
−5) but also foreskin keratinocyte and
melanocyte primary cells (
p
=
1 × 10
−4, 2 × 10
−4). All SNPs with
p
<
1 × 10
−5in the 71 replicated loci were subject to tissue- and
gene-set enrichment with DEPICT 1.1
21. Tissue enrichment
analysis did not yield any results (Supplementary Data
5
),
how-ever gene-set enrichment revealed 202 enriched sets
(Supple-mentary Data
6
), most involving either morphogenesis or
regulation of transcription. All associated loci contain genes
except for two, which are in gene deserts; the total number of
protein coding genes at these loci is 219 (Supplementary Data
7
).
In order to determine if these 219 genes clustered in known
pathways, we ran enrichment analysis using
ConsensusPathDB-human
22,which identified only nine significant enriched
path-ways (Supplementary Data
8
). We thus performed custom
prioritisation (see
“
Methods
”
), which allowed us to select 72
genes in 60 loci (Table
1
and Supplementary Data
9
). Eleven of
the selected genes also encode druggable targets according to
DGIdb 2.0
23(Supplementary Data
10
).
Androgen receptor signalling (see Supplementary Data
11
for
the description of the pathways included in the list) is implicated
by seven genes at six loci. The
AR/EDA2R
locus on chromosome
X shows the strongest association (rs4827528;
p
<
1 × 10
−350; OR,
3.4), and three distinct signals.
SRD5A2
encodes a protein that
converts testosterone to dihydrotestosterone (DHT), with
five
distinct hits near the gene. Additionally, our SNP rs5934505,
located on chromosome X close to
FAM9B
, has also been
associated with testosterone levels
24.
The selected genes were tested for enrichment of known
pathways and gene sets using ConsensusPathDB-human
22. Many
pathways known to affect MBP were enriched, in particular
Wnt
signalling and apoptosis (Supplementary Data
12
). Three
hundred and three gene ontology (GO) terms were significant,
mostly related to the regulation of developmental processes and
morphogenesis (Supplementary Data
13
). In order to identify
possible subgroups of the genes which map to known pathways,
we
first built an adjacency matrix based on the co-membership of
each gene in a specific pathway, then carried out community
detection on this network (see
“
Methods
”
).
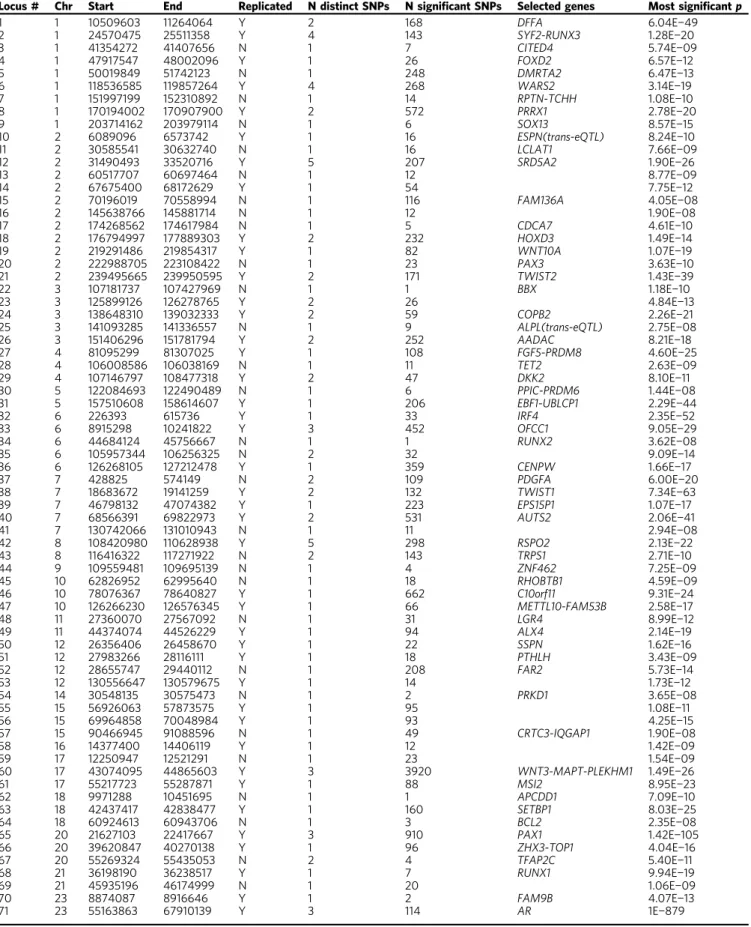
TGF-Table 1 Summary of MPB loci
Locus # Chr Start End Replicated N distinct SNPs N significant SNPs Selected genes Most significantp
1 1 10509603 11264064 Y 2 168 DFFA 6.04E−49
2 1 24570475 25511358 Y 4 143 SYF2-RUNX3 1.28E−20
3 1 41354272 41407656 N 1 7 CITED4 5.74E−09
4 1 47917547 48002096 Y 1 26 FOXD2 6.57E−12
5 1 50019849 51742123 N 1 248 DMRTA2 6.47E−13
6 1 118536585 119857264 Y 4 268 WARS2 3.14E−19
7 1 151997199 152310892 N 1 14 RPTN-TCHH 1.08E−10
8 1 170194002 170907900 Y 2 572 PRRX1 2.78E−20
9 1 203714162 203979114 N 1 6 SOX13 8.57E−15
10 2 6089096 6573742 Y 1 16 ESPN(trans-eQTL) 8.24E−10
11 2 30585541 30632740 N 1 16 LCLAT1 7.66E−09
12 2 31490493 33520716 Y 5 207 SRD5A2 1.90E−26
13 2 60517707 60697464 N 1 12 8.77E−09
14 2 67675400 68172629 Y 1 54 7.75E−12
15 2 70196019 70558994 N 1 116 FAM136A 4.05E−08
16 2 145638766 145881714 N 1 12 1.90E−08
17 2 174268562 174617984 N 1 5 CDCA7 4.61E−10
18 2 176794997 177889303 Y 2 232 HOXD3 1.49E−14
19 2 219291486 219854317 Y 1 82 WNT10A 1.07E−19
20 2 222988705 223108422 N 1 23 PAX3 3.63E−10
21 2 239495665 239950595 Y 2 171 TWIST2 1.43E−39
22 3 107181737 107427969 N 1 1 BBX 1.18E−10
23 3 125899126 126278765 Y 2 26 4.84E−13
24 3 138648310 139032333 Y 2 59 COPB2 2.26E−21
25 3 141093285 141336557 N 1 9 ALPL(trans-eQTL) 2.75E−08
26 3 151406296 151781794 Y 2 252 AADAC 8.21E−18
27 4 81095299 81307025 Y 1 108 FGF5-PRDM8 4.60E−25
28 4 106008586 106038169 N 1 11 TET2 2.63E−09
29 4 107146797 108477318 Y 2 47 DKK2 8.10E−11
30 5 122084693 122490489 N 1 6 PPIC-PRDM6 1.44E−08
31 5 157510608 158614607 Y 1 206 EBF1-UBLCP1 2.29E−44
32 6 226393 615736 Y 1 33 IRF4 2.35E−52
33 6 8915298 10241822 Y 3 452 OFCC1 9.05E−29
34 6 44684124 45756667 N 1 1 RUNX2 3.62E−08
35 6 105957344 106256325 N 2 32 9.09E−14
36 6 126268105 127212478 Y 1 359 CENPW 1.66E−17
37 7 428825 574149 N 2 109 PDGFA 6.00E−20
38 7 18683672 19141259 Y 2 132 TWIST1 7.34E−63
39 7 46798132 47074382 Y 1 223 EPS15P1 1.07E−17
40 7 68566391 69822973 Y 2 531 AUTS2 2.06E−41
41 7 130742066 131010943 N 1 11 2.94E−08
42 8 108420980 110628938 Y 5 298 RSPO2 2.13E−22
43 8 116416322 117271922 N 2 143 TRPS1 2.71E−10
44 9 109559481 109695139 N 1 4 ZNF462 7.25E−09
45 10 62826952 62995640 N 1 18 RHOBTB1 4.59E−09
46 10 78076367 78640827 Y 1 662 C10orf11 9.31E−24
47 10 126266230 126576345 Y 1 66 METTL10-FAM53B 2.58E−17
48 11 27360070 27567092 N 1 31 LGR4 8.99E−12
49 11 44374074 44526229 Y 1 94 ALX4 2.14E−19
50 12 26356406 26458670 Y 1 22 SSPN 1.62E−16
51 12 27983266 28116111 Y 1 18 PTHLH 3.43E−09
52 12 28655747 29440112 N 1 208 FAR2 5.73E−14
53 12 130556647 130579675 Y 1 14 1.73E−12
54 14 30548135 30575473 N 1 2 PRKD1 3.65E−08
55 15 56926063 57873575 Y 1 95 1.08E−11
56 15 69964858 70048984 Y 1 93 4.25E−15
57 15 90466945 91088596 N 1 49 CRTC3-IQGAP1 1.90E−08
58 16 14377400 14406119 Y 1 12 1.42E−09
59 17 12250947 12521291 N 1 23 1.54E−09
60 17 43074095 44865603 Y 3 3920 WNT3-MAPT-PLEKHM1 1.49E−26
61 17 55217723 55287871 Y 1 88 MSI2 8.95E−23
62 18 9971288 10451695 N 1 1 APCDD1 7.09E−10
63 18 42437417 42838477 Y 1 160 SETBP1 8.03E−25
64 18 60924613 60943706 N 1 3 BCL2 2.35E−08
65 20 21627103 22417667 Y 3 910 PAX1 1.42E−105
66 20 39620847 40270138 Y 1 96 ZHX3-TOP1 4.04E−16
67 20 55269324 55435053 N 2 4 TFAP2C 5.40E−11
68 21 36198190 36238517 Y 1 7 RUNX1 9.94E−19
69 21 45935196 46174999 N 1 20 1.06E−09
70 23 8874087 8916646 Y 1 2 FAM9B 4.07E−13
71 23 55163863 67910139 Y 3 114 AR 1E−879
beta
pathways (
RUNX2
,
RUNX3
,
PTHLH
,
ALPL
,
AR
,
RUNX1
,
PDGFA
,
SRD5A2
,
FGF5
and
PAX3
). Supplementary Fig.
1
shows
the membership of each gene in each pathway. Although many
different pathways have been implicated in the development of
MBP
25, our results suggest that in addition to the androgen
receptor pathway, for which we confirm a prominent function,
the
Wnt
and apoptosis pathways play central roles. MPB is
characterised by a shorter growth (anagen) phase, which has been
associated with increased apoptosis
25of the hair follicle cells.
These results suggest that the anagen phase becomes shorter
because of differences in the genes regulating apoptosis. The
Wnt
pathway has been implicated in the transition from the resting
(telogen) phase to the anagen phase
26, and also in the
determination of the fate of the stem cells in the hair bulge
27,
which are both dysregulated in balding tissue.
A second community analysis was conducted based on the
co-membership of the 303-specific GO terms. In this case, only two
groups of genes were detected (Supplementary Data
14
): the
first
characterised by genes enriched in 106 different known pathways
mostly linked to signalling (Supplementary Data
15
), while the
second group featured genes enriched in 12 known pathways
related mostly to apoptosis and development (Supplementary
Data
16
). Both the
“
signalling
”
and
“
other
”
communities were
enriched for GO terms related to the regulation of developmental
processes. Given these results, we used STRING
28to build an
interaction network between the prioritised genes. Thirty-three of
the selected genes were connected in a large network which
included 8 of the 13 genes differentially expressed in balding
dermal papilla cells under DHT stimulation
29. Overlaying the GO
term-based communities with the interaction pathways shows
that the genes in the signalling community (Supplementary
Fig.
2
) are located at the centre of the network and show a high
degree of interconnectivity, suggesting considerable interaction
amongst the different regulatory signalling systems involved in
hair growth. The genes in the other community show less
interconnectivity, consistent with their not being in similar
pathways. These results suggest that while the genes in the
“
signalling
”
community receive the various signals regulating hair
growth, they then interact with those in the
“
other
”
community to
transduce these signals into responses. These results could also be
due to a difference in knowledge between the genes in the two
communities, however when we compare the per-gene number of
associated GO terms in each community, we actually detected a
higher median and mean number of associated terms to the
second community genes (median, 65.5 vs. 40; and mean, 64 vs.
59.1) suggesting that this is not the case for our results.
Locus- and pathway-speci
fi
c pleiotropy
. Pleiotropy analysis
conducted
with
GENOSCORES
(
https://pm2.phs.ed.ac.uk/
genoscores/
) revealed that 14 loci show strong correlation with
previously published GWAS loci including various diseases and
quantitative traits (Supplementary Data
17
). Genetic correlation
analysis using LD-hub
30,31did not yield any results
(Supple-mentary Data
18
); we thus verified the overlap between the
predisposition to baldness and other traits using polygenic risk
scores, PGRS
32. Generally, the genetic overlap between traits is
sought either for a single variant (pleiotropy) or at the
genome-wide level (genetic correlation), however it is plausible that any
genetic overlap is limited to specific pathways and that this
cor-relation is lost in the overall score. We thus tested each of the
enriched pathways and the three pathway-based communities.
Each PGRS was tested against numerous traits on the genomically
British UKB cohort (see
“
Methods
”
for details). Table
2
describes
the SNPs used to create each locus score and which loci were
attributed to each pathway. The overall score was significant only
for height, with higher risk of baldness associated with lower
stature (Fig.
3
; also see Supplementary Data
19
for the significant
results and Supplementary Data
20
full results), indeed seven
individual loci independently show this same effect. For other
traits, associations in different directions cancel out and so the
overall score shows no evidence of an effect. Looking at
pathway-specific scores, we see that predisposition to baldness is associated
with lower male lifespan, when considering only several pathways
linked to
Wnt
signalling, whereas this genetic predisposition is
shared with increased risk of any cancer, when considering only
variants in the apoptosis pathway or community. Although in
both examples, one of the loci in the pathway is significant by
itself, the pathway score was stronger, suggesting the other genes
in the pathway also contribute, with the same direction of effect.
250Novel
Known replicated loci
150
50
0
x
1 2 3 4 5 6 7 8
Chromosome
30
–log[10] (
p
)
25
20
15
10
5
0
1 2 3 4 5 6 7 8 9 10 11 12 13 14 15 16 17 18 19 20 21 x
Chromosome
9 10 11 12 13 14 15 16 17 18 19 20 21
–log[10] (
p
)
Finally, baldness risk loci in the WNT ligand biogenesis and
trafficking and Class B/2 (Secretin family receptors) pathways
were also associated with height, despite none of the individual
loci in these pathways being significant: this suggests a
“
pathway-wide
”
effect. Therefore, baldness shows pathway-specific genetic
correlations, which provide a potential biological basis to
observed epidemiological correlations. Pathway-specific genetic
correlations hold promise in disentangling the shared biological
pathways underpinning complex diseases.
Discussion
In this study, we have identified and replicated numerous new
loci predisposing to MPB which, together with the previously
identified ones, can explain a large proportion of the estimated
heritability. Furthermore, we have shown that for many of them,
multiple distinct SNPs participate in determining MBP risk. We
have also shown that MBP loci contain genes attributable to
specific pathways, some of which predispose to other traits such
as longevity and cancer.
rs201089181 rs7542354 rs16830188 rs11249243 rs9803723 rs2064251 rs16827770 rs61784834 rs10888690 rs10923528 rs12752809 rs111668293 rs200541723 rs12144907 rs11578119 rs138773644 rs78448052 rs6752754 rs844193 rs534855217 rs191212334 rs577845405 rs534591951 rs13021718 rs149801367 rs62146540 rs2706768 rs10928235 rs13405699 rs71421546 rs10930758 rs7349332 rs77177529 rs11684254 rs550618068 rs9846246 rs115182912 rs35892873 rs6788232 rs7642536 rs11714208 rs16863765 rs35255777 rs7680591 rs12509636 rs73837363 rs76067940 rs335145 rs1422798 rs12203592 rs34624408 rs2876167 rs2149150 rs70993471 rs2040432 rs12214131 rs9398803 rs9692245 rs62433864 rs71530654 rs10225279 rs58788673 rs939963 rs4718886 rs9719620 rs182973285 rs16877149 rs77767830 rs79593277 rs530010717 rs59995943 rs998245 rs12686549 rs2807691 rs11593840 rs3781452 rs79811440 rs11037975 rs7974900 rs10843003 rs7976269 rs76972608 rs417054 rs7164914 rs12902958 rs111931356 rs1704529 rs72809171 17_43947866 rs919462 rs572756998 rs17833789 rs29073 rs8085664 rs7226979 rs77410716 rs552649178 rs11087368 rs17265513 rs551865390 rs985546 rs68088846 rs2256843 rs5934505 rs4827528 rs113436165 rs7061504
−1 0 1 2
Effect size
Genomically British Non-genomically British
Compared with the recent GWA study by Heilmann et al.
9describing 63 loci, we were unable to replicate 17 at genome-wide
significance, while the remaining 46 can be summarised into 41 of
ours due to the different locus definition. We were thus able to
discover and replicate 30 novel loci, almost doubling the number
known. The differences in loci discovered are probably partly due to
their focus on early onset MBP and to our much greater sample size,
which gave us an increased power to detect variants of smaller effect.
Recently, Haagenars et al.
33used the same UK Biobank data to
create a prediction score for MBP. As they were making
predic-tions only, they did not seek replication and used LD clumping to
identify separate predictive SNPs. Here, we found that of 287 loci
reported in their work, 3 could not be replicated in our analyses,
18 had
p
values over the significance threshold in our
discovery analysis while the remaining 266 could be summarised
by 106 of the SNPs selected in this study. Finally, they fail to
detect locus 34 on chromosome 6, which contains
RUNX2
.
These differences are probably due to the different phenotype
definition in the two studies and to the different nature of the
study design.
For the majority of the identified loci, it was possible to select a
convincing candidate through the integration of numerous
sources. This is particularly important in order to understand the
underlying biology of MBP and to identify new targets for
therapies. In this regard, the fact that for 11 of the selected genes,
a drug already exists opens several new possibilities for the
treatment of MBP.
One of the most interesting contributions of our work is the
development of a new way to analyse pleiotropy neither at a
genome-wide level nor limited to single loci, but rather looking at
specific pathways using scores estimated over them to elucidate
pleiotropic correlations. This approach is important for two
Table 2 Pathways used to generate pathway polygenic risk scores
Pathway Loci in pathway N SNPs SNP list
Apoptosis 1;32;64 4 rs201089181;rs7542354;rs12203592;rs7226979
Apoptotic signalling pathway 1;32;64 4 rs201089181;rs7542354;rs12203592;rs7226979
Integrated pancreatic cancer pathway 1;37;64;66 6 rs201089181;rs7542354;rs9692245;rs62433864;rs7226979;rs17265513 Apoptosis modulation and signalling 1;54;64 4 rs201089181;rs7542354;rs417054;rs7226979
HIV-1 Nef: Negative effector of Fas and TNF-alpha
1;64 3 rs201089181;rs7542354;rs7226979
Caspase cascade in apoptosis 1;64;66 4 rs201089181;rs7542354;rs7226979;rs17265513 Prostate cancer—Homo sapiens
(human)
12;37;64;71 11 rs534855217;rs191212334;rs577845405;rs534591951;rs13021718; rs9692245;rs62433864;rs7226979;rs4827528;rs113436165;rs7061504 Proteoglycans in cancer—Homo sapiens
(human)
19;21;38;57;60 9 rs7349332;rs11684254;rs550618068;rs71530654;rs10225279; rs111931356;17_43947866;rs919462;rs572756998
ESC pluripotency pathways 19;27;37;60 7 rs7349332;rs7680591;rs9692245;rs62433864;17_43947866;rs919462; rs572756998
Pathways in cancer—Homo sapiens (human)
19;27;37;60;64;68;71 12 rs7349332;rs7680591;rs9692245;rs62433864;17_43947866;rs919462; rs572756998;rs7226979;rs68088846;rs4827528;rs113436165;rs7061504 Class B/2 (Secretin family receptors) 19;51;60 5 rs7349332;rs10843003;17_43947866;rs919462;rs572756998
Wnt signalling pathway 19;54;60 5 rs7349332;rs417054;17_43947866;rs919462;rs572756998 Wnt signalling pathway and
pluripotency
19;54;60 5 rs7349332;rs417054;17_43947866;rs919462;rs572756998
WNT ligand biogenesis and trafficking 19;60 4 rs7349332;17_43947866;rs919462;rs572756998 Wnt signalling in kidney disease 19;60 4 rs7349332;17_43947866;rs919462;rs572756998 DNA damage response (only ATM
dependent)
19;60;64 5 rs7349332;17_43947866;rs919462;rs572756998;rs7226979
Endochondral ossification 2;25;34;51 7 rs16830188;rs11249243;rs9803723;rs2064251;rs11714208;rs70993471; rs10843003
Regulation of nuclear SMAD2/ 3 signalling
2;34;68;71 9 rs16830188;rs11249243;rs9803723;rs2064251;rs70993471;rs68088846; rs4827528;rs113436165;rs7061504
TGF_beta_Receptor 2;34;68;71 9 rs16830188;rs11249243;rs9803723;rs2064251;rs70993471;rs68088846; rs4827528;rs113436165;rs7061504
Transcriptional misregulation in cancer
—Homo sapiens (human)
20;34;37;68 5 rs77177529;rs70993471;rs9692245;rs62433864;rs68088846
Activation of the TFAP2 (AP-2) family of transcription factors
3;67 3 rs16827770;rs551865390;rs985546
White fat cell differentiation 31;32 2 rs1422798;rs12203592 Development of pulmonary dendritic
cells and macrophage subsets
32;34 2 rs12203592;rs70993471
Notch-mediated HES/HEY network 34;38;71 6 rs70993471;rs71530654;rs10225279;rs4827528;rs113436165;rs7061504 Regulation of FZD by ubiquitination 42;48 6 rs182973285;rs16877149;rs77767830;rs79593277;rs530010717;
rs79811440 Regulation of apoptosis by parathyroid
hormone-related protein
51;64 2 rs10843003;rs7226979
Signalling by Wnt 9;19;29;42;48;60 13 rs78448052;rs7349332;rs73837363;rs76067940;rs182973285; rs16877149;rs77767830;rs79593277;rs530010717;
rs79811440;17_43947866;rs919462;rs572756998 TCF-dependent signalling in response to
WNT
9;29;42;48;60 12 rs78448052;rs73837363;rs76067940;rs182973285;rs16877149; rs77767830;rs79593277;rs530010717;rs79811440;17_43947866; rs919462;rs572756998
reasons,
first because it suggests a potential biological mechanism
for observed epidemiological correlations. Pathway-specific
genetic correlations also show that we can use outcomes to
weight the contribution of SNPs to the pathway functionality, thus
creating an instrument to study the effect of specific pathways on
diseases and traits even without genome-wide significance.
We have observed an h
2SNPof 94%, which suggests that MBP is
more a polygenic trait than a complex one, with very little
environmental component. This estimate is in accordance with
previous studies which have estimated dichotomised MBP
her-itability to be 89% for clear-cut vertex balding and 96% for
recessive balding
34. Two recent papers
9,33have estimated h
2SNPto be significantly lower (0.48 and 0.52), however we must
con-sider that in the
first case a different method of converting the
explained phenotypic variance from the observed scale to the
liability one was used instead of the one implemented in GCTA
while in the other rather dubious baldness cases were included
(group 2 on the scale used in the UKB study), which may explain
the difference.
In conclusion, we show baldness to be one of the most heritable
complex traits, for which we are able to explain nearly two
fifths
of the heritability with only 71 loci. Recurring themes in complex
trait genetics are highlighted, including multiple distinct signals in
many loci, aggregation of genetic effects in pathways important to
the trait and widespread pleiotropy with other traits and diseases;
but we also emphasise pathway-specific genetic correlations as a
new approach to dissect the genetics and biology of complex
diseases.
Methods
Study approval. All subjects gave written informed consent. UK Biobank has approval from the North West Multi-centre Research Ethics Committee (MREC), In Scotland, UK Biobank has approval from the Community Health Index Advi-sory Group (CHIAG). ARIC has approval from the ARIC Publications Committee and the ARIC Coordinating Center. The HPFS was approved by the IRB of the Harvard School of Public Health.
Phenotype definition and cohort description. In UK Biobank samples, the degree of baldness was defined as part of a self-administered questionnaire. Each male participant was asked to recognise his hair/balding pattern comparing with four different pictures. Thefirst would correspond to no sign of baldness, the second to a II–IIIa grade on the Norwood–Hamilton35scale, the third to a IIIv–IV grade and the fourth to a V+ grade. To be certain of using people actually affected by MPB, we used as cases people who self-identified themselves as being in the third or fourth group while as controls people in thefirst category. Given that people in UK Biobank have been selected to be of ages between 40 and 69, by when baldness is fully developed, no agefilter was applied. Genotypes both measured and imputed were obtained from UK Biobank and no further QC was applied. Details can be found athttp://www.ukbiobank.ac.uk/wp-content/uploads/2014/04/
UKBiobank_genotyping_QC_documentation-web.pdfandhttp://www.ukbiobank. ac.uk/wp-content/uploads/2014/04/imputation_documentation_May2015.pdf.
Health Professionals Follow-up Study (HPFS) is an on-going prospective analysis of male US health professionals, information on hair pattern at age 45 was collected by self-administered questionnaires during the 1992 follow-up36. Participants were
asked to select their hair pattern at age 45 fromfive images (no baldness, frontal-only baldness, frontal-plus-mild-vertex baldness, frontal-plus-moderate-vertex baldness and frontal-plus severe vertex baldness) modified from the Hamilton–Norwood scale35Cases were defined as experiencing frontal and (any) vertex baldness at age 45,
which corresponds to at least a IV grade on the Hamilton–Norwood scale. Controls were defined as those experiencing no baldness at age 45.
The Atherosclerosis Risk in Communities Study (ARIC) is a prospective population-based cohort study of individuals from four US communities11.
Class B/2 (Secretin family receptors) WNT ligand biogenesis and trafficking DNA damage response (only ATM dependent)
z-score 10 5 0 –5 –10 Locus 19
Proteoglycans in cancer - Homo sapiens (human) Wnt signaling pathway
Locus 27 Locus 32 Apoptosis
Development of pulmonary dendritic cells and macrophage subsets White fat cell differentiation
Locus 21 Locus 23 Locus 60 Locus 31 Locus 14 Locus 48 Locus 66 Locus 70 Locus 62 Overall PGRS Locus 58 Locus 38
Integrated pancreatic cancer pathway Locus 57 3.56 F a ther’ s mor tality 40–75 F a ther’ s mor tality Cancer BMI F a ther h y per tension Mother h y per tension Mother’ s Alzheimer F a ther’ s Alzheimer Age menarche Fa t % We ig h t Height Psor iasis Smoking 3.46 3.55 3.71 4.42 4.19 4.19 3.81 4.19 3.62 3.89 3.98 4.3 4.38 3.62 3.71 4.51 3.84 3.64 –3.47 –3.64 –3.83 3.8 4.51 4.02 –4.05 –5.07 3.83 3.58 3.77 –5.79 –3.79 –4.34 –4.55 –6.69 –7.6 –11.42 –13.44 –6.15 5.97 3.7 –5.1 Locus 6 Locus 56 Locus 36 Locus 25
Baseline examinations took place from 1987 to 1989. During the fourth visit (1996–1998), baldness pattern was classified according to the Hamilton baldness scale, as modified by Norwood35. A trained technician in each clinic observed the
participant’s head from two angles (side and top), compared the natural hair pattern with a series of 12figures, and chose the best matchingfigure. Thesefigures corresponded to categories on the Hamilton baldness scale (I, II, IIa, III, IIIa, IIIva, III vertex, IV, V, Va, VI, VII). A score of 13 was recorded for complete baldness. More details about these measurements have been previously described37. Cases were defined as individual with grade III or higher, whereas controls were defined as individuals with grade I. Given that the participants of the ARIC study were all between 53 and 74 years old, no agefilter was applied. We restricted our analysis to European-American men.
23andMe data were obtained from research participants of 23andMe, Inc.9who
provided informed consent and participated in research online, under a protocol approved by the external AAHRPP-accredited IRB, Ethical & Independent Review Services. Participants provided responses to the“Hair Loss in Men and Women” survey. Only responses from male research participants were included. Survey questions included the following:“Please choose the image that best captures your hair’s pattern and density. If your head is shaved, please answer for how your hair looks when grown out. If none of these images are similar to your hair’s pattern and density, choose none of the above.”(images a to s, corresponding to Hamilton scale); “Have you experienced hair loss or thinning?”(Yes, No, I’m not sure, Decline to state);“How old were you when youfirst started to notice hair loss?”(under age 18, 18–24, 25–29, 30–34, 35–39, 40–44, 45–49, 50–54, 55–59, 60–64, 65–69, 70–74, 75–79, 80 years or older, I’m not sure.) Cases reported having experienced hair loss or thinning, with onset before age 40, and current hair loss of Hamilton grade III or higher. Controls are at least 30 years old, and report not having experienced hair loss or thinning, and at most Hamilton grade I, or if age 50 or older, Hamilton grade II.
Discovery association analysis on UK Biobank samples. Case–control associa-tion analysis on UK Biobank genomically British samples was conducted in two steps. First genome-wide association using linear regression (which is equivalent to running the trend test) was conducted using RegScan38on all 27,512,692 imputed
SNPs, which had a minor allele count of at least 100 using the following model:
male pattern baldnessageþpc:0þpc:1þpc:2 þ¼ þpc:10þarray batchþgenotype:
For chromosome X, given the unavailability of imputed SNPs, genotypes were used. All SNPs withp<1 × 10⁻⁵were extracted from the original bgenfiles using bgenix (http://www.well.ox.ac.uk/~gav/bgen_format/) and analysed using logistic regression using the same covariates as in thefirst step. For this step, SNPtest v2.5.239was used. The two-step approach was used in order to make the analysis time tractable since available software would have taken months to run the logistic regression analysis even on a large computing cluster.
Potentialpvalue inflation was checked using genomic control and LD regression: λGC1.15, LD regression intercept 1.0451. The difference in value indicates that the
inflation measured by genomic control is due to the GWA and not to stratification.
Replication association analysis. Replication association analysis was performed using four different cohorts: samples self-defining as British but genomically non-British from UK Biobank, HPFS and ARIC. Additionally, data from the recent MBP GWAS13was obtained from 23andMe. The association analyses in the replication cohorts were limited to only the 12,192 SNPs significant at the discovery step. After association analysis in each cohort, results were meta-analysed using the inverse variance approach as implemented in METAL40. Given the large sample size, nofilter on MAF or imputation quality was applied. For UK Biobank non-genomically British samples, case–control association analysis was performed using SNPtest v2.5.239. Logistic regression was performed assuming an additive model for the allelic effect using the model:
male pattern baldnessageþpc:1þpc:2þ¼ þpc:10þarray batchþgenotype
In order to verify if PCs were able to correct for the population structure, we used two different methods applied to the association GWA analysis: genomic control and LD regression. Both methods showed no evidence of test statistic inflation (λGC1.02, LD regression intercept 1.0021). Finally, in order to verify
possible heterogeneity of effect between the two UK Biobank cohorts, we compared effect sizes for the 107 detected distinct SNPs. Figure1shows the forest plot for these SNPs for the two UK Biobank populations. No sign of heterogeneity was detected. A total of 3436 cases and 2435 controls were used for this analysis.
For HPFS, men contributing to the current genetic analysis were those previously selected for independent GWAS in nested case–control studies initially designed for a variety of chronic diseases, including type 2 diabetes, coronary heart disease, kidney stone disease, glaucoma, gout, prostate, pancreatic and colon cancer. To allow for maximum efficiency and power, we pooled samples genotyped on the same platforms, which resulted in three data sets herein referred to as HPFS-Affy, HPFS-Illumina and HPFS-Omni (Supplementary Data1). Detailed methods
and quality assurance pertaining to these genetic data sets have been reported elsewhere (Lindstrom, S. et al. A comprehensive survey of genetic variation in 20,691 subjects from four large cohorts; submitted). Any samples that had substantial (more than one quarter of the distance between the European and non-European centroids on PCA) genetic similarity to non-non-European reference samples were excluded. Each genetic data set was examined separately and the results were combined in the overall meta-analysis of replication studies. We performed logistic regression assuming an additive genetic model, adjusting for age, initial case–control data set and four principal components of population substructure. A total of 1984 cases and 2857 were used for these analyses. Association analysis was performed only on SNPs required for replication.
ARIC case–control association analysis was performed using logistic regression as implemented by ProbABEL41. Additive allelic effects were modelled using the model:
male pattern baldnessageþpc:1þpc:2þ¼ þpc:10þgenotype
A total of 2374 cases and 503 controls were used for the analysis. Association analysis was performed only on SNPs required for replication.
On 23andMe data, logistic regression was performed assuming an additive model for allelic effects, using the model:
male pattern baldness ageþpc:0þpc:1þpc:2þpc:3þpc:4þgenotype
This GWA analysis includes data from 9009 cases and 8491 controls of European ancestry,filtered to remove close relatives. Details on sample selection can be found in Pickrell at al.13. The results were provided adjusted for a genomic control inflation factorλ=1.065. The equivalent inflation factor for 1000 cases and 1000 controlsλ1000=1.007, and for 10,000,λ10,000=1.074.
Identification of SNPs distinctly associated with MPB and division into loci. SNPs distinctly associated with the phenotype were estimated using GCTA-COJO15. Briefly, this method is comparable to doing a stepwise conditioned regression analysis. The advantage of this approach is that it does not require rerunning of the association analysis, rather it uses the summary statistics from the GWAS and the LD matrix between the SNPs. As a reference panel, we used the genotypes of all the 56,937 genomically British women genotyped in UK Biobank. This choice was due to the attempt to run the analysis also on the X chromosome as if it were an autosome.
Since this last attempt was unsuccessful, direct stepwise conditional analysis was conducted on the X chromosome using PLINK. Briefly, association analysis was rerun limited to the significant SNPs on the whole X chromosome from the discovery step including the top-associated SNP in each of the two loci as covariates. If any genome-wide significant SNP remained in the conditional analysis, the top SNP was included as an additional covariate and association analysis rerun. This procedure was repeated until no other significant SNPs were found. We identified no additional SNPs at locus 70 while 3 distinct SNPs were detected at locus 71.
All replicated SNPs were then divided into loci. To define a locus, wefirst selected all SNPs withpvalue<1 × 10⁻⁵and then estimated the distance between
each consecutive SNP located on the same chromosome. Two consecutive SNPs were defined to belong to different loci if they were more than 500 kb apart. We considered as independent loci only those which contained at least one distinct SNP. For this reason, two loci on chromosome X were merged with theAR/EDA2Rlocus.
Annotation of the distinct SNPs. Epigenetic signatures were estimated using Haploreg 4.120. As input, we used the 107 distinctly associated SNPs adding to them only those SNPs which were in complete linkage disequilibrium with them, reasoning that they were as good candidates as those selected with the GCTA-COJO analysis. To identify the genes present in each locus, we used DEPICT 1.1 beta21which is suitable for use with 1000G phase 3 SNPs. As reference population for the LD pattern, we used the genotypes from all the genomically British women in UK Biobank. Given that, we used DEPICT only to understand which genes were present in each locus and not to run enrichment analysis, as input we used all SNPs which were in the previously defined loci and with apvalue<1 × 10⁻⁵.
Heritability estimation. Heritability was estimated on 20,000 unrelated samples from the discovery cohort using GCTA. Two separate kinship matrices were estimated from SNP array genotype data: one for the autosomes and the other one for chromosome X. We then calculated the heritability explained by each of these matrices using the GCTA-GREML42method using the observed prevalence (0.59)
to transform the results from the observed to the liability scale. In order to verify how much variance was explained by the identified SNPs, we added the estimated polygenic risk score as afixed effect in the GREML and measured the decrease in the proportion of variance due to the relationship matrices.
gene list through the ConsensusPathDB-human22enrichment software. Nine genes in different loci were annotated as being associated with hair follicle development (GO:0001942) and hair cycle processes (GO:0022405). As a third criterion, we verified if any of the genes in our loci showed significantly different expression patterns between balding and non-balding dermal papilla cell lines at baseline and after sti-mulation with DHT (the active form of testosterone)29(Supplementary Data21). This
analysis revealed 23 differentially expressed genes in 19 loci, 10 at baseline and 13 after stimulation with DHT. As fourth criterion, we used GeneNetwork (http:// 129.125.135.180:8080/GeneNetwork/) to assess if any of the candidate genes were predicted to be associated with hair cycle or growth. Sixteen additional genes not previously selected were predicted to be related to hair cycle. Fifth, we evaluated the presence of eQTL, which could be explained by the selected SNPs or those in strong LD with them using various approaches: HaploReg v4.120, the GENOSCORES
platform (see below) and eQTL analysis in peripheral blood. For this last analysis, we used cis-eQTL data from a total of 2360 unrelated individuals obtained from three data sets with gene expression data measured from whole peripheral blood (1240 individuals from Fehrmann-HT12v3, 229 individuals from Fehrmann-H8v243and
891 individuals from the EGCUT study44as described. In summary, quality con-trolled genotype data was imputed using the 1000 Genomes Phase 3 (March 2013 version) cosmopolitan reference panel45and imputation dosage values were used for
analysis. A more detailed overview of the quality control has been published else-where18. To detect cis-eQTLs, we assessed only those combinations of SNPs and probes where the distance between SNP and the midpoint of the probe was smaller than 1 megabase (Mb). Individual data sets were meta-analysed using a Z-score method, weighted for the sample size of each data set. The sample labels were per-muted (repeated 100 times) in order to obtain thepvalue distribution used to control the FDR at 5%. Since SNPs can be highly correlated due to LD, cis-eQTL effects are often caused by SNPs in high LD with the disease-associated query SNP. In order to determine whether our disease-associated SNPs have independent cis-eQTL effects with respect to other SNPs in their locus, we performed conditional analysis. Using the procedure described above, wefirst determined which SNPs show the strongest cis-eQTL (eSNP) effect for each of the probes associated with the 107 disease-associated SNPs (gSNP). Then, we adjusted the gene expression data for these effects using linear regression, and repeated the cis-eQTL analysis on the disease-associated SNPs (and vice versa). This analysis allowed us to identify disease-associated variants that were also the best cis-eQTL SNPs. For the remaining loci, genes were assigned based on the DEPICT gene prioritisation only for those with FDR<0.05. Supple-mentary Data13summarises for each gene which criteria were met. Druggable genes were annotated using DGI 2.023.
Pleiotropy with previous GWAS. Pleiotropy with previous GWAS was estimated using the GENOSCORES platform (https://pm2.phs.ed.ac.uk/genoscores/). Briefly, summary results of the GWAS were used to compute genotypic scores for each hit region in the 2432 individuals comprising the UK10K reference panel. These gen-otypic scores were merged with a table of gengen-otypic scores computed on the same reference panel using a comprehensive database of publicly available GWAS sum-mary statistics for diseases and quantitative traits including gene transcript levels. SNPs werefiltered at apvalue of 1 × 10⁻⁶. Each genotypic score was computed as a sum of genotypes (scored as 0, 1, 2 copies of the reference allele) weighted by the effect size estimate (log odds ratio for baldness and other binary traits, regression slope for quantitative traits). For all traits except gene transcript levels, genotypic scores were computed separately for each trait-associated region. For each trait, trait-associated regions were assigned for each genomic region containing at least one SNP withpvalue<1 × 10⁻⁷. The boundaries of this region were defined by the positions at which there was a gap of at least one megabase from any other SNPs withpvalue<1 × 10⁻⁶. This procedure yielded 74 regional genotypic scores for
baldness, of which 15 were correlated (squared correlation at least 0.5) with at least one other score for another trait. For each block of traits correlated with one of the regional genotypic scores for baldness, the correlations were plotted in a heat map. Results from this analysis were kept only for the 71 significant replicated loci.
Enrichment analysis of selected genes. Enrichment analysis was conducted limited to the selected genes using ConsensusPathDB-human22. After obtaining the list of enriched pathways and GO terms, wefirst built an adjacency matrix based on the co-membership of the genes to known pathways. We then used the Luvain46
method as implemented in the igraph R package to identify subgroups of genes which clustered together (pathway communities). The characteristic that described each community was determined by visually examining how the genes in each community related to the enriched known pathway. We used the same approach using as input the 303-enriched GO terms and then using the Louvain method to identify communities of genes highly interconnected with each other. Given the complexity of the resulting network, it was impossible to assign a significance to each group through visual inspection of the gene-term graph. We thus ran enrichment analysis on each set of genes separately for each identified community. The interaction network resulting from the prioritised genes was created using STRING28, allowing only for direct interactions.
Polygenic risk score estimation. We created two sets of polygenic risk scores plus an overall PGRS comprising all 107 SNPs. Before creating the scores, the betas for
each SNP were re-estimated running logistic regression on all SNPs at the same time using as covariates age and 10 PCs. Genotypes for each SNP were weighted by their beta (dosage × beta). The score at each locus was defined as the sum of all the weighted“distinct”SNPs belonging to the locus: in this way, we obtained 71 locus scores. The overall PGRS was obtained by summing all the locus scores. We then estimated a PGRS for each of the enriched pathways by adding all the locus scores for the loci, which contained the genes in the pathway.“Apoptosis”was merged with“apoptotic signalling pathway”,“Wnt signalling pathway”was merged with “Wnt signalling pathway and pluripotency”and“WNT ligand biogenesis and trafficking”with“Wnt signalling in kidney disease”since in all cases the scores were composed of the same loci and were thus identical. We thus obtained 25 further pathway PGRS. Table2describes the SNPs used to create each locus score and which loci were attributed to each pathway.
Association of scores with traits in UK Biobank. Each polygenic risk score was tested for association with trait using a regression model, with age, sex, genotyping array batch, Townsend deprivation index (a measure of socio-economic status) and thefirst 15 principal components of the genomic relationship matrix as covariates. Where parental traits were tested, maternal and paternal traits were considered separately. In total, 96 traits were selected for testing for a total of 4320 tests. Storey’sqvalues were used for assessing significance considering multiple testing. Binary traits of participants were tested using logistic regression. The traits tested were smoker, ever smoked and attended college. Disease traits in participants were tested using logistic regression. The traits tested were cancer diagnosis, suffered stroke, suffered depression, diabetic, female reproductive problems, suffered bone fracture, heart disease, multiple sclerosis, peripheral artery disease, psoriasis, renal problems and respiratory problems. Disease traits in parents were tested using logistic regression. The traits tested were Alzheimer’s disease, bowel cancer, breast cancer, chronic obstructive pulmonary disease, diabetic, heart disease, hyperten-sion, lung cancer, Parkinson’s disease, stroke and prostate cancer. Survival traits of parents were tested using a Cox model with age as the time of survival and alive/ dead as status. The trait tested was age.
Quantitative traits in participants were tested using linear regression. The traits tested were educational attainment, height, weight, BMI, body fat %, age at menarche and age at menopause.
Data availability. All data that support thefindings of this study are available from the corresponding author on reasonable request with the exception of results from 23andMe. To request access to the 23andMe summary statistics, please email apply. [email protected].
Received: 2 December 2016 Accepted: 21 September 2017
References
1. Trieu, N. & Eslick, G. D. Alopecia and its association with coronary heart disease and cardiovascular risk factors: a meta-analysis.Int. J. Cardiol.176, 687–95 (2014).
2. Zhou, C. K. et al. Male pattern baldness in relation to prostate cancer-specific mortality: a prospective analysis in the NHANES I epidemiologic follow-up study.Am. J. Epidemiol.183, 210–7 (2016).
3. Alfonso, M., Richter-Appelt, H., Tosti, A., Viera, M. S. & García, M. The psychosocial impact of hair loss among men: a multinational European study.
Curr. Med. Res. Opin.21, 1829–36 (2005).
4. Hillmer, A. M. et al. Genetic variation in the human androgen receptor gene is the major determinant of common early-onset androgenetic alopecia.Am. J. Hum. Genet.77, 140–148 (2005).
5. Prodi, D. A. et al. EDA2R is associated with androgenetic alopecia.J. Invest. Dermatol.128, 2268–70 (2008).
6. Heilmann, S. et al. Androgenetic alopecia: identification of four genetic risk loci and evidence for the contribution of WNT signaling to its etiology.J. Invest. Dermatol.133, 1489–96 (2013).
7. Li, R. et al. Six novel susceptibility loci for early-onset androgenetic alopecia and their unexpected association with common diseases.PLoS Genet.8, e1002746 (2012).
8. Hillmer, A. M. et al. Susceptibility variants for male-pattern baldness on chromosome 20p11.Nat. Genet.40, 1279–1281 (2008).
9. Heilmann-Heimbach, S. et al. Meta-analysis identifies novel risk loci and yields systematic insights into the biology of male-pattern baldness.Nat. Commun.8, 14694 (2017).
10. Sudlow, C. et al. UK Biobank: an open access resource for identifying the causes of a wide range of complex diseases of middle and old age.PLoS Med.12, e1001779 (2015).
12. Grobbee, D. E. et al. Coffee, caffeine, and cardiovascular disease in men.N. Engl. J. Med.323, 1026–32 (1990).
13. Pickrell, J. K. et al. Detection and interpretation of shared genetic influences on 42 human traits.Nat. Genet.48, 709–17 (2016).
14. Liu, F. et al. Prediction of male-pattern baldness from genotypes.Eur. J. Hum. Genet.24, 895–902 (2016).
15. Yang, J. et al. Conditional and joint multiple-SNP analysis of GWAS summary statistics identifies additional variants influencing complex traits.Nat. Genet. 44, 369–75, S1-3 (2012).
16. Muñoz, M. et al. Evaluating the contribution of genetics and familial shared environment to common disease using the UK Biobank.Nat. Genet.48, 980–983 (2016).
17. Li, Y. R. et al. Genetic sharing and heritability of paediatric age of onset autoimmune diseases.Nat. Commun.6, 8442 (2015).
18. Wood, A. R. et al. Defining the role of common variation in the genomic and biological architecture of adult human height.Nat. Genet.46, 1173–86 (2014). 19. Ellinghaus, D. et al. Analysis offive chronic inflammatory diseases identifies 27 new associations and highlights disease-specific patterns at shared loci.Nat. Genet.48, 510–8 (2016).
20. Ward, L. D. & Kellis, M. HaploRegv4: systematic mining of putative causal variants, cell types, regulators and target genes for human complex traits and disease.Nucleic Acids Res.44, D877–81 (2016).
21. Pers, T. H. et al. Biological interpretation of genome-wide association studies using predicted gene functions.Nat. Commun.6, 5890 (2015).
22. Herwig, R., Hardt, C., Lienhard, M. & Kamburov, A. Analyzing and interpreting genome data at the network level with ConsensusPathDB.Nat. Protoc.11, 1889–907 (2016).
23. Wagner, A. H. et al. DGIdb 2.0: mining clinically relevant drug-gene interactions.Nucleic Acids Res.44, D1036–44 (2016).
24. Ohlsson, C. et al. Genetic determinants of serum testosterone concentrations in
men.PLoS Genet.7, e1002313 (2011).
25. Cranwell, W. & Sinclair, R. inEndotext(eds De Groot, L. J. et al.) (MDText. com, Inc., South Dartmouth, MA, 2000).
26. Myung, P. S., Takeo, M., Ito, M. & Atit, R. P. Epithelial Wnt ligand secretion is required for adult hair follicle growth and regeneration.J. Invest. Dermatol. 133, 31–41 (2013).
27. Huelsken, J., Vogel, R., Erdmann, B., Cotsarelis, G. & Birchmeier, W.β-Catenin controls hair follicle morphogenesis and stem cell differentiation in the skin.
Cell105, 533–545 (2001).
28. Szklarczyk, D. et al. STRINGv10: protein-protein interaction networks, integrated over the tree of life.Nucleic Acids Res.43, D447–52 (2015). 29. Chew, E. G. Y. et al. Differential expression between human dermal papilla cells
from balding and non-balding scalps reveals new candidate genes for androgenetic alopecia.J. Invest. Dermatol.136, 1559–67 (2016).
30. Zheng, J. et al. LD Hub: a centralized database and web interface to perform LD score regression that maximizes the potential of summary level GWAS data for SNP heritability and genetic correlation analysis.Bioinformaticshttps://doi.org/ 10.1093/bioinformatics/btw613(2016)
31. Bulik-Sullivan, B. et al. An atlas of genetic correlations across human diseases and traits.Nat. Genet.47, 1236–1241 (2015).
32. International Schizophrenia Consortium. Common polygenic variation contributes to risk of schizophrenia and bipolar disorder.Nature460, 748–52 (2009). 33. Hagenaars, S. P. et al. Genetic prediction of male pattern baldness.PLOS Genet.
13, e1006594 (2017).
34. Heath, A. C., Nyholt, D. R., Gillespie, N. A. & Martin, N. G. Genetic basis of male pattern baldness.J. Invest. Dermatol.121, 1561–1564 (2003).
35. Norwood, O. T. Male pattern baldness: classification and incidence.South. Med. J.68, 1359–65 (1975).
36. Keum, N. et al. Male pattern baldness and risk of colorectal neoplasia.Br. J. Cancer114, 110–7 (2016).
37. Shahar, E., Heiss, G., Rosamond, W. D. & Szklo, M. Baldness and myocardial infarction in men: the atherosclerosis risk in communities study.Am. J. Epidemiol.167, 676–83 (2008).
38. Haller, T., Kals, M., Esko, T., Mägi, R. & Fischer, K. RegScan: a GWAS tool for quick estimation of allele effects on continuous traits and their combinations.
Brief. Bioinform.16, 39–44 (2015).
39. Marchini, J. & Howie, B. Genotype imputation for genome-wide association studies.Nat. Rev. Genet.11, 499–511 (2010).
40. Willer, C. J., Li, Y. & Abecasis, G. R. METAL: fast and efficient meta-analysis of genomewide association scans.Bioinformatics26, 2190–1 (2010).
41. Aulchenko, Y. S., Struchalin, M. V. & van Duijn, C. M. ProbABEL package for genome-wide association analysis of imputed data.BMC Bioinformatics11, 134 (2010).
42. Lee, S. H., Wray, N. R., Goddard, M. E. & Visscher, P. M. Estimating missing heritability for disease from genome-wide association studies.Am. J. Hum. Genet.88, 294–305 (2011).
43. Fehrmann, R. S. N. et al. Trans-eQTLs reveal that independent genetic variants associated with a complex phenotype converge on intermediate genes, with a major role for the HLA.PLoS Genet.7, e1002197 (2011).
44. Nelis, M. et al. Genetic structure of Europeans: a view from the North-East.
PLoS ONE4, e5472 (2009).
45. Abecasis, G. R. et al. An integrated map of genetic variation from 1,092 human genomes.Nature491, 56–65 (2012).
46. Blondel, V. D., Guillaume, J.-L., Lambiotte, R. & Lefebvre, E. Fast unfolding of communities in large networks.J. Stat. Mech. https://doi.org/10.1088/1742-5468/2008/10/P10008(2008).
Acknowledgements
This research has been conducted using the UK Biobank Resource under Application Number 8304. We acknowledge funding from the Medical Research Council Human Genetics Unit. We thank the 23andMe research participants and employees for their contributions to this study. We thank the following members of the 23andMe Research Team: Michelle Agee, Babak Alipanahi, Adam Auton, Robert K. Bell, Katarzyna Bryc, Sarah L. Elson, Pierre Fontanillas, Nicholas A. Furlotte, David A. Hinds, Bethann S. Hromatka, Karen E. Huber, Aaron Kleinman, Nadia K. Litterman, Matthew H. McIntyre, Joanna L. Mountain, Elizabeth S. Noblin, Carrie A.M. Northover, Steven J.
Pitts, J. Fah Sathirapongsasuti, Olga V. Sazonova, Janie F. Shelton, Suyash Shringarpure, Chao Tian, Joyce Y. Tung, Vladimir Vacic, and Catherine H. Wilson. The ARIC is carried out as a collaborative study supported by National Heart, Lung, and Blood Institute contracts (HHSN268201100005C, HHSN268201100006C, HHSN268201100007C, HHSN268201100008C, HHSN268201100009C, HHSN268201100010C,
HHSN268201100011C and HHSN268201100012C), R01HL087641, R01HL59367 and R01HL086694; National Human Genome Research Institute contract U01HG004402; and National Institutes of Health contract HHSN268200625226C. The authors thank the staff and participants of the ARIC study for their important contributions. Infrastructure was partly supported by Grant Number UL1RR025005, a component of the National Institutes of Health and NIH Roadmap for Medical Research. The HPFS is supported by the National Cancer Institute (UM1 CA167552), the National Institute of Diabetes and Digestive and Kidney Diseases (NIDDK, R01DK058845) and the National Heart, Lung, and Blood Institute (NHLBI, R01HL35464), with additional support for the collection and manage-ment of genetic data. The HPFS type 2 diabetes (T2D, dbGaP:phs000091.v2.p1) and open-angle glaucoma (GA, dbGaP:phs000308.v1.p1) GWAS were funded as part of the Gene Environment-Association Studies (GENEVA) project under the NIH Genes, Environment, and Health Initiative (T2D: U01HG004399, GA: U01HG004728). Genotyping for the HPFS coronary heart disease GWAS was supported by Merck/Rosetta Research Laboratories, North Wales, PA. The HPFS kidney stone GWAS (dbGaP:phs000460.v1.p1) was supported by NIDDK (5P01DK070756). The HPFS colon cancer GWAS was funded as part of the Colorectal Cancer GWAS Consortium supported by the NCI (U01CA137088 and R01CA059045). T.E. was supported by Estonian Research Council Grant IUT20-60.
Author contributions
N.P. and J.F.W. wrote the manuscript. N.P., P.K.J., T.E., P.M.M., P.S.d.V. and M.C.C. per-formed the statistical analyses. A.C.M., N.K., N.F., M.C., E.L.D., A.S., L.F., K.E.N. and P.K. contributed data, tools, resources and funding. All authors critically reviewed the manuscript.
Additional information
Supplementary Informationaccompanies this paper at https://doi.org/10.1038/s41467-017-01490-8.
Competing interests:The authors declare no competingfinancial interests.
Reprints and permissioninformation is available online athttp://npg.nature.com/ reprintsandpermissions/
Publisher's note:Springer Nature remains neutral with regard to jurisdictional claims in published maps and institutional affiliations.
Open Access This article is licensed under a Creative Commons Attribution 4.0 International License, which permits use, sharing, adaptation, distribution and reproduction in any medium or format, as long as you give appropriate credit to the original author(s) and the source, provide a link to the Creative Commons license, and indicate if changes were made. The images or other third party material in this article are included in the article’s Creative Commons license, unless indicated otherwise in a credit line to the material. If material is not included in the article’s Creative Commons license and your intended use is not permitted by statutory regulation or exceeds the permitted use, you will need to obtain permission directly from the copyright holder. To view a copy of this license, visithttp://creativecommons.org/ licenses/by/4.0/.