Gene Expression Elucidates Functional Impact of Polygenic Risk
for Schizophrenia
Users may view, print, copy, and download text and data-mine the content in such documents, for the purposes of academic research, subject always to the full Conditions of use:http://www.nature.com/authors/editorial_policies/license.html#terms
CONTACT INFORMATION: Correspondence: [email protected]. 29These authors contributed equally to this work
30These authors jointly directed the work AUTHOR CONTRIBUTIONS:
P Roussos, J Johnson, K Talbot, R Gur, C Hahn, D Lewis, V Haroutunian, B Lipska and J Buxbaum contributed to sample collection. S Hemby contributed monkey brain tissue, P Sullivan contributed mouse data.
M Fromer, P Roussos, S Sieberts, D Kavanagh, T Perumal, D Ruderfer, K Dang, E Oh, A Topol, T Chess, M Peters, E Domenici, B Devlin and P Sklar contributed to the writing of this manuscript.
M Fromer, P Roussos, S Sieberts, H Shah, D Ruderfer, K Dang, M Mahajan, J Dudley, A Chess, S Purcell, L Shinobu, L Mangravite, H Toyoshiba, D Lewis, M Peters, J Buxbaum, E Schadt, K Hirai, K Brennand, N Katsanis, B Devlin and P Sklar contributed to experimental and study design and planning analytical strategies.
L Shinobu, H Toyoshiba, D Lewis, B Lipska, J Buxbaum, E Schadt, K Hirai, E Domenici, B Devlin and P Sklar contributed the funding of this work.
M Fromer, P Roussos, S Sieberts, J Johnson, D Kavanagh, T Perumal, D Ruderfer, H Shah, L Klei, R Kramer, D Pinto, Z Gumus, A Chess, K Dang, A Browne, C Lu, B Readhead, E Stahl, T Hamamsy, J Fullard, Y Wang, J Derry, B Logsdon, T Raj, J Zhu, B Zhang, P Sullivan, S Purcell, E Schadt, E Domenici, B Devlin and P Sklar contributed to data analyses.
E Oh, A Topol, M Parvizi, K Brennand and N Katsanis contributed to the model system experiments. T Raj, D Bennett, P De Jager contributed the ROS/MAP data.
A Chess, L Shinobu, L Mangravite, H Toyoshiba, R Gur, C Hahn, D Lewis, M Peters, B Lipska, J Buxbaum, K Hirai, E Schadt, E Domenici, B Devlin and P Sklar contributed to the management and leadership of phase 1 of the CommonMind Consortium. DATA AVAILABILITY
The CommonMind investigators are committed to the release of data and analysis results, with the anticipation that data sharing in a rapid and transparent manner will speed the pace of research to the benefit of the greater research community. Data and analytical results generated through the CommonMind Consortium are available through the “CommonMind Consortium Knowledge Portal”: doi:10.7303/syn2759792.
URLS:
Human Brain Collection Core (HBCC):
http://www.nimh.nih.gov/labs-at-nimh/research-areas/research-support-services/hbcc/human-brain-collection-core-hbcc.shtml)
CommonMind Consortium (CMC): www.synapse.org/CMC
Gemtools: http://www.wpic.pitt.edu/wpiccompgen/GemTools/GemTools.htm
GTEx Portal: www.gtexportal.org, dbGaP accession number phs000424.v6.p1 ROSMAP Study: https://www.synapse.org/#!Synapse:syn3219045
1000 Genomes Phase 3 genotype data: http://www.1000genomes.org
GO (Gene Ontology): http://www.geneontology.org
Reactome database: (http://www.reactome.org)
HGNC (HUGO Gene Nomenclature Committee) gene families: http://www.genenames.org
Plink 1.9: https://www.cog-genomics.org/plink2
ComBat: http://statistics.byu.edu/johnson/ComBat/
PLINK/Seq: https://atgu.mgh.harvard.edu/plinkseq/
MRIN: http://zhanglab.c2b2.columbia.edu/index.php/MRIN
MISO (http://genes.mit.edu/burgelab/miso/
GEO accession numbers for datasets - Braincloud: GSE30272; NIH: GSE15745, HBTRC: GSE44772; UKBEC: GSE46706; HBCC microarray: dbGAP study_id=phs000979.v1.p1
DNENRICH: https://psychgen.u.hpc.mssm.edu/dnenrich
Alzheimer’s GWAS data: http://web.pasteur-lille.fr/en/recherche/u744/igap/igap_download.php) Rheumatoid arthritis GWAS data: http://plaza.umin.ac.jp/~yokada/datasource/software.htm
Code Availability
HHS Public Access
Author manuscript
Nat Neurosci
. Author manuscript; available in PMC 2017 March 26.Published in final edited form as:
Nat Neurosci. 2016 November ; 19(11): 1442–1453. doi:10.1038/nn.4399.
A
uthor Man
uscr
ipt
A
uthor Man
uscr
ipt
A
uthor Man
uscr
ipt
A
uthor Man
uscr
A full list of authors and affiliations appears at the end of the article.
Abstract
Over 100 genetic loci harbor schizophrenia associated variants, yet how these variants confer liability is uncertain. The CommonMind Consortium sequenced RNA from dorsolateral prefrontal cortex of schizophrenia cases (N = 258) and control subjects (N = 279), creating a resource of gene expression and its genetic regulation. Using this resource, ~20% of schizophrenia loci have variants that could contribute to altered gene expression and liability. In five loci, only a single gene was involved: FURIN, TSNARE1, CNTN4, CLCN3, or SNAP91. Altering expression of FURIN, TSNARE1, or CNTN4 changes neurodevelopment in zebrafish; knockdown of FURIN in human neural progenitor cells yields abnormal migration. Of 693 genes showing significant case/ control differential expression, their fold changes are ≤ 1.33, and an independent cohort yields similar results. Gene co-expression implicates a network relevant for schizophrenia. Our findings show schizophrenia is polygenic and highlight the utility of this resource for mechanistic interpretations of genetic liability for brain diseases.
Keywords
Schizophrenia; dorsolateral prefrontal cortex; postmortem study; gene expression; RNA-seq; case-control study; biomarker; eQTL; functional GWAS; zebrafish; hiPSC
INTRODUCTION
How the human brain dynamically performs its innumerable functions is recognized as one of this century’s “Grand Challenges”. Indeed, seemingly straightforward fundamental information such as which genes are expressed therein and what functions they perform are only partially characterized. To overcome these obstacles, we established the CommonMind Consortium (CMC; www.synapse.org/CMC), a public-private partnership to generate functional genomic data in brain samples obtained from autopsies of cases with and without severe psychiatric disorders. The CMC is the largest existing collection of collaborating brain banks and includes over 1,150 samples. A wide spectrum of data is being generated on these samples, including regional gene expression, epigenomics (cell-type specific histone modifications and open chromatin), whole genome sequencing, and somatic mosaicism.
Schizophrenia (SCZ), affecting roughly 0.7% of adults, is a severe psychiatric disorder characterized by abnormalities in thought and cognition1. Despite a century of evidence establishing its genetic basis, only recently have specific genetic risk factors been
conclusively identified, including rare copy number variants2 and >100 common variants3. However, there is not a one-to-one Mendelian mapping between these SCZ risk alleles and diagnosis. Instead, SCZ is truly complex and appears to result from a myriad of genetic variants exerting small effects on disease risk4,5, conforming closely to a classical polygenic model. The available data are incomplete but implicate synaptic components, including calcium channel subunits and post-synaptic elements5–7. A consequence of polygenic inheritance is that the small effect sizes of individual variants complicate characterization of the biological processes they influence, both at the level of particular genes and pathways.
A
uthor Man
uscr
ipt
A
uthor Man
uscr
ipt
A
uthor Man
uscr
ipt
A
uthor Man
uscr
Post-mortem gene expression studies of SCZ cases suggest subtle abnormalities in multiple brain regions including the prefrontal and temporal cortices, hippocampus, and several specific cell types8. More than 50 gene expression studies of SCZ cases and controls have been reported, often of overlapping samples and mostly of modest scale (prior RNA sequencing studies evaluated only 5–31 cases, Supplementary data file 1). Results are often inconsistent and there are few replicated findings. These studies are probably underpowered to detect subtle effects that might be expected to arise as a result of this complex disease and within tightly regulated brain tissue9, among other limitations of existing microarray-based gene expression studies10.
RNA sequencing can accurately detect transcription at the gene and isoform level. We sequenced a cohort of SCZ and control subjects that is an order of magnitude larger than prior RNA sequencing studies. By applying state-of-the-art analytic methods and including genome-wide characterization of common variants, we generated a rich resource of the genetics of gene expression in the brain. This resource can serve as a useful catalogue of regulatory variants underlying the molecular basis of SCZ and other brain disorders. We use this resource to identify: (a) specific effects on gene expression of genetic variants
previously implicated in risk; (b) genes showing a significant difference in expression between SCZ cases and controls; and (c) coordinated expression of genes implicated in SCZ. Our results shed light on the subtle effects expected from the polygenic nature of SCZ risk and thus substantially refine our understanding of the neurobiology of SCZ.
RESULTS
Samples and sequencing
We generated RNA sequence data from post-mortem human dorsolateral prefrontal cortex (DLPFC; Brodmann areas 9 and 46) from brain banks at the Icahn School of Medicine at Mount Sinai, the University of Pennsylvania, and the University of Pittsburgh
(Supplementary Table 1). To control for batch effects, multiple randomization steps were introduced and DNA and RNA isolation and library preparation were performed at one site (Supplementary Fig. 1A). Samples were genotyped on the Illumina Infinium
HumanOmniExpressExome array (958,178 SNPs) and imputed using standard techniques with the 1000 Genomes Project as reference data11. These genotypes were then used to detect SNPs that have an effect on gene expression (eQTLs, expression quantitative trait loci), to estimate ancestry of the samples, and to ensure sample identity across DNA and RNA experiments. Ethnicity was similar between cases and controls (Caucasian 80.7%, African-American 14.7%, Hispanic 7.7%, East Asian 0.6%, Supplementary Figs. 1B, C). As expected3, SCZ cases inherited an increased number of common variant alleles previously associated with SCZ risk (P = 1.6 × 10⁻⁸, Supplementary Fig. 1D).
RNA sequencing was performed after depleting ribosomal RNA (rRNA). Following quality control, there were 258 SCZ cases and 279 controls. Fifty-five cases with affective disorder were included to increase power to detect eQTLs. The median number of paired end reads per sample was 41.6 million, with low numbers of rRNA reads (Supplementary Fig. 2). Following data normalization, 16,423 genes (based on Ensembl models) were expressed at levels sufficient for analysis, of which 14,222 were protein coding. Validation using PCR
A
uthor Man
uscr
ipt
A
uthor Man
uscr
ipt
A
uthor Man
uscr
ipt
A
uthor Man
uscr
showed high correlation (r > 0.5) with normalized expression from RNA-seq for the majority of genes assessed (Supplementary Fig. 3). Gene expression measurement can be influenced by a number of variables; some are well documented (e.g., RNA integrity (RIN) and post-mortem interval (PMI)), but others may be unknown. We investigated known covariates by standard model selection procedures to find a good statistical model (Supplementary Fig. 4 and 5). Covariates for RIN, library batch, institution (brain bank), diagnosis, age of death, genetic ancestry, PMI, and sex together explained a substantial fraction (0.42) of the average variance of gene expression, and were thus employed to adjust the data for all analyses.
Generation of a brain eQTL resource
To identify eQTLs, gene expression data from European-ancestry subjects (N = 467) were adjusted for known and hidden variables detected by surrogate variable analysis (SVA) conditional on diagnosis but excluding ancestry (Supplementary Fig. 2 and 4). Adjusted expression levels were then fit to imputed SNP genotypes, covarying for ancestry and diagnosis, using an additive linear model implemented in MatrixEQTL. The model
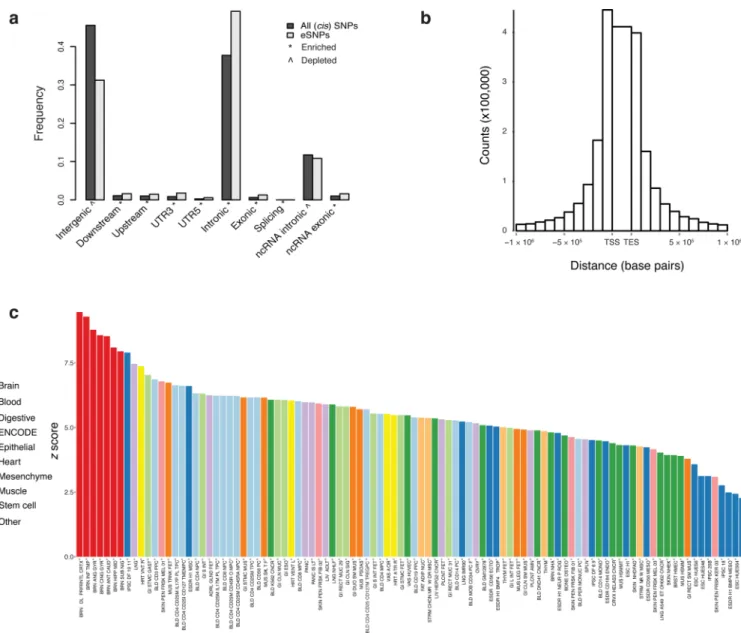
identified 2,154,331 significant cis-eQTLs, (i.e., within 1 Mb of a gene) at a false discovery rate (FDR) ≤ 5%, for 13,137 (80%) of 16,423 genes. Many eQTLs for the same gene were highly correlated, due to linkage disequilibrium, and 32.8% of eQTL SNPs (“eSNPs”) predict expression of more than one gene. Cis-eSNPs were enriched within genic elements and non-coding RNAs, particularly within 100 kb of the transcription start and end sites12, and depleted in intergenic regions (Fig. 1A, B). As defined by GTEx13, an “eGene” is a gene with at least one significant eSNP after strict correction for multiple marker testing for that gene. There were 8,427 eGenes at FDR ≤ 5%, or 18 eGenes discovered per sample, consistent with a prediction from GTEx. We examined the enrichment of max-eQTLs (defined as the most significant eSNP per gene, if any) in predicted enhancer sequences derived from the Roadmap Epigenomics Consortium and ENCODE across 98 human tissues and cell lines14. Cis-eQTLs were enriched for enhancer sequences present in brain tissues (Kolmogorov-Smirnov (KS) test versus non-brain: D = 1, P = 4.5 × 10⁻⁶), and the strongest enrichment is observed in DLPFC enhancers (Z = 9.5) (Fig. 1C).
To assess the utility of analyzing a much larger brain dataset, we compared previously reported DLPFC eQTLs to CMC-derived eQTL, estimating the proportion of non-null hypotheses (π1) in CMC and the number of additional eQTL found in CMC that were not detected in the other studies. GTEx v6 is the largest public dataset of eQTLs from DLPFC tissue (n = 92) assayed by RNA-seq; its replication in CMC is π1 = 0.98. Considering microarray-based eQTLs from the Harvard Brain Bank 15, BrainCloud16, NIH17, and the UK Brain Expression Consortium (UKBEC)18, we estimated π1 to be 0.75, 0.70, 0.79, and 0.93, respectively, indicating that our results captured most eQTLs found in other
independent samples. Replication was somewhat lower for a recent meta-analysis that included a mix of several distinct brain regions19 (π1 = 0.62), and for eQTLs detected in blood (π1 = 0.54)20. We also derived eQTL for 279 DLPFC samples as part of the NIMH Human Brain Collection Core (HBCC) microarray data and found replication π1 = 0.77. Moreover, concordance of the direction of allelic effect was high, with 93% of eQTL showing the same direction of effect when intersecting CMC eQTL (FDR ≤ 5%) with even a
A
uthor Man
uscr
ipt
A
uthor Man
uscr
ipt
A
uthor Man
uscr
ipt
A
uthor Man
uscr
liberally defined set of HBCC eQTL (FDR ≤ 20%). In addition to containing the vast majority of eQTL found in the literature, the CMC sample finds a substantial number of genes with previously undetected eQTL (Table 1).
The patterns of results should be different for “trans-eQTLs”, i.e., SNPs correlated with expression of a gene beyond 1 Mb of its genomic location. Trans-eQTLs incur a greater penalty for multiple testing, require greater power for detection, and are thus more susceptible to false positives and less likely to replicate than cis-eQTL. Nevertheless, the data supported 45,453 significant trans-eQTL at FDR ≤ 5%, of which 20,288 were also cis- eQTL SNPs for local genes, and 34% predicted expression of more than one distant gene. The proportion of trans eQTL in CMC that replicate in HBCC is 18.6% (both FDR ≤ 5%). The proportion of HBCC trans eQTL that replicate in CMC is 29.7%. Enrichment of trans-eQTLs with brain enhancers was not observed (data not shown), though enrichment in genic regions and depletion in intergenic regions was observed, particularly when restricting to trans eQTL ≥ 10 Mb from the gene location. We used similar techniques to derive isoform expression quantitative trait loci (isoQTLs).
eQTL signatures at SCZ risk loci point to specific genes
A hallmark of polygenic inheritance is that individual SNPs confer small effects on risk. For some risk SNPs, perhaps the majority, their impact could be mediated through effects on gene expression. Indeed, GWAS SNPs associated with SCZ risk occur more often than expected by chance in cis-regulatory functional genomic elements, such as enhancers or eQTL SNPs3,21–24. Yet, GWAS loci typically contain many genes, and SNPs therein are often highly correlated via linkage disequilibrium, so that assigning a biological role for a particular risk SNP has been difficult. Here, we leverage CMC-derived eQTL to relate SCZ risk variants to expression of specific genes.
Of the 108 SCZ GWAS loci previously reported3, 73 harbor cis-eQTL SNPs for one or more genes (FDR ≤ 5%). To determine if 73 out of 108 loci were larger than that expected by chance, we conducted an experiment that randomly chose such loci in the genome; it showed that 73 loci with cis-eQTL SNPs is consistent with chance expectation (data not shown). Moreover, the simple presence of an eQTL does not imply disease causality. We used Sherlock 25, a Bayesian approach that prioritizes consistency between disease
association and eQTL signatures in GWAS loci, to identify genes likely to contribute to SCZ etiology. While Sherlock evaluated genes across the genome, we only evaluated genes within the 108 SCZ GWAS loci because SNPs in these loci showed genome-wide significant association with SCZ; thus, in essence, we fine mapped these loci. The results suggested that GWAS risk and eQTL association signals co-localized for 84 genes in 30 of these loci (adjusted P < 0.05; Supplementary Fig. 6A, Supplementary data file 2). After removing genes where additional evaluation indicated lack of consistency (Supplementary Fig. 7B), there were 33 genes highlighted in 18 of the 108 GWAS loci (Supplementary data file 2). Genes found to have variants affecting risk for autism are often found enriched for variation affecting risk for SCZ; indeed, compared to other genes with eQTL in the GWAS loci, these 33 genes are more enriched for nonsynonymous de novo mutations in autism (fold
enrichment = 2.4, Pcorrected = 0.03), although not for SCZ, intellectual disability, or epilepsy.
A
uthor Man
uscr
ipt
A
uthor Man
uscr
ipt
A
uthor Man
uscr
ipt
A
uthor Man
uscr
Repeating the analyses using isoform-level eQTLs (isoQTL) identified nine genes in eight GWAS loci, with all but three genes already identified in the gene-level analysis
(Supplementary data file 2). Combining the gene and isoform data, 20 of 108 GWAS loci (19%) had evidence suggesting that mis-regulated gene expression could, in part, explain the genetic association with schizophrenia: 18 cis-QTL loci (cis-eQTL for 33 genes + 2 genes with cis-isoQTL), one locus implicated only by cis-isoQTL (SNX19), and one trans-eQTL association for IMMP1L at a GWAS locus on chr7. We discuss other genes identified by Sherlock in the Supplement.
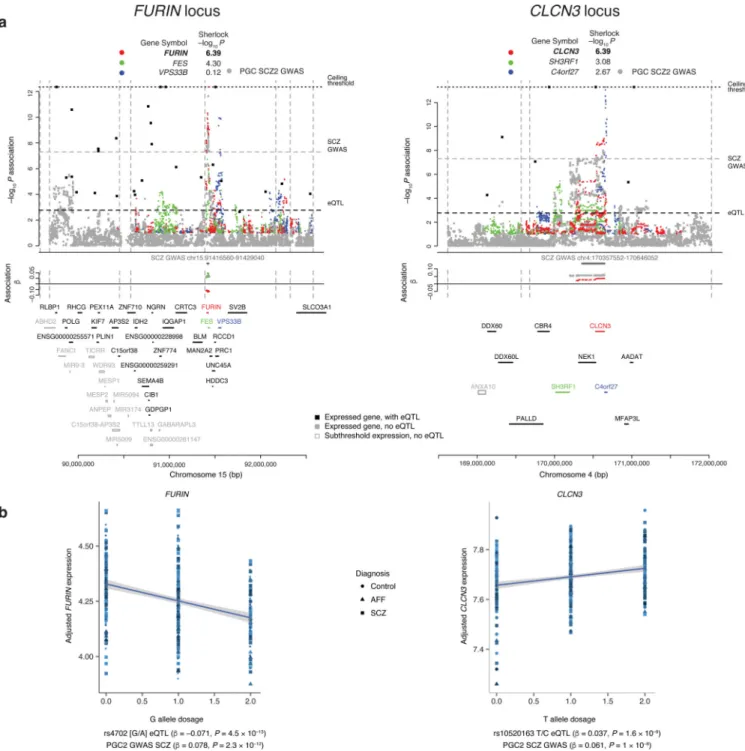
Of the 19 GWAS loci harboring SCZ-associated cis-eQTLs, eight involved only a single gene (i.e., no additional gene with relaxed adjusted Sherlock p < 0.5): furin (FURIN, down-regulated by risk allele), t-SNARE domain containing 1 (TSNARE1, up), contactin 4 (CNTN4, up), voltage-sensitive chloride channel 3 (CLCN3, up), synaptosomal-associated protein of 91 kDa (SNAP91, up), ENSG00000259946 (up), ENSG00000253553 (down), and the ENST00000528555 isoform of sorting nexin 19 (SNX19, down) (Fig. 2 and Supplementary Fig. 6B and 7A). For functional follow-up, we focused on the five single-gene loci encoding known proteins implicated at the single-gene level. First, we replicated these eQTL in the Religious Orders Study and Memory and Aging Project (ROS/MAP)26, with unpublished human DLPFC RNA sequencing data (N = 461). The most significant GWAS SNP was also a significant eQTL with the same direction of effect as in CMC for FURIN (rs4702: P = 1 × 10⁻⁶), CLCN3 (rs10520163: P = 9 × 10⁻⁶), and SNAP91 (rs3798869: P = 3 × 10⁻⁴); TSNARE1 (rs4129585: P = 0.057) and CNTN4 (rs17194490: P = 0.07) also had alleles in the same direction of effect as in CMC but did not reach significance.
CLCN3, SNAP91, and TSNARE1 are direct synaptic components, and CNTN4 and FURIN play roles in neurodevelopment. Specifically, CLCN3 (or ClC-3) is a brain-expressed chloride channel, where it appears to control fast excitatory glutamatergic transmission 27. SNAP91 is enriched in the presynaptic terminal of neurons where it regulates clathrin-coated vesicles, the major means of vesicle recycling at the presynaptic membrane. TSNARE1 plays key roles in docking, priming, and fusion of synaptic vesicles with the presynaptic membrane in neurons, thus synchronizing neurotransmitter release into the synaptic cleft. CNTN4 is a member of the contactin extracellular cell matrix protein family responsible for development of neurons including network plasticity28. It plays a key role in olfactory axon guidance29, and there is evidence for association of copy number variants overlapping CNTN4 with autism30. FURIN processes precursor proteins to mature forms, including brain-derived neurotrophic factor (BDNF), a key molecule in brain development whose down-modulation has been hypothesized as related to schizophrenia31, and BDNF and FURIN are up-regulated in astrocytes in response to stress.
The major histocompatibility complex (MHC / human leukocyte antigen / HLA) region is consistently most highly associated with SCZ, but it is a difficult region to dissect for causal variation because of its unusually high linkage disequilibrium and gene density (>200 DLPFC-expressed genes in chr6:25–36 Mb). Nevertheless, only five genes in this locus were ranked highly by Sherlock and passed evaluation for concordance of associations
(Supplementary data file 2): C4A, HCG17, VARS2, HLA-DMB, and BRD2. Consistent with recent work identifying structural variation of the C4 genes as partly mediating the genetic
A
uthor Man
uscr
ipt
A
uthor Man
uscr
ipt
A
uthor Man
uscr
ipt
A
uthor Man
uscr
MHC association, resulting in higher expression and perhaps driving pathological synapse loss in schizophrenia32, we found a strong correlation between the risk alleles for SCZ and up-regulation of expression of C4A (complement component 4A; Spearman’s ρ = 0.66, P < 10−16).
Functional dissection of genes highlighted
Our results point to a number of genes worthy of follow-up, and we sought an assay that was rapid and amenable to over- and under-expression. Manipulation of zebrafish embryos fits these requirements, especially for evaluation of anatomical phenotypes of early
development, such as head and brain size (or area). Perturbing expression of one or more genes in zebrafish has been used to identify genes contributing to neuropsychiatric disorders33–35. Therefore, we asked whether suppression or overexpression of the corresponding gene within each of the five SCZ risk loci could identify key proteins that regulate brain development. To evaluate the four genes up-regulated by risk alleles in the GWAS loci, we injected 200pg of human capped mRNA encoding TSNARE1, CNTN4, SNAP91, or CLCN3 in 1–8 cell stage embryos (N = 60 per experiment, at least two biological replicates performed). At 3 days post-fertilization (dpf), we assessed the area of the head that contains the forebrain and midbrain structures (Fig. 3A, B). Relative to control embryos, overexpression of TSNARE1 or CNTN4 resulted in a significant decrease in head size, 9.5% (P < 0.001) and 3.5% (P = 0.018), respectively, while SNAP91 or CLCN3 showed no statistically significant effect (Fig. 3A, B). Body length and somitic structures were similar across all embryos, suggesting that our observations were unlikely due to gross developmental delay. For FURIN, we sought to mimic the transcriptional down-regulation in human brains associated with SCZ risk. A reciprocal BLAST search of the zebrafish genome revealed a FURIN ortholog with two potential paralogs; both copies were expressed at ~40– 60 counts per million reads in mRNA from heads of 3 dpf zebrafish embryos36. We depleted furin_a, the isoform most closely resembling the human ortholog, using a splice blocking morpholino (sbMO) that almost completely extinguished expression of the endogenous message by triggering the inclusion of intron 7 (Supplementary Fig. 8). Suppression of furin_a led to a 24% decrease in head size (Fig. 3A, B); this observation was replicated in CRISPR/Cas9 mutants (Supplementary Fig. 8) and in embryos injected with a second sbMO targeting exon 5 (data not shown) Importantly, expression of human FURIN mRNA could rescue the phenotype induced by either morpholino, providing evidence for specificity (Supplementary Fig. 8).
Given a potential role for FURIN, TSNARE1, and CNTN4 during neurogenesis, we asked whether the decrease in head size could be attributed to changes in cell proliferation and/or apoptosis. Overexpression of CNTN4 and suppression of furin_a led to a 9.8% (P = 0.003) and a 29.8% (P < 0.001) decrease, respectively, in proliferating cells marked by phospho-histone3 (PH3), and overexpression of TSNARE1 led to a 9.5% increase (P = 0.018) in proliferating cells (N = 20 per experiment; Fig. 3C, D). Next, we wondered how more proliferating cells nevertheless resulted in a smaller head size phenotype for the case of TSNARE1. To test the possibility that cells exiting cell cycle experience a higher apoptotic index, we performed TUNEL staining on injected embryos, and determined that modulation of all three target genes led to a significant increase in apoptotic cells in the head region
A
uthor Man
uscr
ipt
A
uthor Man
uscr
ipt
A
uthor Man
uscr
ipt
A
uthor Man
uscr
corresponding to our head size measurements (N = 20 per experiment; P < 0.001; Fig. 3E, F). Taken together, the data support the hypothesis that changes in FURIN, TSNARE1, and CNTN4 expression levels induce subtle neuroanatomical variation in multiple brain regions.
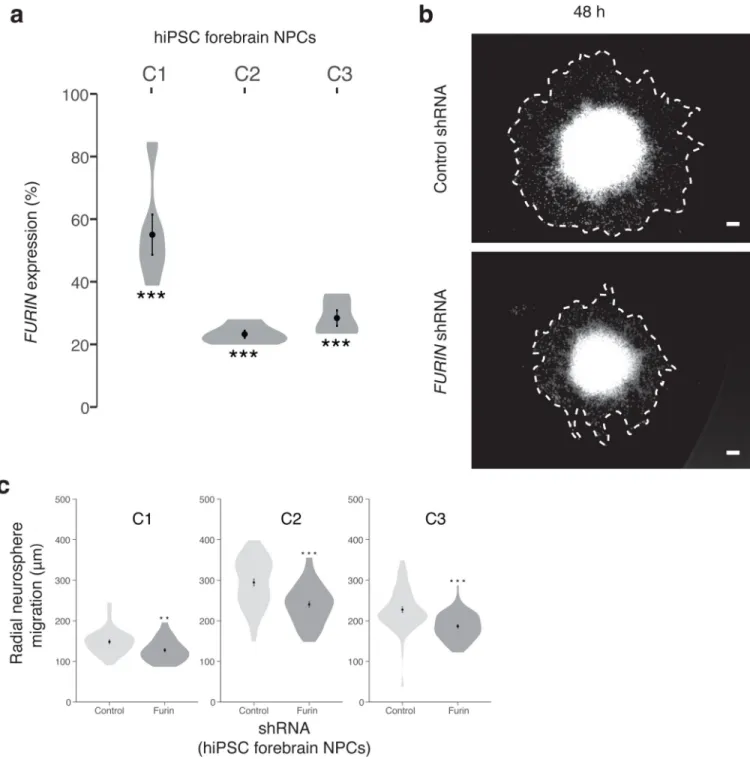
Depletion of furin in our in vivo zebrafish model had the largest impact on head size. Thus we further tested the impact of FURIN knockdown in human neural progenitor cells (NPCs) capable of differentiating into mixed populations of post-mitotic neurons and astrocytes37,38. Neurosphere outgrowth is a well-established neural migration assay measuring the distance NPCs migrate away from the neurosphere. NPCs were differentiated from human induced pluripotent stem cells (hiPSCs) reprogrammed from human fibroblasts using sendai viral vectors39,40. Pairwise isogenic comparisons were conducted in 307 neurospheres from three independent unaffected controls. We measured migration of DAPI-positive nuclei from pLKO.1 non-hairpin-PURO control neurospheres (n = 147) and LV-FURIN shRNA-PURO (shRNA-FURIN) knockdown neurospheres (n = 160). FURIN knockdown in the hiPSC NPCs resulted in significantly decreased total radial migration for all three individuals (C1: 1.16-fold decrease, P < 0.0017; C2: 1.23-fold decrease, P < 3 × 10⁻⁶; C3: 1.22-fold decrease, P < 2 × 10⁻⁶) (Fig. 4).
Gene expression is subtly disrupted in schizophrenia
We next evaluated whether SCZ cases versus controls differed in their expression levels per gene. Following normalization of read counts for each gene, a weighted linear regression adjusting for known covariates was performed (Supplementary Figs. 2 and 4). Analysis of the distribution of P values for the 16,423 genes was tested for a mixture of disease-associated and null distributions for 25 cases and 25 controls and suggests that
approximately 44% of genes are perturbed in SCZ; this excess of low P values disappears when case and control labels are permuted. While polygenic inheritance, where many genes are affected but to a small degree3, could explain this result, treatment and environmental factors also likely play a role. Without imposing a threshold on the magnitude of fold change in mean expression between SCZ and controls, we find 693 genes to be differentially expressed after correction for multiple testing (FDR ≤ 5%), 332 up-regulated and 361 down-regulated (Fig. 5A, Supplementary data file 3). All had modest fold changes (Fig. 5B), with a mean of 1.09 and range 1.03–1.33 (inverting down-regulated expression ratios). As expected, hierarchical clustering of the differentially expressed genes showed case-control distinctions but were independent of institution, sex, age at death, ethnicity, and RIN (Fig. 5A). We examined differential expression in an independent sample, the NIMH Human Brain Collection Core (HBCC), which generated DLPFC gene expression data using Illumina HumanHT-12_V4 Beadchip microarrays from 131 SCZ cases and 176 controls. Though these arrays differ from RNA-seq in their capture features, there was high correlation of test statistics for differential expression in CMC compared to HBCC for the differentially expressed genes also present in the HBCC data (480 of 693), Pearson
correlation r = 0.58 (P < 10−16); the correlation remains high (r = 0.28, P < 10−16) across all 10,928 genes common to both platforms after QC (Fig. 5C).
The differential expression observed here is smaller than that reported in earlier studies (Supplementary data file 1), but it is consistent with plausible models for average differential
A
uthor Man
uscr
ipt
A
uthor Man
uscr
ipt
A
uthor Man
uscr
ipt
A
uthor Man
uscr
gene expression and the polygenic inheritance of SCZ (Supplementary Text, “Differential gene expression: expectation, variability, and power analyses”). Consider, for example, a gene for which the major determinant of differential expression is the case-control difference in allele frequency at an eQTL SNP. For that gene, the expected magnitude of differential expression fold change will be on the order of the allele frequency differences seen in the recent large Psychiatric Genomic Consortium SCZ genetic association study (~1–2%)3, precisely what is observed in the CMC data. Beyond case-control difference in allele frequency, our modeling can also explain the difference between earlier studies and CMC results (Supplementary Fig. 9); because earlier studies tend to be far smaller in sample size, their larger differential expression is consistent with either the well-known “Winner’s Curse”41 or false positives that may occur in smaller samples. Finally, our results imply a need for thousands of samples to ensure 80% statistical power to observe differential expression between cases and controls for the genes implicated at SCZ-associated eQTL, e.g., the five genes of interest above.
The most highly up-regulated protein-coding gene is tachykinin receptor 3 (TACR3, NK3 receptor, 1.24-fold, Fig. 5D). NK3 antagonists have been tested in SCZ and other CNS diseases42. Moreover, rat and human studies have suggested a role for the NK3 receptor in memory and cognition43, both key impairments of schizophrenia. Insulin-like growth factor 2 (IGF2), the most strongly down-regulated gene (1.33-fold, Fig. 5D), can rescue
neurogenesis and cognitive deficits in certain mouse models of schizophrenia44. Also included among the top 100 differentially expressed genes are the alpha 5 subunit of the GABA A receptor (GABRA5) and calbindin (CALB1), genes previously reported as differentially expressed in cortical tissue from schizophrenia patients, suggesting GABAergic interneuron dysfunction45. Available in situ hybridization data from DLPFC suggest that genes identified by DE analysis display various degrees of cell-type specificity, which could affect the estimated fold changes (Supplementary Fig. 10).
We identified 239 isoforms differentially expressed between SCZ cases and controls: 94 up-regulated and 145 down-up-regulated. These isoforms derive from 223 genes, which are enriched, as expected, for overlap with the 693 differentially expressed genes (P = 2 × 10−131, Fisher’s exact test), and 136 are differentially expressed at both the gene and isoform levels (Supplementary Fig. 11). No obvious unifying biological theme emerges from this set of genes and isoforms on the basis of pathway enrichment analysis (Supplementary data file 4). An assessment of the impact of age at death or cell type proportions suggests that these variables do not explain significant differential expression (Supplementary Fig. 12). Although analyses of experiments performed using either monkeys or rodents indicate that genes whose expression are affected by antipsychotics are often the same as those we find altered in individuals with SCZ, the impact of antipsychotic drugs nevertheless tends to be significantly in the opposite direction of that observed in the SCZ subjects (Supplementary Table 2). Thus, our analyses find that genes highlighted by the contrast of SCZ cases versus control subjects do not largely trace their differential expression to antipsychotic
medications, although intriguingly they do suggest a mechanism for the efficacy of these drugs46.
A
uthor Man
uscr
ipt
A
uthor Man
uscr
ipt
A
uthor Man
uscr
ipt
A
uthor Man
uscr
Brain co-expression networks capture SCZ associations
Coordinated expression of genes is critical to brain development and function. One expectation of polygenic inheritance of disease is that this coordination may be subtly altered in individuals with SCZ. To assess this, we applied weighted gene co-expression network analysis (WGCNA) to the matrix of pairwise gene co-expression values. WGCNA recovers a network that consists of nodes (genes) and edges connecting nodes (i.e., the degree of co-expression for a pair of genes, measured as their correlation after transformation by raising the value to a power β that results in an overall scale-free topology). WGCNA divides the network into subnetworks called modules, or clusters of genes with more highly correlated expression.
We constructed gene co-expression networks separately from control individuals and SCZ cases (Supplementary data file 5), since we wished to assess disease-dependent changes in co-expression for modules of interest15. The co-expression network generated from the controls consisted of 35 modules each containing between 30 and 1,900 genes, along with ~3,600 unclustered genes (Supplementary data file 5). Four modules stand out in harboring an excess of differentially expressed genes (Fig. 6A, Supplementary data file 6). Of these, however, only one (M2c) shows association with differential expression (OR = 2.3, P = 1 × 10⁻¹³) and multiple prior genetic associations with SCZ; the latter encompasses genes in GWAS loci (FE [fold-enrichment] = 1.36, P = 0.04), rare CNV (FE = 1.52, P = 0.051), and rare nonsynonymous variants (FE = 1.18, P = 2 × 10⁻⁴) (Supplementary table 3). Given its apparent relevance to SCZ risk, we tested if the co-expression pattern for M2c was perturbed in SCZ samples relative to controls. We used two categories of network-based preservation statistics: (a) testing whether highly connected nodes in a module remain as highly connected (“density”), or (b) testing for differences in the overall connectivity pattern in a module (“connectivity”). The M2c module exhibits a loss of density in the SCZ cases (permutation Z = −1.79, one-tailed P = 0.037, Fig. 6B) but no loss of connectivity. The loss of density replicates in the HBCC cohort (Z = −3.02, P = 0.003), indicating that the regulatory coordination of genes in this module is disrupted in SCZ. The dysregulation of M2c in SCZ is not due to medication effect or clinical and technical confounds.
Consistent with prior studies of the brain transcriptome15,47–50, we find gene co-expression to be organized into modules of distinct cellular and functional categories (Supplementary data file 7). In particular, the M2c module is enriched for multiple categories, including axon guidance, postsynaptic membrane, transmission across chemical synapses, and voltage-gated potassium channel complexes (Fig. 6C). Gene sets identified in prior genetic studies that highlighted certain neurobiological functions are also enriched in the M2c module, including the activity-regulated cytoskeleton-associated (ARC) protein complex, targets of fragile X mental retardation protein (FMRP), neuronal markers, post-synaptic density (PSD) proteins, and NMDA receptors (Fig. 6A). Overall, our results point to the M2c module of ~1400 genes that possess functions related to synaptic transmission as being enriched for differential expression, overlapping SCZ genetic signal, and with some genes having less dense co-expression in SCZ cases.
A
uthor Man
uscr
ipt
A
uthor Man
uscr
ipt
A
uthor Man
uscr
ipt
A
uthor Man
uscr
DISCUSSION
Deficits in executive functions, especially cognitive function, are key features of SCZ. The roots of these deficits lie in cortical function and integration, at least in part tracing to the DLPFC. Here we have used gene expression derived from this tissue to understand how genetic liability is related to the molecular etiology of SCZ. Our analyses had two fundamental goals: to identify mechanisms that underlie genetic risk and to describe differences in gene expression and co-expression related to disease. By intersecting transcriptomics and genetics, we elucidated important aspects of the genetic control of transcription and found that genetic variants in 20 of the 108 SCZ GWAS risk loci alter expression of one or more genes. Prior analyses using brain eQTL datasets derived from older technologies have pointed to less than a handful of such associations3. In five of the 20 loci for which we observed regulatory potential of GWAS variants the risk variants altered expression of only one gene. Experimental manipulation of three of these genes had an impact on neuroanatomical and developmental attributes in model systems, making these genes excellent candidates for further biological investigation. We also detected replicable differences in gene expression in SCZ that point to subtle but broad disruption in
transcription, which is consistent with the polygenic nature of genetic risk underlying SCZ. Finally, we identified a subnetwork of ~1400 genes sub-serving functions related to synaptic transmission that is significantly perturbed in SCZ and is highly enriched for SCZ genetic signal.
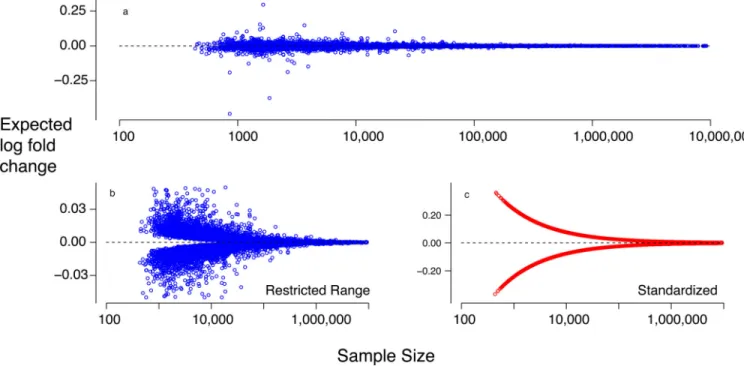
In contrast, we did not find evidence for case-control differential expression among the implicated GWAS risk genes. At first blush this appears to contradict evidence for impact on risk. Yet the magnitude of differential expression will be determined largely by case-control differences in allele frequencies, which we know are small. Modeling the differential in allele frequencies and the predicted effect of alleles on gene expression demonstrates that the distribution of expected differential expression, across genes, is quite similar to the observed distribution from the CMC data (Fig. 7A). Using allele frequencies from the PGC
schizophrenia data, we can ask what the number of cases are needed to detect differential expression. For example, 11,784 cases and 11,784 controls would be needed to have 80% power to detect a significant case-control difference in FURIN expression. Genome-wide, the median number of cases and controls needed to obtain 80% power assuming 10,000 genes is ~28,500, well beyond any available dataset (Fig. 7B,C). Our model demonstrates that the distribution of expected differential expression, across genes, is quite similar to the observed distribution from the CMC data (Fig. 7). This calls into question results from smaller studies that report large differential expression. Our analyses show that these studies would have notably larger variability, and because genome-wide surveys test a large number of genes, that variability can translate into large observed differential expression: even when no gene is differentially expressed, studies with only 25 cases and 25 controls can lead to estimates of differential expression exceeding twofold. Notably, this pattern not seen when the N is raised to 250. (See supplementary text for additional scenarios, discussion and modeling.).
It is conceivable, indeed probable, that certain cells or cell types (e.g., pyramidal neurons) are more salient for risk than the heterogeneous tissue evaluated here. Depending on the
A
uthor Man
uscr
ipt
A
uthor Man
uscr
ipt
A
uthor Man
uscr
ipt
A
uthor Man
uscr
pattern of cell-specific gene expression, this scenario could have little or no impact on differential expression or it could diminish it somewhat. The same is true for detection of eQTLs. We do not expect, however, that the scenario will compromise the bulk of our results, all of which complement the genomic studies of this disease. Alterations of the cellular composition in SCZ versus controls might also introduce a systemic bias in the analysis of differential expression; e.g., if the proportion of neurons were reduced by 2% in SCZ versus controls, multiple neuronal genes might appear to be downregulated in SCZ. Analyses of cell composition, however, do not support global differences in the cellular composition in DLPFC tissue from SCZ versus control subjects.
The findings reported here by the CommonMind Consortium (CMC) represent a unique resource to understand brain function, basic neuroscience, and brain diseases at the molecular level. They include a comprehensive compilation of gene expression patterns, together with intensive evaluation of eQTLs across the genome. The expertise and support to produce and analyze these data required a consortium of brain banks, pharmaceutical companies, a foundation, academic centers, and the NIMH, and this work represents the first phase of our ongoing project. All results are available through the CommonMind
Knowledge Portal with a searchable database of eQTLs and other visualizations (https:// shiny.synapse.org/users/ssiebert/cmc_eqtl_query/). Both alone, and in combination with other datasets such as GTEx, the CMC data will empower future studies paving the way for connecting genetic influences on cellular function with changes in macroscopic circuits of the brain that may ultimately lead to disease.
ONLINE METHODS
Post-mortem samples
Data generated for this study came from postmortem human brain specimens originating from the tissue collections at the three brain banks described below. All samples were shipped to the Icahn School of Medicine at Mount Sinai (ISMMS) for nucleotide isolation and data generation. See Supplementary Fig. 1A for an overview of the sample collection and aggregation workflow.
Selection criteria—Postmortem tissue from schizophrenia (SCZ) and bipolar or other affective/mood disorder (AFF) cases were included if they met the appropriate diagnostic DSM-IV criteria, as determined in consensus conferences after review of medical records, direct clinical assessments, and interviews of family members or care providers. Cases were excluded if they had neuropathology related to Alzheimer’s disease and/or Parkinson’s disease, acute neurological insults (anoxia, strokes, and/or traumatic brain injury)
immediately prior to death, or were on ventilators near the time of death. Three case samples (2 with leukotomies, and 1 with a history of a head injury prior to diagnosis) were included; these were not outliers on any metrics that we used to evaluate our samples (see “RNA-seq outliers” below).
“MSSM” sample - Mount Sinai NIH Brain Bank and Tissue Repository (NBTR) (http://icahn.mssm.edu/research/labs/neuropathology-and-brain-banking)— The Mount Sinai Brain Bank was established in 1985. The NBTR obtains brain specimens
A
uthor Man
uscr
ipt
A
uthor Man
uscr
ipt
A
uthor Man
uscr
ipt
A
uthor Man
uscr
from the Pilgrim Psychiatric Center, collaborating nursing homes, Veteran Affairs Medical Centers and the Suffolk County Medical Examiners Office. Diagnoses are made based on DSM-IV criteria and are obtained through direct assessment of subjects using structured interviews and/or through psychological autopsy by extensive review of medical records and informant and caregiver interviews52,53. Informed consent is obtained from the next of kin. The brain bank procedures are approved by the ISMMS IRB and exempted from further IRB review due to the collection and distribution of postmortem specimens. All samples for the study were dissected from the left hemisphere of fresh frozen coronal slabs cut at autopsy from the dorsolateral prefrontal cortex (DLPFC) from Brodmann areas 9/46. Immediately after dissection, samples were cooled to −190°C and dry homogenized to a fine powder using a L-N2 cooled mortar and pestle. Tissue was transferred on dry ice to ISMMS as a dry powder for DNA and RNA extraction.
“Pitt” sample - The University of Pittsburgh Brain Tissue Donation Program— Brain specimens from the University of Pittsburgh Program are obtained during routine autopsies conducted at the Allegheny County Office of the Medical Examiner (Pittsburgh) following the consent of the next of kin 54. An independent committee of experienced research clinicians makes consensus DSM-IV diagnoses for all subjects on the basis of medical records and structured diagnostic interviews conducted with the decedent’s family member 55. All procedures for Pitt samples have been approved by the University of Pittsburgh’s Committee for the Oversight of Research involving the Dead and Institutional Review Board for Biomedical Research. At autopsy, the right hemisphere of each brain is blocked coronally, immediately frozen, and stored at −80°C56. Samples for this study contained only the gray matter of DLPFC, where Brodmann area 9/46 was cut on a cryostat and collected in tubes appropriate for DNA or RNA extraction. The DNA and RNA tubes were shipped on dry ice to ISMMS as homogenized tissue in trizol for RNA extraction and thinly sliced tissue for DNA extraction. Specimens from Pitt were provided as matched case/ control pairs. These were perfectly matched for sex, and as closely as possible for age (73% of pairs were matched within 5 years, and 95% within 10 years) and race (71% of pairs were matched for race). Members of a pair were always processed together for RNA-seq. Tissue for 10 of the Pitt controls was extracted in duplicate, once as part of a SCZ pair and once as part of a bipolar pair.
“Penn” sample - University of Pennsylvania Brain Bank of Psychiatric illnesses and Alzheimer’s Disease Core Center (http://www.med.upenn.edu/ cndr/biosamples-brainbank.shtml)—Brain specimens are obtained from the Penn prospective collection. Disease diagnoses were made based on DSM-IV criteria and obtained through a clinical interview by psychiatrist and review of medical records. All procedures for Penn are approved by the Committee on Studies Involving Human Beings of the University of Pennsylvania, and the use of control postmortem tissues was considered exempted research in accordance with CFR 46.101 (b), item 65 of Federal regulations and University policy. At autopsy, the right or left hemisphere of each brain is blocked into coronal slabs, which are immediately frozen and stored at −80°C. For this study, Brodmann areas 9/46 were dissected from either the left or right hemisphere and pulverized in liquid nitrogen. The tissue was shipped in tubes appropriate for DNA or RNA extraction to
A
uthor Man
uscr
ipt
A
uthor Man
uscr
ipt
A
uthor Man
uscr
ipt
A
uthor Man
uscr
ISMMS as homogenized tissue in trizol for RNA extraction and as dry pulverized tissue for DNA extraction.
Tissue, RNA and DNA preparation
Total RNA was isolated from approximately 50 mg homogenized tissue in Trizol using the RNeasy kit according to manufacturer protocol. Samples were processed in batches of 12, and the Pitt matched case/control pairs were always processed in the same batch. The order of extraction for SCZ-affected and control samples was assigned randomly with respect to brain bank, diagnosis, and all other sample characteristics. Because the affective disorder cases (AFF) and matched controls from Pitt were not available until after the processing of the SCZ and controls was underway, these samples were randomized among the remaining 132 SCZ and control samples still queued for extraction at that time. The mean total RNA yield was 15.3 ug (+/− 5.7). The RNA Integrity Number (RIN) was determined by fractionating RNA samples on the 6000 Nano chip (Agilent Technologies) on the Agilent 2100 Bioanalyzer. 51 samples with RIN < 5.5 were excluded from the study (see Sample QC below). Among the remaining samples, the mean RIN was 7.7 (+/− 0.9), and the mean ratio of 260/280 was 2.0 (+/− 0.02).
DNA was isolated from approximately 10 mg dry homogenized tissue from specimens coming from the MSSM and Penn brain banks. The thinly sliced tissue from Pitt was homogenized before DNA isolation. All DNA isolation was preformed using the Qiagen DNeasy Blood and Tissue Kit according to the manufacturer’s protocol. DNA yield was quantified using Thermo Scientific’s NanoDrop. The mean yield was 12.6 ug (+/− 4.6), the mean ratio of 260/280 was 2.0 (+/− 0.1), and the mean ratio of 260/230 was 1.8 (+/− 0.6).
RNA Library Preparation and Sequencing
Processing order was re-randomized prior to ribosomal RNA (rRNA) depletion, and samples were processed in batches of 8. To expedite sequencing, processing began before extraction was complete and randomization occurred among all available extracted samples in sets of 120 to 226. Briefly, rRNA was depleted from about 1 ug of total RNA using Ribo-Zero Magnetic Gold kit (Illumina/Epicenter Cat # MRZG12324) to enrich for polyadenylated coding RNA and non-coding RNA. The Pitt case/control pairs were batched together in each processing step, including Ribo-Zero depletion, sequence library preparation, and
sequencing lane. 10 of the Pitt controls were extracted and sequenced as independent duplicates, once as part of a SCZ pair and once as part of a bipolar pair. The sequencing library was prepared using the TruSeq RNA Sample Preparation Kit v2 (RS-122–2001-48 reactions) in batches of 24 samples. The insert size and DNA concentration of the
sequencing library was determined on Agilent Bioanalyzer and Qubit, respectively. A pool of 10 barcoded libraries were layered on a random selection of two of the eight lanes of the Illumina flow cell bridge amplified to ~250 million raw clusters. One-hundred base pair paired end reads were obtained on a HiSeq 2500. The sequence data were processed for primary analysis to generate QC values (reads were mapped to the human reference genome using TopHat; see “Mapping, QC and quantification of Gene Expression” below). Samples with a minimum of 50 million mapped reads (~25 million paired end reads) and less than 5% rRNA-aligned reads were retained for downstream analysis. We attempted a single
A
uthor Man
uscr
ipt
A
uthor Man
uscr
ipt
A
uthor Man
uscr
ipt
A
uthor Man
uscr
round of re-sequencing for samples that failed these QC criteria. In the end, a total of 15 samples did not meet these sequencing criteria (see “Sample QC” below) and were discarded.
DNA genotyping, QC, ancestral evaluation and polygenic scoring
Genotyping was preformed on the Illumina Infinium HumanOmniExpressExome 8 v 1.1b chip (Catalog #: WG-351–2301) using the manufacturer’s protocol. Samples for genotyping were aliquoted onto 96 well plates, where each plate had an internal control from the HapMap project (NA12878 - Coriell Institute) in two unique locations. Initial QC was preformed using PLINK 57 to remove markers with: zero alternate alleles, genotyping call rate ≤ 0.98, Hardy-Weinberg P value < 5 × 10⁻⁵, and individuals with genotyping call rate < 0.90. This removed 2 samples from the analysis. After QC, 668 individuals genotyped at 767,368 markers were used for imputation. Phasing was performed on each chromosome using ShapeIt v2.r79058, and variants were imputed in 5 Mb segments by Impute v2.3.159 with the 1000 Genomes Phase 1 integrated reference panel11 excluding singleton variants. Note that, in addition to the 22 autosomes, we also included chromosome X, split out into pseudoautosomal (PAR) and non-PAR genomic regions to properly handle male haploidy in the non-PAR regions.
To infer ancestry from genetic data, we identified a set of high quality autosomal SNPs from the pre-imputed data with the following properties: an rs dbSNP database identifier, known physical location in the hg19 reference genome, alleles coded as either A, C, G, or T, call rate ≥ 99.5%, minor allele frequency MAF > 0.05. These criteria yielded 552,351 SNPs. Next, using PLINK57, we performed LD pruning using sliding windows of 50 SNPs, with steps of 5 and a pairwise r2 < 0.04 and found 28,663 SNPs. Ancestry was determined using clusterGem in GemTools (arXiv:1104.116260,61, http://www.wpic.pitt.edu/wpiccompgen/ GemTools/GemTools.htm). Gemtools found that 5 dimensions and 7 clusters were sufficient to describe the ancestry space. Because one sample was missing key phenotypic
information, 667 subjects were assigned ancestry based on DNA genotypes. Supplementary Fig. 1B, C describe the distribution of nominal ancestry and diagnosis and plot several informative dimensions of genetically-inferred ancestry.
We carried out analyses for polygenic scoring of schizophrenia risk using the largest available schizophrenia association dataset3 as the “discovery” set. Quantitative scores were computed for each subject in this paper based on the set of SNPs with P values less than predefined P value thresholds (pT) in the discovery data set: pT < 0.0001, pT < 0.001, pT < 0.01, pT < 0.05, pT < 0.1, pT < 0.2, pT < 0.3, pT < 0.5, and pT < 1. For each SNP set defined by pT, we calculated the proportion of variance explained (Nagelkerke’s r2, Supplementary Fig. 1D). Throughout this work, we refer to the scores defined at pT < 0.5 simply as “polygenic risk scores” (PRS).
RNA Sample QC
Samples were excluded if RIN < 5.5 or genetic information from the sample was inconsistent with subject descriptors such as sex. Of the 633 samples sent for sequencing (those with RIN ≥ 5.5), 15 samples were removed because they yielded < 50 million total
A
uthor Man
uscr
ipt
A
uthor Man
uscr
ipt
A
uthor Man
uscr
ipt
A
uthor Man
uscr
reads (~25 million paired end reads) or had > 5% of reads aligning to rRNA, based on two attempts to produce quality sequence (all samples failing either QC criterion on the first attempt were re-prepped and/or re-sequenced, and those failing twice were removed); calculation of RNA-seq QC metrics is described in “Mapping, QC and Quantification of Gene Expression” below. Of the 10 Pitt control samples that were sequenced twice, only the first sequencing run was included in our analysis. Of the remaining 609 samples, two were removed because their DNA genotypes had high rates of missingness; one sibling pair was identified and the sample with the lower RNA quality (RIN) was removed; 14 samples were removed (see details below) because they were determined to be outliers based of a series of multivariate analyses of the RNA-seq data (N =10), or due to sample contamination/mix-up (N = 4). This left 592 samples for subsequent analyses.
To evaluate discordance between nominal and genetically-inferred sex, we used PLINK 57 to calculate the mean homozygosity rate across X-chromosome markers and to evaluate the presence or absence of Y-chromosome markers. Pairwise comparison of samples across all genotypes was done to identify potentially duplicate samples (duplicate pair defined as having genotypes > 99% concordant) or related individuals, again using PLINK.
RNA-seq outliers were detected using two methods in parallel.
i. To evaluate the data for outliers, one group of analysts used four approaches to normalization: FPKM (fragments per kilobase per million reads) from Cufflinks; quantile normalization across samples; quantile normalization across genes; and trimmed mean of M values (TMM) from the edgeR package62,63. We applied three different methods of analysis to these normalized data sets: Hierarchical Clustering with average linkage (HC); the number of extreme transcripts (NT: the number of transcripts with expression value outside the 95% confidence interval for the transcript, across individuals); and Principal Component Analysis (PCA). For HC, a sample (or small group of samples) was declared an outlier if it did not cluster with other samples. If NT > 7.6% of total transcripts, it was declared an outlier. Finally, if the PCA revealed a sample or small group of samples represented by a leading PC (largest 5), it was declared an outlier. When combining these results, if a sample was declared an outlier by all three methods, it was labeled an outlier.
ii. Separately, another group of analysts applied two procedures to detect outliers on the TMM-normalized data, namely Inter Array Correlation (IAC49) and “Iterative” PCA (iPCA). IAC computes the pairwise
correlation over genes for all pairs of samples, plots the distribution of the resulting correlations, and empirically finds outliers. Here we used 3 standard deviations as a threshold to declare a sample an outlier. Alternatively, for iPCA, the following algorithm was implemented: the first two PCs were computed from the data; samples beyond the 95% confidence envelope were identified and removed; then the first two PC were recomputed, outliers identified and removed; and so on, until no outliers were detected. All of the samples removed were declared outliers.
A
uthor Man
uscr
ipt
A
uthor Man
uscr
ipt
A
uthor Man
uscr
ipt
A
uthor Man
uscr
The full set of samples labeled outliers was then the union of the IAC and iPCA sets.
The results from analysis (i) and (ii), were compared for consensus. In total, 10 samples were identified as outliers by both groups and these were eliminated from all subsequent analyses.
We ensured DNA and RNA data were from a single individual by making SNP calls from RNA-seq results using samtools and bcftools 0.1.19, using the author-recommended protocol, which includes the “Bayesian inference” option. Calls were made only for SNP locations that were assayed on the genotyping chip. Raw variant calls were filtered, as recommended, using the vcfutils.pl varFilter (v0.1.18) option with the maximum depth set to 120 (roughly twice the average read depth). SNP calls from the DNA genotyping were converted to reference forward strand using PLINK. PLINK/Seq (https://
atgu.mgh.harvard.edu/plinkseq/) was then used to generate a VCF file by running the fix-strand and write-vcf commands.
Pairwise-discordance of SNP calls between RNA-seq and the genotyping chip was assessed for all possible combinations of RNA-seq samples and DNA genotyping samples.
Discordance was calculated using the variant tools software64, which reports the fraction of discordant sites out of the total number of sites where both samples report a genotype. The basic approach for calling a match was to plot the discordance values across all samples, for an all-by-all comparison, and look for a bimodal distribution with an obvious cutoff point (consistent with pairs that should match and all other pairs which do not). Indeed, all of the distributions were bimodal with regions of zero frequency in between the two peaks. The distributions of discordance values were different for RNA vs. DNA. For RNA-RNA sample matches, we called matches as instances where two samples had less than 15% discordance from each other; for DNA-RNA matches, the cutoff was 25%. We verified RNA-DNA matching within samples. Finally, we predicted gender for each sample based on the fraction of total reads aligning to the Y chromosome; if the log(fraction) was ≤ −7.4, the sample was called female, otherwise male. This called gender was evaluated to ensure it matched the reported gender from the corresponding brain bank manifest. By this process, we identified one sample mix-up (wrong sample sent for RNA-seq), and three samples were likely contaminated with other samples (high degree of genotype matching). These four samples were removed.
The entire QC process yielded 592 high-quality samples for analysis (258 SCZ, 279 control individuals, and 55 AFF [47 bipolar disorder, 6 major depressive disorder, and 2 mood disorder, unspecified]), with demographic breakdown of the cases and controls as described in Supplementary Table 1.
Evaluation of RNA Quality
RIN is a standard measure of RNA quality, but it focuses on the integrity of ribosomal RNA, rather than surveying quality of RNA from genes throughout the genome. A few alternatives to RIN have been proposed, a very recent proposal being the “mRIN” method65, which analyzes read coverage over transcripts and derives statistics related to quality. Here we use
A
uthor Man
uscr
ipt
A
uthor Man
uscr
ipt
A
uthor Man
uscr
ipt
A
uthor Man
uscr
the mRIN software to evaluate the RNA quality of the samples. The CMC data were processed using the pipeline described on the mRIN website (http://
zhanglab.c2b2.columbia.edu/index.php/MRIN). Parameters were set as suggested in the documentation. Additional filtering based on gene expression values was not performed. Data were analyzed without any QC beyond what is automatically implemented in mRIN.
We computed mRIN on the 537 SCZ case and control samples for 18,338 (17,527 uniquely identified) RefSeq transcripts using the mRIN package by Feng et al. Sample by transcript combinations were required to have an abundance > 2. After this step, 6,072 transcripts with a missing rate > 50% were removed from the analysis. Finally, for transcripts with more than one entry in the dataset the entry with the lowest missing rate was retained. After these edits a total of 12,246 transcripts remained. The mRIN statistics and associated P values were subsequently computed using the formulas from the Feng et al. paper. Samples with extreme negative values for the mRIN statistic should indicate low quality samples. The distribution is centered near zero and has no extreme negative values. There were 17 and 3 samples with P value < 0.05 and < 0.01, respectively. One would expect a total of 29 and 5 samples to have P values of this magnitude by chance alone. We therefore conclude the RNA quality of the samples is adequate.
Mapping, QC and Quantification of Gene Expression
The top panel of Supplementary Fig. 2 gives an overview of the RNA-seq data processing pipeline and QC metrics. In detail, reads were mapped to human reference genome hg19 using TopHat version 2.0.9 and Bowtie version 2.1.0, with the following parameters: 0 mismatches in a 20 bp seed, reference guided against Ensembl genes and isoforms (version 70). For each sample, this produced a coordinate-sorted BAM file of mapped paired end reads including those spanning splice junctions, as well as a BAM file of unmapped reads.
Overall quality control metrics were calculated using RNA-SeQC66 for each sample, including total number of reads (counting twice each fragment sequenced, once for each end in pair), number of mapped reads (again, separately counting each end of a paired end since one may map and not the other), the rates of reads mapping to rRNA, intergenic regions, intragenic regions, introns, exons, and the number of genes and transcripts detected (defined here simply as those with at least 5 exon-mapping reads). UCSC Genome Browser
transcripts were used for this quality control (QC) analysis.
Genes—Known Ensembl gene levels were quantified by HTSeq version 0.6.0 in intersection-strict mode (the BAM file was streamed to HTSeq through novosort version 1.0.1, as HTSeq accepts read-name-sorted alignments). This provides an integral count of reads for each gene in each sample to be used in downstream analyses (a sample-by-gene “read count matrix”).
Isoforms—Relative isoform abundances (PSI = percent spliced in) of Ensembl genes were estimated using MISO (http://genes.mit.edu/burgelab/miso/; version 0.5.2, run with default parameters 67). We processed the per-sample, per-gene MISO output files to extract the estimated PSI, as well as the standard deviations of the estimated sampled PSI values. We
A
uthor Man
uscr
ipt
A
uthor Man
uscr
ipt
A
uthor Man
uscr
ipt
A
uthor Man
uscr
constructed corresponding sample-by-isoform matrices for all subsequent data processing and analysis (see “Isoform-level normalization and analysis” below).
In addition, Cufflinks version 2.1.1 was applied to the BAM files to estimate both gene- and isoform-level FPKM values for all Ensembl genes and isoforms. Separately, Cufflinks was applied to the BAM files to assemble isoforms for each sample. These assembled isoforms were unified across samples using Cuffmerge, resulting in a single GTF file of “merged” genes and isoforms annotated by Ensembl annotations. Cufflinks was then applied to this GTF file to estimate both gene- and isoform-level FPKM values for all merged genes and isoforms.
RAPID RNA-seq pipeline
To robustly facilitate the large-scale nature of the RNA-seq data processing described above for ~600 samples, we utilized RAPiD, an efficient and dependable RNA-seq pipeline manager that automates read alignment, quality control, and quantitative analyses of next-generation sequencing gene expression experiments. By closely integrating with the Apollo framework, RAPiD utilizes high-performance computing clusters and provides pipeline monitoring so that RAPiD runs are automatically tracked, QCd, and visualized on the Apollo Run Console web interface. Of note, RAPiD is designed to be an agile framework that is user-configurable via JSON-formatted “recipes” that define the set of tools and algorithms, and corresponding parameters, for running various pipelines. Thus, in this work, RAPiD easily permitted the addition of alternative splicing analyses by running MISO and custom post-processing of MISO results
Normalization of Gene Expression and Adjustment for Covariates
Gene-level analyses started with the HTSeq-derived sample-by-gene read count matrix. The basic normalization and adjustment pipeline for the expression data matrix (Supplementary Fig. 2, middle and bottom panels) consisted of: a) exploration to determine which known and hidden covariates should be accounted for during analyses; b) voom-based calculation of normalized log(CPM) (read counts per million total reads), along with weights that estimate the precision of each log(CPM) observation estimate68 c) linear regression-based adjustment for the chosen covariates, where linear regression for each gene is performed independently and using the observation weights, so that observations with higher presumed precision will be up-weighted in the linear model fitting process (i.e., weighted least squares regression). We now detail the procedure involved for each of the above steps, where we include both SCZ and AFF cases and controls, and the corresponding diagnosis status (“Dx”) is the primary variable of interest.
Initial normalization of read counts—To define the set of covariates for adjustment, we start by initially normalizing the HTSeq read count matrix for all 56,632 Ensembl genes, using voom without covariates. Next, we filtered out all genes with lower expression in a substantial fraction of the cohort, with 16,423 genes remaining with at least 1 CPM in at least 50% of the individuals; note that only these genes were carried forward into all subsequent analyses. This initially-normalized gene expression matrix was then used to select known covariates (described above). Next, hidden covariates were derived (for use in