Systems/Circuits
Nucleus Accumbens Core and Shell Differentially Encode
Reward-Associated Cues after Reinforcer Devaluation
Elizabeth A. West and Regina M. Carelli
Department of Psychology and Neuroscience, University of North Carolina, Chapel Hill, North Carolina 27599
Nucleus accumbens (NAc) neurons encode features of stimulus learning and action selection associated with rewards. The NAc is
necessary for using information about expected outcome values to guide behavior after reinforcer devaluation. Evidence suggests that
core and shell subregions may play dissociable roles in guiding motivated behavior. Here, we recorded neural activity in the NAc core and
shell during training and performance of a reinforcer devaluation task. Long–Evans male rats were trained that presses on a lever under
an illuminated cue light delivered a flavored sucrose reward. On subsequent test days, each rat was given free access to one of two
distinctly flavored foods to consume to satiation and were then immediately tested on the lever pressing task under extinction conditions.
Rats decreased pressing on the test day when the reinforcer earned during training was the sated flavor (devalued) compared with the test
day when the reinforcer was not the sated flavor (nondevalued), demonstrating evidence of outcome-selective devaluation. Cue-selective
encoding during training by NAc core (but not shell) neurons reliably predicted subsequent behavioral performance; that is, the greater
the percentage of neurons that responded to the cue, the better the rats suppressed responding after devaluation. In contrast, NAc shell
(but not core) neurons significantly decreased cue-selective encoding in the devalued condition compared with the nondevalued
condi-tion. These data reveal that NAc core and shell neurons encode information differentially about outcome-specific cues after reinforcer
devaluation that are related to behavioral performance and outcome value, respectively.
Key words:
accumbens; behavior; devaluation; electrophysiology; motivation; rat
Introduction
Animals depend on the ability to modify their behavior to achieve
specific outcomes. Because a behavior that once produced a
pos-itive outcome can later produce a negative outcome, it is
impor-tant to be able to adjust behavior flexibly. Certain psychiatric
disorders (e.g., drug addiction) are characterized by a disruption
in this type of flexibility (Lubman et al., 2004;
Lucantonio et al.,
2012), leading to difficulty in changing behaviors despite negative
consequences. Characterizing the underlying processes that
con-trol/modulate behavioral flexibility is therefore critical to
under-standing and treating these disorders.
Behavioral flexibility can be measured using reinforcer
deval-uation tasks in which the expected value of a reward is decreased.
There are several necessary processes to perform this task: (1)
forming an association between a cue and an outcome, (2)
regis-tering the decreased value of the reinforcer after its
devalua-tion, and (3) integrating the learned cue– outcome association
with the decreased outcome value to direct behavior.
Impor-tantly, testing is performed under extinction, so rats must use
an internal representation of the previously learned
associa-tion and alter behavior based on the newly computed expected
outcome (Murray and Izquierdo, 2007;
Murray et al., 2007;
Lucantonio et al., 2014).
Received Aug. 6, 2015; revised Nov. 13, 2015; accepted Dec. 5, 2015.
Author contributions: E.A.W. and R.M.C. designed research; E.A.W. performed research; R.M.C. contributed un-published reagents/analytic tools; E.A.W. and R.M.C. analyzed data; E.A.W. and R.M.C. wrote the paper.
This work was supported by National Institute on Drug Abuse (Grant DA037733 to E.A.W. and Grant DA034021 to R.M.C.). We thank Elina Thomas and Fei Fei Wang for technical assistance and Michael Saddoris, Travis Moschak, and Seth Hurley for reviewing early drafts of this manuscript.
The authors declare no competing financial interests.
Correspondence should be addressed to Dr. Regina M. Carelli, Department of Psychology and Neuroscience, CB#3270 Davie Hall, University of North Carolina, Chapel Hill, NC 27599. E-mail:[email protected].
DOI:10.1523/JNEUROSCI.2976-15.2016
Copyright © 2016 the authors 0270-6474/16/361128-12$15.00/0
Significance Statement
Although the prefrontal cortex has largely been implicated in
behavioral flexibility as measured by reinforcer devaluation
(Murray et al., 2007;
McDannald et al., 2014), less is known about
the involvement of subcortical regions such as the nucleus
ac-cumbens (NAc) in this process. The NAc is postulated to
func-tion as a limbic–motor interface (Mogenson et al., 1980),
receiving value information from limbic (and prefrontal)
struc-tures and projecting to motor regions to guide behavior. In
sup-port, NAc neurons encode associative information about
outcome-predictive cues (Carelli, 2000,
2004;
Day et al., 2006;
Day and Carelli, 2007;
Day et al., 2007) and actions (Carelli and
Ijames, 2000,
2001;
Hollander et al., 2002). Furthermore, NAc
neurons encode the devaluation of natural reinforcers after
con-ditioned taste aversion (Roitman et al., 2010) and delayed cocaine
access (Wheeler et al., 2008). In addition, when rats choose
be-tween predictors of differently valued rewards, NAc neurons
en-code information regarding the relative outcome values and
behavioral responses (Roesch et al., 2009;
Day et al., 2011;
Sugam
et al., 2014). Finally, NAc lesions disrupt performance in
rein-forcer devaluation tasks (Corbit et al., 2001;
Lex and Hauber,
2010;
Singh et al., 2010).
Despite its role in processing value-based associative
informa-tion, less is known about whether NAc neurons track cue–
out-come associations under changing conditions. In prior reports,
cues were consistently followed by outcomes (i.e., not under
ex-tinction), allowing rats to alter behavior based on previously or
newly acquired value representations. Therefore, it is not known
how NAc neurons encode outcome-predictive information
based on a newly computed expected (decreased) outcome value.
Furthermore, evidence suggests that the NAc core and shell may
play unique roles in guiding motivated behavior. For example,
the core appears to be involved in learning and action during
goal-directed behavior (Carelli, 2004;
Saddoris et al., 2013),
whereas the shell processes hedonic or motivational value
(Kel-ley, 2004;
Zorrilla and Koob, 2013;
Castro et al., 2015;
Saddoris et
al., 2015a). Both computational processes are likely necessary for
flexible behavior.
Here, we used a reinforcer devaluation task in which the
reward-predictive cue and subsequent action are always paired
with the same outcome, but the expected outcome value was
later manipulated by satiation. This allowed us to determine
whether NAc neurons integrate cue– outcome associations with
the changed outcome value even though the animal never
expe-rienced the cues paired with that outcome in their devalued
state. We recorded NAc core and shell
neurons during a well learned task and
after devaluation of the reinforcer via
selective satiation (under extinction).
Given the putative roles of the NAc core
in learning and the NAc shell in
motiva-tional value encoding, we hypothesized
that the neural encoding in the core
dur-ing the task would predict the degree of
behavioral flexibility after devaluation,
whereas shell neurons would encode the
motivational change in outcome value
after devaluation.
Materials and Methods
Subjects
Twenty-six male Long–Evans rats (Charles River Laboratories) 90 –120 d of age and weighing⬃300 –350 g at the beginning of the study were used. Animals were housed individ-ually in polypropylene cages and maintained on a standard 12:12 h light/ dark cycle with lights on at 7:00 A.M. Food and water were availablead libitumduring the 1 week adaptation period to the vivarium before be-havioral training. During bebe-havioral training, rats were restricted to no less than 90% of their preoperative body weight by food access to 20 –25 g of standard rat chow (Purina RMH3000) per day. Animal procedures were approved by the University of North Carolina at Chapel Hill Insti-tutional Animal Care and Use Committee.
Preoperative behavioral training
Training and testing were done in Med Associates operant chambers, as described previously (Hollander et al., 2002;Day et al., 2006; Cacciapa-glia et al., 2011;Day et al., 2011). Behavioral training was modified from a previously described task (West et al., 2011b;West et al., 2012;West et al., 2013) and is depicted inFigure 1A. During lever training, rats initially had to press a single lever for a food pellet and were then trained to press a second lever in the chamber in the same manner (the levers were lo-cated on the left and right sides of the food receptacle). Next, they pro-gressed to an FR5 schedule on the 2 spatially distinct levers (⬃1–2 weeks training). Subsequently, during cue training, a cue light was illuminated over 1 of the 2 levers and, after 5 s, the lever under that cue light was extended into the chamber (the other cue light/lever remained off/retracted). The rats were required to press the active lever to receive a specific reinforcer (e.g., raspberry-flavored sucrose pellet; Purina TestDiet) on an FR5 schedule. After the rat pressed 5 times or 30 s elapsed, the active lever retracted until the next trial was initiated. The intertrial interval was 50 s for all cue training sessions. The position of the active cue light/lever alternated for each trial pseudorandomly. Rats con-tinued on the FR5 schedule until they received a reinforcer on at least 90% of the trials (at least 45 of 50 trials) in two consecutive daily test sessions. Once the rats reached this criterion, they were moved to a VR9 schedule in which they had to press, on average, 9 times to receive a reinforcer (VR range 4 –13) on the active lever. Once rats earned at least 45 reinforcers over 45 min (50 possible trials) on the VR9 schedule (3–10 d), they underwent surgical procedures for electrophysiology microwire implantation (described below). On every cue training session, rats also received an equal amount of a second (i.e., different) reinforcer in their home cages (e.g., peanut-butter-flavored pellet; Purina Test Diet) at least 2 h after they completed cue training for that day. This ensured that all rats had equal experience with both reinforcers. Reinforcers were coun-terbalanced across rats such that half the rats received raspberry-flavored pellets during training (and peanut-butter-flavored pellets in their home cages) and the other half received peanut-butter-flavored pellets during training (and raspberry-flavored pellets in their home cages).
Surgery
Rats were anesthetized with a ketamine hydrochloride (100 mg/kg) and xylazine hydrochloride (10 mg/kg) mixture (intramuscularly) and
planted with a microwire electrode arrays aimed at the NAc core or shell. Each array was custom designed, purchased from a commercial source (NB Labs) and described in detail previously (Carelli et al., 2000). Briefly, arrays consisted of 8 microwires (50m diameter) and were perma-nently implanted in the NAc core (AP:⫹1.8, ML:⫾1.3, DV:⫺6.2 from dura) or shell (AP:⫹1.8, ML:⫾0.8, DV:⫺6.2 from dura).
Postoperative behavioral training and testing
After at least 7 d of recovery, rats resumed cue training (⬃1–5 d). Once rats earned at least 45 reinforcers on the VR9 schedule during cue train-ing, NAc cell firing was recorded during the final day of cue training before testing and during two subsequent devaluation test days (Fig. 1A). The devaluation test days were divided in two distinct phases as shown in Figure 1B. In the first phase (satiation), rats receivedad libitumaccess for 20 –30 min of either the same reinforcer received during training (deval-ued) or the other reinforcer (nondeval(deval-ued) immediately before testing to achieve outcome-selective satiation. In the second phase (testing under extinction), rats were allowed to lever press for 20 trials using the same cues as training except no reinforcers were delivered. That is, in this test session, the cue light was illuminated and, after 5 s, the lever extended into the operant chamber as in training except no reinforcer was deliv-ered when rats pressed. Rats were tested on an FR9 schedule to ensure each trial would contain the same number of lever presses before the lever retracted. After at least 48 h and one cue training reminder session, the same test was repeated except that the other reinforcer was consumed before testing. The order of reinforcer was counterbalanced so that half of the rats were sated on the different reinforcer (nondevalued) on the first devaluation test day and the other half were sated on the same reinforcer (devalued) on the first devaluation test day.
Consummatory test
Once rats finished testing in the operant chambers (at least 2 d after the last test day), they were given a consummatory session as a test for successful devaluation of the reinforcer (Fig. 1A). Specifically, rats were allowed 20 –30 min to eat one of the foods (training reinforcer or different reinforcer)ab libitumin an empty standard rat cage. After selective satiation, rats were given access to both reinforcers for 20 min and the amount of each reinforcer consumed was recorded. At least 48 h later, the same test was repeated but the other reinforcer was devalued.
Electrophysiological recordings
Electrophysiological procedures have been described in detail previously (Day et al., 2011). Before the start of each session, the subject was con-nected to a flexible recording cable attached to a commutator (Med Associates), which allowed virtually unrestrained movement within the chamber. The head stage of each recording cable contained 16 miniature unity-gain field effect transistors. Neurons were recorded differentially between each active and the inactive (reference) electrode from the per-manently implanted microwires. The inactive electrode was examined before the start of the session to verify the absence of neuronal spike activity and served as the differential electrode for other electrodes with cell activity. Online isolation and discrimination of neuronal activity was accomplished using a commercially available neurophysiological system [multichannel acquisition processor (MAP) system; Plexon). Multiple window-discrimination modules and high-speed analog-to-digital sig-nal processing in conjunction with computer software enabled isolation of neuronal signals based on waveform analysis. The neurophysiological system incorporated an array of digital signal processors (DSPs) for con-tinuous spike recognition. The DSPs provided a concon-tinuous parallel dig-ital output of neuronal spike events to a Pentium computer. Another computer processed operant chamber input and output (Med Associ-ates) and sent digital outputs corresponding to each event to the MAP box to be time stamped along with the neural data. Discrimination of individual waveforms began by setting a threshold level (well above back-ground noise) for each wire. Units detected had to display peak voltage at least 20% greater than baseline. Individual waveforms corresponding to a single cell were discriminated using template analysis procedures and time–voltage boxes provided by the neurophysiological software system (MAP system; Plexon). Cell recognition and sorting was finalized after
the experiment using the Offline Sorter program (Plexon). This allowed neuronal data to be further assessed based on the principle component analysis of the waveforms, cell firing characteristics such as autocorrelo-grams and interspike interval distribution to ensure that putative cells showed biologically appropriate firing refractory periods, and cross-correlograms to ensure that multiple cells recorded on the same wires showed firing independently of each other.
Data analysis
Behavior. The total number of lever presses after consumption of the same reinforcer received during training (same, devalued) was compared with lever presses after the consumption of the second reinforcer (differ-ent, nondevalued) using a Wilcoxon matched-pairs signed-rank test for all of the animals. The mean number of trials in which the rats lever pressed and the mean latency to press after consumption of the same reinforcer received during training (same, devalued) was compared after the consumption of the other reinforcer (different, nondevalued) using a Wilcoxon matched-pairs signed-rank test for all of the animals. To de-termine whether behavior was similar in animals from which core and shell recordings were made during the reinforcer devaluation task, the number of lever presses after selective satiation was analyzed using a two-way ANOVA with subregion (core, shell, both) and devaluation status (devalued vs nondevalued) as factors. “Both” refers to instances in which electrodes were placed in both the core (one side of brain) and shell (other side) in a single animal.
Further, we calculated a “devaluation index” according to the follow-ing formula: [responses after the satiation of the different reinforcer (nondevalued; ND) minus responses after satiation of the same rein-forcer (devalued; D)/total responses (ND⫹D)]. A devaluation index of 1 indicates that all of the presses were under the nondevalued condition, 0 represents equal number of presses under the nondevalued and deval-ued conditions, and⫺1 indicates all of the presses were under the deval-ued condition. Therefore, based on this formula, the greater the rat suppressed responding in the devalued condition (but continued re-sponding in the nondevalued condition), the closer the value would be to 1. The ability to suppress responding represents flexible behavior, so values⬎0 would represent flexible behavior. We used these values to correlate the strength of the devaluation effect with the percentage of NAc encoding during cue training, nondevalued test day, and the deval-ued test day (see below).
For the consummatory test, we averaged the amount of food (g) each animal ate in the two test sessions based on whether the food was the same food the rat had just consumed (devalued) or a different food (nondevalued) and analyzed these values across rats using a Wilcoxon matched-pairs signed-rank test. Behavioral data analyses were per-formed using GraphPad Prism software.
and inhibitions within the same epoch were classified by the response that was most proximal to the event.
The percentage of phasic cells that responded to the cue presentation in the NAc core or shell in each individual animal were calculated during the training day and correlated with the animals’ subsequent test day performance as measured by the devaluation index (see above). Only animals with at least four cells recorded in each region were included in this analysis (core:n⫽13 rats, shell:n⫽11 rats). We also examined the percentage of phasic cells that responded to the cue in both devaluation test days (see above) and analyzed these data using a two-way ANOVA with regions (core vs shell) and devaluation status (nondevalued vs de-valued) as the factors. Only animals with at least four cells recorded in each region were included in this analysis for both the nondevalued (core:n⫽12 rats, shell:n⫽14 rats) and devalued condition (core:n⫽
14 rats, shelln⫽14 rats). We also correlated the percentage phasic responsiveness for these animals and compared it to the devaluation indices for these animals. Further, differences in the proportion of neu-ronal responses to cue onset (nonphasic, excitation, inhibition) across the last day of training (i.e., before devaluation) and the 2 test days (devalued vs nondevalued) for both core and shell subregions were ex-amined using a2test using a 3⫻3 design (nonphasic, excitation,
inhibition vs before devaluation, nondevalued, devalued). To determine whether there were differences in firing rates between nondevalued and devalued conditions in the NAc core, we examined the average neural firing rates for cells that were classified as excitations or inhibitions. Specifically, the average firing across all trials for each cell was grouped into 200 ms bins and then the average firing and SD were taken for each cell’s 10 s baseline period. Each bin was thenz-normalized by subtracting the average baseline firing rate from the firing rate in each 200 ms bin, divided by the SD as described previously (Sugam et al., 2014). We then examined thez-normalized neural firing rate during in the NAc core for cells that were classified as either excitations or inhibitions (see above) using a two-way repeated-measures ANOVA with time (200 ms bins spanning from⫺10 before cue onset through 10 s after cue onset) and devaluation status (before devaluation, nondevalued vs devalued) as the factors. To determine whether differences in neural signaling are ob-served across responding (press vs no press), we examined the strength of neural firing for trials in which rats pressed and compared it with trials in which they did not. Here, the average firing rate during cue presentation (within 2 s of cue onset) was compared with baseline (2 s before cue onset) using a two-way repeated-measures ANOVA with time period (baseline vs cue presentation) and devaluation status (nondevalued vs devalued) as factors for the trials in which the animals pressed. The same analysis was completed for the trials in which animals did not press. This specific analysis was done for core neurons only because there were not enough cells in the shell that responded to the cue in the devalued con-dition (n⫽2 excitations andn⫽3 inhibitions) to interpret the data. In the shell, the average firing rate during cue presentation (within 2 s of cue onset) was compared with baseline (2 s before cue onset) using a two-way repeated-measures ANOVA with time period (baseline vs cue presenta-tion) and press status (press vs no press) as factors for cells that show excitations or inhibition in either test day (i.e., nondevalued or deval-ued). Further analysis examined the peak or trough (excitations and inhibitions, respectively) firing rate during cue presentation (within 2 s of cue onset) compared with baseline (2 s before cue onset) using a two-way repeated-measures ANOVA with time period (baseline vs cue presentation) and devaluation status (nondevalued vs devalued) as fac-tors. Last, differences in the proportion of neuronal responses to the first lever press in the FR9 series (nonphasic, excitation, inhibition) across the two test days (devalued vs nondevalued) for both core and shell subre-gions were examined using a2test in animals that responded on at least
three trials on the test session. Therefore, we were able to do this analysis in 21 of 26 rats when the rats ate the same reinforcer before testing (devalued) an in 25 of 26 rats when rats ate the different reinforcer before testing (nondevalued). Statistical analyses of neural data were done using GraphPad Prism software.
Histology
Upon completion of the experiment, rats were deeply anesthetized with an intraperitoneal injection of a ketamine and xylazine mixture (100 and 10 mg/kg, respectively). A 13.5A current was passed through each microwire electrode for 5 s to mark the placement of electrode tips. Transcardial perfusions were then performed using physiological saline and 3% potassium ferricyanide in 10% formalin and brains were re-moved. After postfixing and freezing, 40m coronal brain sections were mounted. The addition of potassium ferricyanide allowed for a blue reaction corresponding to the location of the electrode tip, which was viewed under a 1⫻microscope lens. Placement of an electrode tip within the NAc core or shell was determined by examining the relative position of observable reaction product to visual landmarks and anatomical or-ganization of the NAc in accordance withPaxinos and Watson (2005).
Results
Distribution of neuronal recordings in the NAc core and shell
A total of 484 cells were recorded in the NAc core or shell from 26
animals. Of 484 neurons, 159 cells were recorded during cue
training (core
⫽
80 and shell
⫽
79), 160 cells were recorded on a
test day after satiation of the same reinforcer earned during
train-ing (devalued; core
⫽
85 and shell
⫽
75), and 165 cells were
recorded on a test day after the satiation of a different reinforcer
(nondevalued; core
⫽
79 and shell
⫽
86).
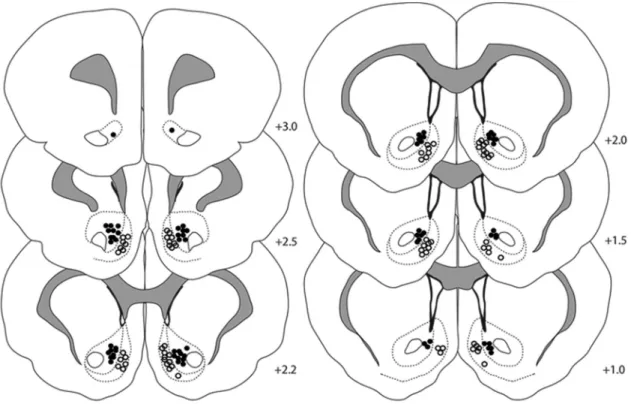
Figure 2
shows the
histological distribution of electrode placements from which
neurons were recorded in each NAc subregion.
Rats decrease responding in operant and consummatory tests
after devaluation
After rats were trained to press a lever under an illuminated cue
light for a distinct palatable reinforcer, they were fed either the
same reinforcer received in training or a different reinforcer
ad
libitum
before behavioral testing. To prevent rats from
experienc-ing the current value of the food reinforcer in the presence of the
cues, the test was conducted under extinction (i.e., no pellets were
delivered during the test). Therefore, the now-devalued
rein-forcer was not experienced during testing and a behavioral
sup-pression of responding represents successful integration of the
previously learned associations with the altered (decreased)
rein-forcer value. During testing, as shown in
Figure 3
A
, rats pressed
significantly less (
W
⫽ ⫺
162,
p
⬍
0.05) when they were sated on
the same reinforcer earned during training (devalued, gray bar)
than when they were sated on the different reinforcer
(nondeval-ued, black bar). Importantly, the behavior across these groups did
not differ as a function of distribution of neurons recorded across
core and shell. Specifically, a two-way ANOVA with subregion
(core, shell, or both) and devaluation status (nondevalued vs
devalued) as factors revealed a significant difference in
devalua-tion status (
F
(1,23)⫽
6.4,
p
⬍
0.05), but no difference across
subregions (
F
(2,23)⫽
2.03) and no interaction (
F
(2,23)⫽
0.48).
Furthermore, rats pressed on more trials in the nondevalued
con-dition (10.7
⫾
1.03) compared with the devalued condition
(8.0
⫾
0.97;
W
⫽ ⫺
146
p
⬍
0.05). In addition, the average latency
to press was less in the nondevalued condition (5.71
⫾
0.74)
compared with devalued condition (7.89
⫾
1.02;
W
⫽
154,
p
⫽
0.05)
in 24 of 26 rats (2 rats did not press in the devalued condition).
had just eaten (devalued, gray bar) than the different food
(non-devalued, black bar).
Neural encoding during training in the NAc core, but not
shell, predicts behavioral flexibility as measured by
devaluation
In order for rats to appropriately suppress responding to the cue
after devaluation of a specific reinforcer, the appropriate cue–
outcome association must be established during training.
There-fore, we investigated whether neural encoding during the first
recording session (i.e., the last day of training) correlated with
behavioral performance on the subsequent test sessions
(nondeval-ued vs deval(nondeval-ued). To achieve this goal, we analyzed the percentage of
neurons that showed phasic responsiveness to the cue for each
individual animal and correlated the amount of NAc encoding
with that animal’s devaluation index (see above). Specifically,
during recording session 1, distinct populations of neurons
ex-hibited either an increase (Fig. 4
A
, top; excitation, termed Cue
exc)
Figure 2. Histological verification of recording array wires in the NAc core and shell. Filled circles indicate electrode locations in the NAc core and open circles indicate electrode locations in the shell. The numbers represent distance in millimeters from bregma. Of the 26 rats used in this study, 8 were implanted with wires in the NAc core, 9 were implanted with wires in the NAc shell, and 9 were implanted in both (i.e., wires on each side).
or decrease (Fig. 3
A
, bottom; inhibition, termed Cue
inh) in firing
rates during cue presentation and thus were classified as “phasic”
to the cue. Importantly, we showed that a positive correlation
exists between the percentage of phasic cells (inhibitions and
excitations) in the NAc core that encoded the cue and behavioral
performance as measured by devaluation indices (
R
2⫽
0.50,
p
⬍
0.01;
Fig. 4
B
). That is, rats with more robust encoding of cues
during training showed greater ability to stop responding when
the same reinforcer was sated (devalued) although they
contin-ued to respond when the different reinforcer was sated
(nonde-valued). Therefore, the rats with the greater cue encoding during
training were able to flexibly alter behavior more readily.
Impor-tantly, the percentage of neurons that show cue encoding in NAc
core during training predicts individual differences in behavioral
flexibility as measured by reinforcer devaluation. We performed
the same analysis for NAc shell neurons and found no correlation
between the percentage of phasic neurons during training and
behavioral performance (
R
2⫽
0.03,
p
⫽
0.6;
Fig. 4
C
).
These data suggest that the extent to which neurons in the
NAc core encode information about the cue during training
pre-dicts the ability of rats to use the previously learned cue– outcome
associations to flexibly alter behavior after outcome devaluation
during testing. Critically, whereas the NAc shell also encodes
in-formation about the cue, the amount of neural encoding that is
processed in the shell during training does not predict behavioral
performance during testing.
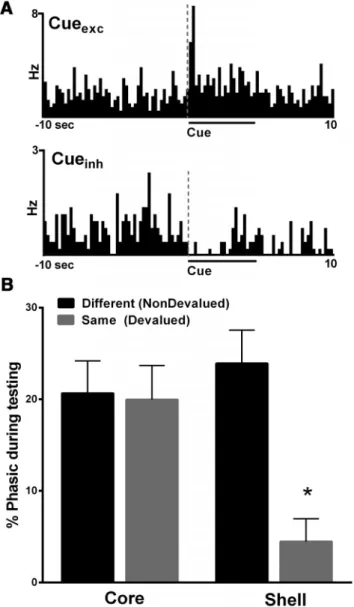
Decreased neural encoding in the NAc shell, but not core,
after devaluation
Another goal of the present study was to determine whether
neu-rons in NAc subregions (core and shell) differentially encode
information about reward-associated cues after the reward is
de-valued. We found that there was a decrease in the percentage of
phasic cells in the NAc shell, but not the core, when rats
con-sumed the same reinforcer (devalued) before testing compared
with the different (nondevalued) reinforcer. Specifically, during
both devaluation test days (nondevalued vs devalued), distinct
populations of neurons exhibited either an increase (Fig. 5
A
, top;
excitation, termed Cue
exc) or decrease (Fig. 5
A
, bottom; inhibition,
termed Cue
inh) in firing rates during cue presentation and thus were
classified as “phasic” to the cue. We analyzed the percentage of
pha-sically active cells (including both excitations and inhibitions) in
each individual animal and examined how the mean percentage of
phasic cells changed as a function of devaluation (nondevalued vs
devalued) and subregion (core vs shell). There were no differences in
the percentage of phasic neurons in the core in the nondevalued and
devalued conditions (Fig. 5
B
, left). Interestingly, the mean
percent-age of phasic neurons in the NAc shell after satiation of the same
reinforcer received during training (devalued) was significantly less
compared with the percentage of phasic neurons after the satiation
of a different (nondevalued) reinforcer (Fig. 5
B
, right). Specifically, a
two-way ANOVA showed a trend toward a significant effect of
re-gion (core vs shell,
F
(1,50)⫽
3.3,
p
⫽
0.07), a significant effect of
devaluation status (nondevalued vs devalued,
F
(1,50)⫽
8.8,
p
⬍
0.01), and a significant devaluation status by region interaction
(
F
(1,50)⫽
7.7,
p
⬍
0.01).
Post hoc
(Tukey’s multiple-comparison test)
showed that the percentage of phasic neurons in the NAc shell in the
devalued condition was significantly less than all other groups (i.e.,
shell-nondevalued (
p
⬍
0.001), core-nondevalued (
p
⬍
0.01), and
core-devalued (
p
⬍
0.01), whereas no other groups were different
from each other (all
p
⬎
0.1).
We also analyzed the percentage of neurons that showed
pha-sic responsiveness to the cue for each individual animal during
Figure 4. Percentage of neurons that show cue encoding in NAc core during training predictsthe devaluation test days (nondevalued and devalued) and
corre-lated the amount of NAc encoding with that animal’s devaluation
index. No significant correlations were found between the
per-centage of phasic cells (inhibitions and excitations) in the NAc
core that encoded the cue and behavioral performance as
mea-sured by devaluation indices on the nondevalued test day or the
devalued test day (nondevalued:
R
2⫽
0.12,
p
⬎
0.10; devalued:
R
2⫽
0.05,
p
⬎
0.10). Likewise, no significant correlations were
observed between the percentage of phasic cells in the shell that
encoded the cue and devaluation indices on either test day
(non-devalued:
R
2⫽
0.04,
p
⬎
0.10; devalued:
R
2⫽
0.19,
p
⬎
0.10).
Magnitude of firing rate in the NAc core does not differ as
function of devaluation
The above findings show the neural encoding of reinforcer
deval-uation is specific to the shell. However, previous studies have
shown enhanced firing rates in the NAc core when rats chose
preferred options (Sugam et al., 2014). Therefore, even though
the percentage of phasic neurons does not change in the NAc core
after the reinforcer devaluation noted above, it is possible that
this information is encoded in the magnitude profile of neural
firing. That is, the percentage of cells that encode devaluation
may not vary in the core, but the strength of each phasic response
may differ across nondevalued or devalued conditions. To test
this possibility, the magnitude of phasic neural encoding during
cue presentation was analyzed when the rats received the same
reinforcer (devalued) or different reinforcer (nondevalued) on
the test day, as well as before devaluation (during training).
Im-portantly, this was determined for both cue excitations (the peak
of the neural response) and inhibitions (the trough of the neural
response). For neurons showing an excitatory response profile
(Fig. 6
A
), a two-way repeated-measures ANOVA revealed a
sig-nificant main effect of time (
F
(99,2475)⫽
6.2,
p
⬍
0.0001), no
significant main effect of devaluation status (
F
(2,25)⫽
0.72,
p
⬎
0.10). and no significant interaction (
F
(198,2475)⫽
0.71,
p
⬎
0.10).
Further, we compared the greatest peak firing for each cell
clas-sified as excitation (within 2 s of cue onset) with baseline for the
nondevalued and devalued conditions (Fig. 6
B
). A two-way
repeated-measures ANOVA revealed a significant difference
main effect of time (cue presentation and baseline;
F
(1,25)⫽
92.0,
p
⬍
0.0001), no difference between devaluation status (
F
(2,25)⫽
1.1,
p
⬎
0.10), and no interaction effect (
F
(2,25)⫽
1.2,
p
⬎
0.10).
For inhibitory cells, a two-way repeated-measures ANOVA
revealed a significant main effect of time (
F
(99,2277)⫽
4.5,
p
⬍
0.0001), no main effect of devaluation status (
F
(2,23)⫽
2.0,
p
⬎
0.10), but a significant interaction effect (
F
(198,2277)⫽
1.5,
p
⬍
0.0001).
Post hoc
analysis revealed that the before devaluation
condition was significantly different from the nondevalued and
devalued tests specifically 3 s past cue onset. We also compared
the lowest trough firing (within 2 s of cue onset) with baseline for
the before devaluation, nondevalued, and devalued conditions
(Fig. 6
D
). A two-way repeated-measures ANOVA revealed a
significant difference between cue presentation and baseline
(
F
(1,23)⫽
125,
p
⬍
0.0001) but no difference between devaluation
status (
F
(2,23)⫽
1.0,
p
⬎
0.10) and no interaction effect (
F
(2,23)⫽
0.3,
p
⬎
0.10). Note that the above analysis shown in
Figure 6
was
completed for neurons in the NAc core. The low number of
neu-rons in the NAc shell that responded to the cue in the devalued
condition (i.e.,
n
⫽
2 excitations and
n
⫽
3 inhibitions)
pre-cluded the same analysis for this subregion.
Inhibitions, but not excitations, in the core and shell are
sensitive to lever press responding during extinction
Here, we examined NAc core neurons that exhibited phasic firing to
the cue on the nondevalued and devalued test days when the animals
pressed the lever and when they did not. For neurons showing an
excitatory response profile, a two-way repeated-measures ANOVA
revealed a significant main effect of time whether the animals pressed
the lever (
F
(1,13)⫽
10.2,
p
⬍
0.001) or did not (
F
(1,14)⫽
6.1,
p
⬍
0.05), no significant main effect of devaluation status (press:
F
(1,13)⫽
0.09,
p
⬎
0.10, no press:
F
(1,14)⫽
0.05,
p
⬎
0.10), and no significant
interaction (press:
F
(1,13)⫽
0.50,
p
⬎
0.10, no press:
F
(1,14)⫽
0.003,
p
⬎
0.10). For neurons showing an inhibitory response profile, a
two-way ANOVA revealed a main effect of time when the animals
pressed (
F
(1,19)⫽
6.5,
p
⬍
0.05), but not when they did not (
F
(1,19)⫽
0.01,
p
⬎
0.10), and no main effect of devaluation status (press:
F
(1,19)⫽
0.44,
p
⬎
0.10, no press:
F
(1,19)⫽
0.94,
p
⬎
0.10) and no
interaction effect (press:
F
(1,19)⫽
0.57,
p
⬎
0.10, no press:
F
(1,14)⫽
0.94,
p
⬎
0.10).
Figure 5. Encoding of cue-related information is significantly altered in the NAc shell, butFinally, we also analyzed shell neural activity when the animals
pressed versus when they did not. For cells classified as
excita-tions, a two-way ANOVA revealed a main effect of time (
F
(1,9)⫽
19.72,
p
⬍
0.01), no main effect of press status (
F
(1,9)⫽
0.23,
p
⬎
0.10), and no interaction (
F
(1,9)⫽
0.11,
p
⬎
0.10). For cells that
were classified as inhibitions, a two-way revealed no main effect of
time (
F
(1,12)⫽
0.38,
p
⬎
0.10) or press status (
F
(1,12)⫽
0.66,
p
⬎
0.11), but there was an interaction effect (
F
(1,12)⫽
6.9,
p
⬍
0.05).
Post
hoc
analysis (Tukey’s test) revealed a significant difference between
baseline and cue presentation when the animals pressed (
t
⫽
2.5,
p
⬍
0.05), but no difference between baseline and cue presentation when
the animals did not (
t
⫽
1.03,
p
⬎
0.1). These data suggest that
excitations in both the core and shell are not affected by whether the
animal pressed under our behavioral conditions, whereas
inhibi-tions in cell firing in the core and shell are both subject to changes
based on whether the animal lever pressed.
Decreased neural encoding to the cue in the NAc shell
consists of both inhibitions and excitations
Next, we determined the population profile of all phasic cells
(excitations or inhibitions) that responded to the cue in the NAc
core and shell before and after reinforcer devaluation. Here, we
investigated whether the proportion of cells that were classified as
Cue
exc, Cue
inh, or nonphasic for each subregion differed as
func-tion of devaluafunc-tion status (before devaluafunc-tion, nondevalued, and
devalued). In the core, there were no differences in the
propor-tion of cells that displayed phasic changes (excitapropor-tions and
inhi-bitions) to the cue on the last day of cue training [before
devaluation, 12 excitations (15%) and 5 inhibitions (6.0%) of 80
total] or after rats were sated on the same reinforcer they earned
during training [devalued, 9 excitations (12.5%) and 10
inhibi-tions (11.5%) of 79 total] or a different reinforcer [nondevalued,
7 excitations (8%) and 11 inhibitions (13%) of 85 total], as shown
in
Figure 7
A
(
共24兲⫽
3.871;
p
⫽
0.42). In contrast, the proportion
of NAc shell cells that displayed phasic changes (excitations and
inhibitions) during cue presentation was significantly decreased
when rats were sated on the same reinforcer that they earned
during training [devalued, 2 excitations (2.5%) and 3 inhibitions
(3.5%) of 77 total] compared with a different reinforcer
[nonde-valued, 9 excitations (10.5%) and 13 inhibitions (15%) of 86
total] or the last day of training [before devaluation, 14
excita-tions (18%), and 9 inhibiexcita-tions (11%) of 79 total], as shown in
Figure 7
B
(
共24兲⫽
16.6,
p
⬍
0.01). These data show that the
num-ber of cells that respond to the cue (both inhibitions and
excita-tions) after devaluation of that reward decreases in the shell, but
not the core. Therefore, these results suggest that the NAc core
does not encode the cue presentation differently when the value
of the reward previously associated with that cue is decreased;
that is, the neurons encode information about learned cue
asso-ciations, but do not change as a function of devaluation. In
con-trast, NAc shell neurons dynamically encode information about
the cue with regard to the altered outcome value after devaluation
(i.e., the number of cells that respond to cue decreases when the
outcome it predicts is devalued).
Reinforcer devaluation does not affect neural activity at the
time of the response
Next, we determined the population profile of all phasic cells
(excitations or inhibitions) in the NAc core and shell that
re-sponded to the first lever press across trials in which the animal
pressed in both the nondevalued and devalued condition (Table
1). Specifically, we investigated whether the proportion of cells
that were classified as an excitation, inhibition, or nonphasic for
each NAc subregion differed as function of devaluation status. In
the NAc core and shell, there were no differences in the
propor-tion of cells that displayed phasic changes (excitapropor-tions and
inhi-bitions) to the lever press whether rats were sated on the same
reinforcer they earned during training or a different reinforcer
(core:
共22兲⫽
1.8,
p
⫽
0.4; shell:
共22兲⫽
1.3,
p
⫽
0.94).
We also analyzed the percentage of neurons that showed
pha-sic responsiveness to the first press for each individual animal
during the devaluation test days (nondevalued and devalued) and
Figure 7. Distribution of phasic (gray) and nonphasic (white) neurons across the population of recorded cells in the NAc core (A) and shell (B) during cue presentation before devaluation (i.e., the last day of training, left) or test days when either a different reinforcer (nondevalued, middle) or the same reinforcer (devalued, right) received during trained was given before testing. The area shaded dark gray represents neurons that showed an increase in firing (excitation) to the cue and the area shaded light gray represents the neurons that showed a decrease in firing to the cue (inhibition). Population responses show no difference in the number of phasic cells in the NAc core across devaluation test days (A). There was a significantly greater number of phasic neurons in NAc shell (gray) activated by the cue presentation in the before devaluation and nondevalued condition compared with the devalued condition (B). *p⬍0.05.Table 1. Number and percentage of cells exhibiting an excitation (EXC) or inhibition (INH) to the first lever press after devaluation in the NAc core versus the NAc shell
EXC INH NP
NAc core
Nondevalued (81 cells) 8 (10%) 5 (6%) 70 (86%) Devalued (85 cells) 9 (10.5%) 10 (12%) 66 (77.5%) NAc shell
Nondevalued (80 cells) 8 (10%) 4 (5%) 68 (85%) Devalued (63 cells) 6 (9.5%) 4 (6%) 53 (84%)
correlated the amount of NAc encoding with the latency to
re-spond for each animal. No significant correlation was observed
between the percentage of phasic cells (inhibitions and
excita-tions) in the NAc core that encoded the press on the nondevalued
or devalued test day and latency to press on that day
(nondeval-ued:
R
2⫽
3.9
⫻
10
⫺5,
p
⬎
0.10; devalued:
R
2⫽
0.04,
p
⬎
0.10).
Likewise, no significant correlations were observed between the
percentage of phasic cells in the shell that encoded the press on
either test day (nondevalued or devalued) and latency to press
(nondevalued:
R
2⫽
0.06,
p
⬎
0.10; devalued:
R
2⫽
0.004,
p
⬎
0.10). These results suggest that the NAc core and the shell do not
encode the lever press differently when the value of the reward
previously associated with that press is decreased.
Discussion
Here, we present evidence that NAc subregions differentially
en-code value-based information. In the NAc core, the degree to
which cells encoded reward-associated cues during training
reli-ably predicted the ability of rats to suppress responding for
de-valued outcomes. However, multiple measures (i.e., proportion
of cells, firing magnitude or encoding valence) indicated that core
neurons exhibited no shifts in cue encoding after satiation of the
reinforcer earned during training (devalued) versus a different
reinforcer (nondevalued). In contrast, whereas cue-encoding
NAc shell neurons exhibited no relationship between neural
en-coding during training and subsequent devaluation, devaluation
significantly reduced the proportion of cue-encoding cells after
selective satiation of the same reinforcer (devalued) compared
with the nondevalued condition. Interestingly, this effect was
specific to cue encoding because there was no difference in phasic
activity between the devalued and nondevalued conditions
dur-ing the response epoch.
Both the NAc core and shell have been implicated in
value-based, associative processing (Saddoris et al., 2013). NAc core
neurons show robust encoding to predictive cues paired with
sucrose rewards (Setlow et al., 2003;
Jones et al., 2010;
Saddoris et
al., 2011;
Saddoris and Carelli, 2014) or drug rewards such as
cocaine (Hollander and Carelli, 2007). Further, the NAc core is
necessary for Pavlovian approach responses (Parkinson et al.,
2002;
Saunders and Robinson, 2012), with greater NAc core
en-coding when rats perform a flexible response task than an
inflex-ible task (McGinty et al., 2013). One possinflex-ible explanation is that
the animals that have formed the strongest cue– outcome
associ-ation during training are able use those associassoci-ations to allow for
better performance. Alternatively, the rats with fewer cue-responsive
neurons may have shifted cell firing to circuits that control habitual
behavior (e.g., dorsal lateral striatum;
Yin et al., 2004;
Gremel and
Costa, 2013;
Smith and Graybiel, 2013) and those animals are less
sensitive to devaluation. Here, we found that the degree of encoding
to reward-associated cues in the NAc core (but not shell) predicts the
ability of animals to flexibly guide behavior. Whatever the process,
the degree to which NAc core encodes reward-associated cues
dur-ing traindur-ing may be functionally linked to the animals’ ability to
suppress responding for devalued outcomes.
Although we found that NAc core encoding during training
predicted performance, no relationship was observed when the
outcome value was decreased during testing. In apparent
contra-diction, it has been reported previously that NAc core activity
shifts when cue– outcome associations are changed within a
re-versal test session (Setlow et al., 2003) and dopamine in the core
rapidly updates during delay discounting (Saddoris et al., 2015b).
Furthermore, when rats choose between differently valued
re-wards, NAc neurons encode relative outcome values and
subse-quent behavioral responses (Roesch et al., 2009;
Day et al., 2011;
Sugam et al., 2014). However, these studies were performed while
rats were learning new cue– outcome associations or after the
cue– outcome associations had already been established. In
con-trast, we recorded neuronal firing to a cue linked to a reward that
was devalued outside of the testing session. Therefore, we showed
that NAc core firing to the cue does not change with regard to
decreased expected outcome value.
These findings are consistent with recent work showing that
the NAc core encodes information across different aspects of
choice behavior (proximity to lever, reward magnitude, and
ef-fort), but rarely encoded integration of expected outcome value
(Morrison and Nicola, 2014), as would be necessary in our task.
Importantly, we also found that the magnitude of firing for
excita-tions was similar across all three condiexcita-tions (before devaluation,
nondevalued, devalued). In contrast, inhibitions during training are
more sustained than in the nondevalued and devalued conditions.
This finding is not surprising because animals received the reward in
only the training condition and decreased NAc activity is important
for initiating consummatory and appetitive behavior (Taha and
Fields, 2006;
Krause et al., 2010). Collectively, these data indicate that
NAc core neuronal activity is not sensitive to devaluation and
sug-gest that NAc neurons respond to, rather than update, previously
established cue– outcome associations.
Although the core has been shown to be involved in
associa-tive learning, the NAc shell has been implicated in hedonic value
computations. For example, glutamate antagonists
microinfu-sed directly into the shell enhanced appetitive behavior in rats
(Maldonado-Irizarry et al., 1995;
Kelley and Swanson, 1997).
Further, dopamine in the shell differentially responds to
appeti-tive and aversive tastes (Roitman et al., 2008;
Wheeler et al., 2008)
and NAc shell inactivation disrupts the ability of rats to judge
reward magnitude options (Stopper and Floresco, 2011).
Recent studies suggest that the NAc shell is also involved in
complex motivational behavior. For example, we showed
previ-ously that encoding in the shell was strongly linked to
motiva-tionally potentiated behavior using a Pavlovian-to-instrumental
transfer task (Saddoris et al., 2011). Further, the shell (but not
core) is necessary for outcome-specific enhancement of
goal-directed behavior by Pavlovian cues, suggesting that the shell may
be processing information about specific outcomes (Corbit and
Balleine, 2011). In addition, our current findings suggest that the
shell updates value information about cues to guide instrumental
responding after devaluation. This complements previous findings
in which c-fos activity was increased in the NAc shell (but not core)
to the reward predictive cue after outcome devaluation (Kerfoot et
al., 2007). Together, these findings suggest that the NAc shell (but
not core) dynamically encodes outcome-selective information
about predictive cues based on the current value of that reward
rel-ative to the animal’s motivational state (Saddoris et al., 2015a).
Jones et al., 2010) and the functional connection between BLA
and NAc core during training is necessary for flexible behavior
after reinforcer devaluation (Shiflett and Balleine, 2010).
The prelimbic cortex (PL) is another possible NAc afferent
that sends preferential projections to the core (Heidbreder and
Groenewegen, 2003) and could process cue– outcome
informa-tion. Although PL lesions before training disrupt performance in
reinforcer devaluation tasks, the PL is not necessary for the
ex-pression of the devaluation effect (Ostlund and Balleine, 2005;
Tran-Tu-Yen et al., 2009). Therefore, the ability of rats to learn
cue– outcome associations (encoded in the NAc core) allows
an-imals to use this information to guide behavior when outcome
values change and the core could receive this information from
the PL, the BLA, or both.
In contrast, we show that NAc shell encoding reflects the
cur-rent devaluation of the reward. Therefore, the shell most likely
receives information about the updated outcome value to adjust
encoding to the reward predictive cue. The neural substrate
nec-essary for the expression of behavioral flexibility during testing is
the orbitofrontal cortex (OFC) (Pickens et al., 2005;
West et al.,
2011a;
Gremel and Costa, 2013;
West et al., 2013). Interestingly,
the rat OFC (ventral lateral and lateral subregions) does not send
direct projections to the medial shell (Schilman et al., 2008) and
instead may send information regarding the updated
motiva-tional state during behavioral performance, perhaps through the
ventral tegmental area (Swanson, 1982;
Takahashi et al., 2011).
Another possibility is that the shell receives satiety signals (e.g.,
from the lateral hypothalamus; LH). The LH sends dense
projec-tions to the shell (but not core) and is necessary for the
enhance-ment of appetitive behavior after glutamate blockade in the shell
(Maldonado-Irizarry et al., 1995;
Kelley, 2004). Further, LH
neu-rons encode sensory-specific satiety (Rolls et al., 1986).
There-fore, it is possible that the shell uses outcome-specific satiety
signals from the LH to alter cue encoding to reflect the updated
motivational value.
Finally, it is important to note that the core sends dense
pro-jections to the shell, but the shell only sends sparse propro-jections to
the core (van Dongen et al., 2005). Therefore, the NAc core may
provide the appropriate information about the learned cue–
out-come associations to the shell, which also has access to the
ex-pected outcome value (i.e., decreased value) through connections
with other brain circuits (e.g., OFC, LH). Then, the shell
inte-grates this parallel information to update cue-encoding to reflect
the updated outcome value. Interestingly, the shell has also been
implicated in gating behavior (Ambroggi et al., 2011). Therefore,
the shell may act toward the suppression of responding in the
deval-ued condition upon integrating value information. Regardless of the
larger neural network in which it is embedded, the current findings
indicate complimentary, yet distinct, roles of the NAc core and shell
neural encoding when animals flexibly change cue-guided
moti-vated behavior after an alteration in outcome value.
References
Ambroggi F, Ishikawa A, Fields HL, Nicola SM (2008) Basolateral amygdala neurons facilitate reward-seeking behavior by exciting nucleus accum-bens neurons. Neuron 59:648 – 661.CrossRef Medline
Ambroggi F, Ghazizadeh A, Nicola SM, Fields HL (2011) Roles of nucleus accumbens core and shell in incentive-cue responding and behavioral inhibition. J Neurosci 31:6820 – 6830.CrossRef Medline
Cacciapaglia F, Wightman RM, Carelli RM (2011) Rapid dopamine signal-ing differentially modulates distinct microcircuits within the nucleus ac-cumbens during sucrose-directed behavior. J Neurosci 31:13860 –13869. CrossRef Medline
Carelli RM (2000) Activation of accumbens cell firing by stimuli associated
with cocaine delivery during self-administration. Synapse 35:238 –242. CrossRef Medline
Carelli RM (2004) Nucleus accumbens cell firing and rapid dopamine sig-naling during goal-directed behaviors in rats. Neuropharmacology 47: 180 –189.CrossRef Medline
Carelli RM, Ijames SG (2000) Nucleus accumbens cell firing during main-tenance, extinction, and reinstatement of cocaine self-administration behavior in rats. Brain Res 866:44 –54.CrossRef Medline
Carelli RM, Ijames SG (2001) Selective activation of accumbens neurons by cocaine-associated stimuli during a water/cocaine multiple schedule. Brain Res 907:156 –161.CrossRef Medline
Castro DC, Cole SL, Berridge KC (2015) Lateral hypothalamus, nucleus ac-cumbens, and ventral pallidum roles in eating and hunger: interactions between homeostatic and reward circuitry. Front Syst Neurosci 9:90. Medline
Corbit LH, Balleine BW (2011) The general and outcome-specific forms of Pavlovian-instrumental transfer are differentially mediated by the nu-cleus accumbens core and shell. J Neurosci 31:11786 –11794.CrossRef Medline
Corbit LH, Muir JL, Balleine BW (2001) The role of the nucleus accumbens in instrumental conditioning: Evidence of a functional dissociation be-tween accumbens core and shell. J Neurosci 21:3251–3260.Medline Day JJ, Carelli RM (2007) The nucleus accumbens and Pavlovian reward
learning. Neuroscientist 13:148 –159.CrossRef Medline
Day JJ, Wheeler RA, Roitman MF, Carelli RM (2006) Nucleus accumbens neurons encode Pavlovian approach behaviors: evidence from an au-toshaping paradigm. Eur J Neurosci 23:1341–1351.CrossRef Medline Day JJ, Roitman MF, Wightman RM, Carelli RM (2007) Associative
learn-ing mediates dynamic shifts in dopamine signallearn-ing in the nucleus accum-bens. Nat Neurosci 10:1020 –1028.CrossRef Medline
Day JJ, Jones JL, Carelli RM (2011) Nucleus accumbens neurons encode predicted and ongoing reward costs in rats. Eur J Neurosci 33:308 –321. CrossRef Medline
Gremel CM, Costa RM (2013) Orbitofrontal and striatal circuits dynami-cally encode the shift between goal-directed and habitual actions. Nat Commun 4:2264.Medline
Heidbreder CA, Groenewegen HJ (2003) The medial prefrontal cortex in the rat: evidence for a dorso-ventral distinction based upon functional and anatomical characteristics. Neurosci Biobehav Rev 27:555–579. CrossRef Medline
Hollander JA, Carelli RM (2007) Cocaine-associated stimuli increase co-caine seeking and activate accumbens core neurons after abstinence. J Neurosci 27:3535–3539.CrossRef Medline
Hollander JA, Ijames SG, Roop RG, Carelli RM (2002) An examination of nu-cleus accumbens cell firing during extinction and reinstatement of water reinforcement behavior in rats. Brain Res 929:226 –235.CrossRef Medline Jones JL, Day JJ, Wheeler RA, Carelli RM (2010) The basolateral amygdala
differentially regulates conditioned neural responses within the nucleus accumbens core and shell. Neuroscience 169:1186 –1198. CrossRef Medline
Kelley AE (2004) Ventral striatal control of appetitive motivation: role in ingestive behavior and reward-related learning. Neurosci Biobehav Rev 27:765–776.CrossRef Medline
Kelley AE, Swanson CJ (1997) Feeding induced by blockade of AMPA and kainate receptors within the ventral striatum: a microinfusion mapping study. Behav Brain Res 89:107–113.CrossRef Medline
Kerfoot EC, Agarwal I, Lee HJ, Holland PC (2007) Control of appetitive and aversive taste-reactivity responses by an auditory conditioned stimulus in a devaluation task: a FOS and behavioral analysis. Learn Mem 14:581– 589.CrossRef Medline
Krause M, German PW, Taha SA, Fields HL (2010) A pause in nucleus accumbens neuron firing is required to initiate and maintain feeding. J Neurosci 30:4746 – 4756.CrossRef Medline
Lex B, Hauber W (2010) The role of nucleus accumbens dopamine in out-come encoding in instrumental and Pavlovian conditioning. Neurobiol Learn Mem 93:283–290.CrossRef Medline
Lubman DI, Yu¨cel M, Pantelis C (2004) Addiction, a condition of compul-sive behaviour? Neuroimaging and neuropsychological evidence of inhib-itory dysregulation. Addiction 99:1491–1502.CrossRef Medline Lucantonio F, Stalnaker TA, Shaham Y, Niv Y, Schoenbaum G (2012) The