FAMILY SIZE PREFERNCES IN EARLY ADULTHOOD: MEASUREMENT ERROR AND DIMENSIONALITY
Anna Rybińska
A dissertation or thesis submitted to the faculty at the University of North Carolina at Chapel Hill in partial fulfillment of the requirements for the degree of Master of Arts in the Department of
Sociology in the College of Arts and Sciences
Chapel Hill 2016
Approved by:
Samuel Philip Morgan
Kenneth A. Bollen
iii ABSTRACT
Anna Rybińska: Family size preferences in early adulthood: measurement error and dimensionality (Under the direction of Yong Cai)
The intended and the desired number of children are widely used measures in family studies yet, despite their popularity, some key questions about these measures remain unanswered. First, little is known about their statistical reliability. Measurement error in either, or both, constructs can cause biased estimation, blurring the relation between these concepts and observed childbearing behavior. Secondly, while extant analyses provide evidence for a distinction between childbearing intentions and desires, these studies do not consider their reliability. Given their wide use, it is necessary to confirm the dimensionality of these concepts and to do so while accounting for measurement error.
In this study, the link between childbearing desires, intentions, and behavior is revisited using a structural equation modeling (SEM) approach in which I test if childbearing desires and intentions are distinct constructs while accounting for measurement error. Using data from the 1979 National
Longitudinal Survey of Youth I estimate latent intentions and desires and then use the results to estimate the odds of having a(nother) child within the next three years. The results indicate that measurement error causes major bias in the relationship between childbearing intentions, desires and behavior. In models that account for measurement error, the effects of childbearing intentions and desires on childbearing behavior are twice as large as in models that assume perfect measurement. In addition, I find that while
childbearing intentions and desires are distinct constructs, when used independently they might predict childbearing behavior with similar precision. Combined these results suggest that researchers interested in childbearing behaviors need to account for both measurement error and the distinction between
iv
ACKNOWLEDGEMENTS
v
TABLE OF CONTENTS
LIST OF TABLES………vi
LIST OF FIGURES……….vii
CHAPTER 1: INTRODUCTION………. 1
CHAPTER 2: BACKGROUND ……….. 4
Desires and intentions – definitions and dimensionality ……….4
Theoretical framework ……….5
Childbearing preferences in empirical research ………...6
Consequences of measurement error in fertility preferences research ………8
Determinants of childbearing intentions and childbearing behavior ………...9
CHAPTER 3: DATA AND METHODS ………13
Data ………13
Methods ………..15
CHAPTER 4: RESULTS ………22
CHAPTER 5: CONCLUSIONS ……….34
APPENDIX 1: DIMENSIONALITY ………...………..38
APPENDIX 2: RELATIONSHIP BETWEEN THE DESIRED, INTENDED NUMBER OF CHILDREN AND THE CHILDBEARING BEHAVIOR ……...………..41
APPENDIX 3: ALTERNATIVE SPECIFICATION OF THE MEASUREMENT MODEL ………..44
vi
LIST OF TABLES Table:
1. Descriptive characteristics of the independent variable and the outcome ……….14
2. Descriptive statistics of the sample ………17
3. Intentions: Results for Models 1 - 6 ………...23
4. Desires: Results for Models 7 - 12 ………..…...26
5. Complete results: Estimation of models with the intended number of children ………...….27
6. Complete results: Estimation of models with the desired number of children………..… 29
7. Desires and intentions: Results for Models 13 and 14………..…. 31
vii
LIST OF FIGURES Figure:
1. Intentions: Model 1. Observed measure of intentions in 1982.……….….18
2. Intentions: Model 2. Latent measure of intentions in 1982.………...18
3. Intentions: Model 3. Observed measures of intentions in 1979 and 1982………..18
4. Intentions: Model 4. Observed measure of intentions in 1979 and latent measure of intentions in 1982.………...18
5. Intentions: Model 5. Latent measures of intentions in 1979 and 1982.………..18
6. Intentions: Model 6. Model 6. Latent measures of intentions in 1979 and 1982 - changed temporal relationship..………19
7. Desires: Model 7. Observed measure of desires in 1982………19
8. Desires: Model 8. Latent measure of desires in 1982 ...……….19
9. Desires: Model 9. Observed measures of desires in 1979 and 1982 ...………...19
10. Desires: Model 10. Observed measures of desires in 1979 and latent measure of desires in 1982……….19
11. Desires: Model 11. Latent measures of desires in 1979 and 1982 ……….20
12. Desires: Model 12. Latent measures of desires in 1979 and 1982 - changed temporal relationship ……….20
13. Desires and intentions: Model 13. Observed measures of desires and intentions in 1979 and 1982 ………20
1
CHAPTER 1: INTRODUCTION
This paper revisits the concept widely used in fertility studies – fertility preferences and their link with subsequent childbearing. Fertility preferences can be described as individual’s preferences for family size (i.e. the number of children one wants to have), timing of the childbearing or family structure (i.e. the preference for having a specific gender composition – for instance least one boy). Although they cannot be treated as exact and reliable predictions of individual or aggregate fertility (Morgan, 2001), they are strongly linked with fertility behaviors. Several decades ago fertility preferences provided information for population projections (Freedman, Whelpton, and Campbell, 1959; U.S. Bureau of the Census, 1975). Currently, they inform policy makers about the demand for family planning and contraception in high fertility regions (Sennott and Yeatman, 2012; Westoff, 1978) and the need for family policies in low fertility regions (Chesnais, 1996; Philipov, 2009). Recently, they have been also used to study the spread of low fertility preferences in developed countries (Goldstein, Lutz, and Testa, 2003; Merli and Morgan, 2012; Merli and Smith, 2002). Although the concept of fertility preferences is frequently present in fertility research, several questions still linger.
2
recent studies, findings from various fields suggest that measurement error results in marked bias in the variable of interest (Glewwe 2012 for economic mobility, Freckleton 2011 for behavioral ecology, Kobayashi and Boase 2012 for mobile communication use). These findings show that measurement error can have a significant influence on the estimates used in research of causal relationships. Given the importance of fertility preferences for fertility studies, population projections or policy decisions, there exists a need for verifying the precision of fertility preferences measurement and for a discussion of the consequences of measurement error on the relationship between fertility preferences and fertility behavior.
This study aims at filling this gap in research. I focus on two widely used fertility preferences measures – the desired and the intended number of children and build measurement models to assess their statistical reliability. I then estimate the effect of these measures on childbearing behavior, i.e. having a(nother) child within the next three years. This approach verifies if the statistical relationship between desires, intentions and behavior might have been biased by the measurement error. In addition, I analyze the relationship between the desired and intentioned number of children. As contemporary data sets predominantly contain only one of these measures, they tend to be used interchangeably to study the impact of childbearing preferences on childbearing behavior. If the respondents do not distinguish these measures, the results of such studies could be compared however, if the two concepts of desired and intended number of children should be distinguished, excluding one of them from the analysis could lead to loosing important predictive information. In this study I benefit from a study that includes both the desired and intended number of children. I fit the same equation to predict childbearing behavior using first only the desires, then only intentions and at last – both measures. This study verifies what is the effect on behavior of the desires and intentions separately as well as what is the effect when both measures are in the model.
3
fit information to assess the fit of different specifications, allowing for more rigorous comparison between the models. My sample consists of American women followed in the 1979 National Longitudinal Survey of Youth.
4
CHAPTER 2: BACKGROUND Desires and intentions – definitions and dimensionality
This study focuses on two measures of family size preferences – the desired and intended number of children. I begin with a brief discussion of these concepts and the relationship between them. Desires can be defined as “psychological states that represent what someone wishes for or wants” (Miller, 1994, p. 225). In literature, this term desired number of children is used interchangeably with “wanted” number of children. This measure is considered as the best known and widely available indicator of fertility preferences. Intended number of children can be also referred to as expected number of children1. It is one’s report about how many children he/she intends to have (Hagewen and Morgan, 2005). As desires, intentions are widely used in studies of childbearing motivations, especially among demographers.
The desired and intended number of children are often used interchangeably in family studies – there are two explanations why this appears. First, numerous studies simply do not include both measures and researcher cannot account for both of them. Secondly, they might be considered as indistinguishable by the respondents. Theoretically, these concepts should be different – one’s desires might be irrespective of one’s situation while intentions might take into account the feasibility of obtaining the desired goal. For instance, a woman might desire to have three children however she might be aware of various constraints such as limited financial resources, limited access to child care, reproductive challenges encountered by her sister or mother. She therefore desires three children but might intend having fewer.
In practice, to my knowledge there is only one study that analyzed the relationship between various measures of family size preferences. Westoff and Ryder analyze four concepts – the ideal, expected, wanted and intended number of children and show that indented and expected number of
1
5
children are virtually indistinguishable (Westoff and Ryder,1977 p.35). However ideals, intentions and desires express different orientations to the family size (Westoff and Ryder,1997, p.35). Their analysis did not account for the measurement error therefore it is possible that the relationship between these concepts might be alternated when the measurement error is being accounted for. However, these results prompted me to access the dimensionality of these two measures in this analysis. Results presented in Appendix 1 provide evidence that respondents see the desired and indented number of children as two separate concepts with or without the measurement error. For this reason, I have decided to include both measures in the analysis. This approach allows me not only to estimate the measurement error in both measures of the intended and desired number of children separately but also enables me to study the difference between the models that use only one of these measures and the models that use both of them. Theoretical framework
This analysis is guided by two main theories employed in the research of childbearing preferences: Miller’s Traits-Desires-Intentions-Behavior Model (Miller, 1994) and Ajzen’s Theory of Planned Behavior (Ajzen, 1991). Miller’s approach assumes that childbearing desires are formed by psychological traits. The effects of background factors are the mediated through desires and intentions to behavior. In Ajzen’s theory, background characteristics such as gender, age, educational level and marital status influence intentions through a set of mediators: attitudes toward the behavior, subjective norms and perceived behavioral control (Ajzen, 1991)2. I combine the two approaches and assume the effects of the personal characteristics, background factors and situational covariates on behavior are mediated through desires and intentions. This specification allows for testing the model with or without one of the
mediators. As mentioned, some studies include only the measure of desires and some only the measure of intentions – this model can be estimated under both of these circumstances but also allows to compare the partial models with the full model that includes both measures. In addition, recently Mencarini and
2
6
colleagues (2015) used graphical models to prove that background characteristics influence intentions and fertility behavior not only through the set of mediators but also directly. For this reason, in this analysis I will assume that background characteristics might influence desires, intentions and childbearing behavior indirectly but also directly. The models are further described in the methodology section.
Childbearing preferences in empirical research
Measures of the desired and intended number of children have been present in surveys in various forms for over half a century (Westoff, 1990). However, being frequently employed in fertility studies, “the measurement of reproductive motivation has long been one of the more controversial areas in demography” (Lightbourne Jr 1987, p. 21). First analyses of the relation between fertility intentions and fertility behavior conducted in US in the 1950’s provided evidence that there is an approximate
correspondence between these measures (Freedman, Whelpton, and Campbell, 1959) which led to including the information about fertility expectations into population projections (U.S. Bureau of the Census, 1975).
7
(Hagewen and Morgan, 2005; Morgan and Rackin, 2010; Quesnel-Vallée and Morgan, 2003). To summarize, researchers are still not in agreement whether childbearing preferences can predict childbearing behavior.
At the same time as the debate about the predictive power carries on throughout the decades, measures of family size preferences are often used in family studies. Demographers treat intentions and desires to some extent as predictors of future fertility (Philipov, 2009). Studies of fertility preferences can be divided into those that focus on regions characterized by high fertility and low fertility. In high fertility settings, reproductive intentions wanted and intended number of children, are used to study the unmet need for family planning and the demand for contraception (Westoff, 1978; Sennott and Yeatman, 2012). In low fertility settings, researchers use childbearing intentions and desires to inform family policy plans, providing evidence of the existence of economic and institutional constraints that result in below
replacement level fertility (Philipov, 2009). For instance, European Commission surveys consistently inform that the desired family size surpasses the replacement level of 2.1 in many European countries but the total fertility rates are much lower (Eurobarometer, 1991; 2003). This is explained by family
researchers as a “window” of opportunity for family policies that could eliminate constraints Europeans face when making decisions about childbearing (Chesnais, 1996).
In extremely low fertility regions, family size preferences are studied to observe the spread and acceptance of sub-replacement family size ideals. Goldstein and colleagues (2003), building on the newest data on family size preferences for German speaking countries show that in the German speaking parts of Europe, the average ideal family size given by younger population has decreased to levels as low as 1.7 children. Another stream of research focuses on the interdependencies between family planning policies and family size preferences. A strict one-child policy in China resulted in a spread acceptance of the imposed family size among younger Chinese population, especially in urban areas (Merli and Smith, 2002).
8
relationship between the childbearing preferences and the behavior is attenuated by the measurement error present in the measures of preferences. The link between intentions or desires and the behavior might be stronger (or weaker) than previous reported results. Additionally, one of the measures can be more statistically reliable and this might account for the difference in the results of the studies that utilize either the intended or the desired number of children. Assessing the statistical reliability would provide new evidence for empirical research and theoretical debates.
Consequences of measurement error in fertility preferences research
Let us consider the consequences of measurement error as described by Bollen (1989) and Rigdon (1994) on the predictive power the intentions and desires have on the childbearing behavior. In a single equation model, where one or more independent constructs influence one dependent construct, the measurement error in the dependent variable does not bias the coefficients. However, even in the single-equation model, if the independent variable is biased by the measurement error, the relationship between that variable and the dependent construct is going to be biased. It means that if there is a measurement error in the measures of the intended and desired number of children and this measure is being used to predict childbearing behavior, the impact of these preferences on the behavior will be biased. In addition, if other independent constructs are correlated with the measure of desires or intentions, their variance matrix may also be biased and the direction of bias might vary.
The problem becomes more complex when multiple equations are estimated at the same time. Let us consider a system of equations where the desires influence the intentions and intentions then influence behavior. The bias caused by the measurement error in the measure of desires can influence the
9
To problem of the measurement error can be solved using measurement models which assume that observed variables are indicator of latent concepts. Structural equation framework enables a simultaneous estimation of the measurement models together with the explanatory regressions for the intentions, desires and childbearing behavior. This approach provides a detailed assessment of the fit of each estimated equation but also for the general model fit. This approach will allow me to compare the models with different specifications (models with and without measurement error) and to compare models that utilize different measures - only desired number of children, only intended number of children or both measures.
Determinants of childbearing intentions and childbearing behavior
Numerous empirical studies that focus on the determinants of fertility intentions and behavior suggest that they depend on several demographic, socio-economic and gender related factors (Berrington and Pattaro, 2014; Cavalli and Klobas, 2013; Mills et al., 2008; Morgan and Rackin, 2010; Neyer,
Lappegaard, and Vignoli, 2013; Quesnel-Vallée and Morgan, 2003; Schoen et al., 1999; Thomson, 1997). This research focuses on the family size intentions and the likelihood of having a child within the next three years and in this section I will shortly discuss factors usually linked with both these measures. It is worth to mention that it is a short-term analysis that focuses on the timing of the next childbirth not on achieving the intended family size. For this reason, the discussion will be tightly linked to the
determinants of childbearing postponement rather than final fertility. For simplicity of the analysis I restricted the set of explanatory variables to key background and situational factors previously documented in the literature: family background and situational factors.
Children might adopt their parents values and preferences by observing their parent’s childbearing behaviors, family formation and family structure (Murphy and Wang, 2001; Axinn,
Clarkberg, and Thornton, 1994; Barber, 2000). Hence children raised in larger families, i.e. children who had more siblings could form a preference for larger families while children from smaller families could
10
have brothers or sisters who already had children of their own. This peer effect could encourage them to have their children sooner as they would have support from their families. For this reason, children from larger families might be more likely to have a(nother) child sooner rather than postponing parenthood.
Children might also develop different educational abilities and aspirations during their upbringing based on resources provided to them by their parents (Rindfuss, Bumpass, and St. John, 1980). Firstly, children growing up in families that showed stronger attachment to traditional values and traditional division of roles between men and women (breadwinner – homemaker structure) could internalize these values as their own. As traditional values are positively linked with higher fertility and early childbearing,
being raised in a breadwinner- homemaker households might be positively linked with fertility intentions
and subsequent fertility behavior. Secondly, parent’s educational expectations tend to act as strong predictors of the timing of entry to parenthood (Kiernan, 1997). It is possible that they have the same effect on family size preferences. As parents tend to expect their children will obtain at least the same level of education as they did, higher educated parents could support prolonged education and transmit less traditional values and professional career aspirations to their children. I expect the level of parent’s
education can be positively linked with childbearing postponement and negatively linked with children’s
family size preferences.
Previous research shows that religious involvement can affect family size preferences. Individuals who are more involved - irrespective of denomination - can be more often exposed to teachings and religious doctrine (e.g. by frequently attending mass). Various denominations encourage followers to enter parenthood early and develop preference for large families through pronatalist teachings. Research shows that more religious individuals tend to have higher fertility and fertility preferences (Adsera, 2006; Hayford and Morgan, 2008). I expect that individuals with higher religious involvement will have higher family size intentions and will be more likely to have another child sooner.
There is a strong correlation between prolonging education by women and postponing
11
the arguments might be that since both education and childbearing are time consuming, women who decide to pursue higher education might decide to delay their maternal plans. Some studies, in fact, show that postponing motherhood during education can be just a result of the time taken to complete schooling (Hoem, 1986; Blossfeld and Huinink, 1991; Kravdal, 1994). I expect that educational enrollment will be negatively linked with the likelihood of having a child within the next three years. Remaining in education for a longer period of time can also be an indicator of personal preferences for professional career or encourage interests or lifestyles that compete with parenthood (Kohler et al., 2002). As a result, being in education might be negatively linked with family size intentions. Additionally, educational enrollment for a longer period of time usually results in obtaining higher level degrees. It has been proven that highly educated women are often driving the trend of having children later in their lives (Kohler et al., 2002; Sobotka, 2004). Higher education is related with further professional career developments because it might enable women to pursue better occupations and focus on their careers.
12
(Happel et al., 1984). In several empirical studies, women mention that conscious career planning was their main motivation for motherhood postponement, as they anticipated that they will have better chances of career advancement if they delay childbirth (thorough review in e.g. Gustafsson, 2003). For this reason I expect that employed women will be less likely to have a child within the next three years. On the other hand, employment provides the family with additional financial resources that might be spent on the baby which might accelerate child birth. It is also then plausible that employed women will be more likely to have a(nother) child within the next three years.
Having a supportive partner is crucial for childbearing decisions (Philipov et al., 2006; Testa, 2007). A lack of a partner, a lack of financial and emotional support that a stable partner provides strongly impacts women’s childbearing choices. Delaying entering a stable union has a direct influence on the timing of childbearing (Corijn and Klijzing, 2001) and experiencing a union dissolution can force the postponement of childbearing plans until finding another partner. I therefore expect that married women will be the most likely to have a(nother) child within the next three years as compared to single or
13
CHAPTER 3: DATA AND METHODS Data
For the analysis I use the 1979 National Longitudinal Survey of Youth3. It is an panel survey of a national representative sample of Americans, aged 14 to 21 in 1978 (Zagorsky and White, 1999). This survey started in 1979 and respondents were interviewed annually from 1979 to 1986 and then biannually from 1988 to 2010. During each interview, rich information about the household, family formation processes, demographic and socio-economic characteristics were collected. The initial sample consisted of 12,686 individuals. I mainly utilized information from Wave II conducted in 1982, supplemental information were extracted from Wave I in 1979 and from Wave V in 1985. In this paper I focus on the sub-sample of women as their fertility intentions and behaviors have been mostly studied in the past. An analysis of the data for men should be the next step.
Independent measures and outcome
Two measures of family size intentions found in the survey are: “How many (more) children do
you expect to have?”4
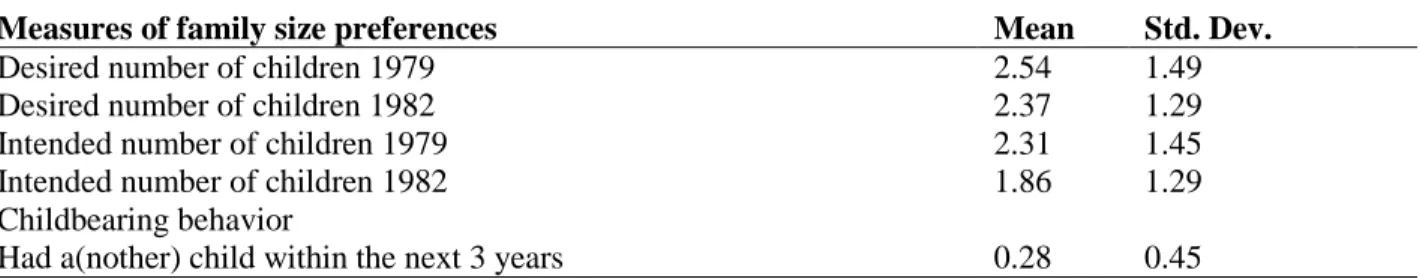
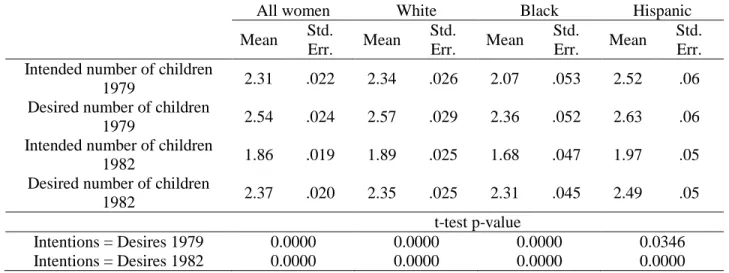
and “Altogether, how many (more) children do you want to have”. Measures were present in the data set in 1979 and 1982. Both variables are included in the data set as continuous. However the mean values of the intended and desired number of children are close in 1979, one can observe an increasing divergence between the intended and desired number of children in 1982. In addition, the means of desired number of children in 1979 and 1982 are in proximity (2.54 and 2.37) but the intended number of children in 1982 is much lower than in 1979 (1.86 compared to 2.31). The
3 https://www.nlsinfo.org/content/cohorts/nlsy79
4
14
childbearing behavior is measured as a dummy for having a(nother) child within the next three years, until 1985; 28% of women had a(nother) child until the interview in 1985.
Table 1 Descriptive characteristics of the independent variable and the outcome.
Measures of family size preferences Mean Std. Dev.
Desired number of children 1979 2.54 1.49
Desired number of children 1982 2.37 1.29
Intended number of children 1979 2.31 1.45
Intended number of children 1982 1.86 1.29
Childbearing behavior
Had a(nother) child within the next 3 years 0.28 0.45
Covariates
I use number of siblings as an indicator of family size and parental education is measured by years of education of both parents. The indicator of being raised in a male-breadwinner family is a dummy that equals 1 if the mother worked when respondent was 15 years old. Religiosity is measured by church attendance coded as a dummy equal to 1 when the respondent attends church once per week or more5. Enrollment status is divided into four categories: enrolled in college, enrolled in high school, not enrolled, finished high school and nor enrolled, less than 12 grades of education. Marital status dummies include: single, married and separated (separated, divorced and widowed) individuals. Three types of employment status are recognized: employed, unemployed and out of labor force. I excluded those active in the military as there were very few women in this category. I include the number of children and age. I additionally include a set of controls including: racial and ethnic origin – as they might reflect subgroup variations in fertility-related norms (Reiss 1967, Staples 1978, St. John and Rowe 1990), a dummy for being raised in an urban area and a control for regional difference indicating residing in the South of the United States. Descriptive statistics of the measures are included in Table 2. The final sample consists of 4,149 women who were interviewer in three consecutive waves.
5
15
The NLSY-79 sample consist of young adolescent, the mean age in 1982 when the second wave was conducted was 21 years and many respondents have not yet transitioned to parenthood. However, 30% of women already had at least one child. Some respondents are enrolled in college or high school which is specific to this young sample but the majority have already finished their education and started employment. About one third of women have already entered a marital union and 29% are married in 1982. While the majority of women remain employed, about one third is out of labor force which might coincide with attending school or raising young children. What is noteworthy is that the sample is predominantly White and living in urban areas.
Methods
In this study I employ structural equation models framework (Bollen, 1989) which allows me to simultaneously estimate the equation for the intended number of children and the equation predicting the likelihood of having a(nother) child. It also allows me to account the measurement error in the measures of family size preferences and compare the fit of specific equations but also of the entire model by using detailed fit statistics. Since only one indicator of each factor (desires and intentions) is available for each year, the estimation of the models might be problematic due to very limited amount of information the model can use to identify the missing parameters. For this reason I used measures for two years – 1979 and 1982 and included minor constraints in the models. I use maximum likelihood estimator to compute coefficients in the equations and the weighted least squares estimator6 to obtain the fit statistics. The analysis was done using MPlus developed by Muthén & Muthén7 because this software enables including categorical variables in the SEM framework and provides the richest set of the model fit statistics.
The analysis was conducted in three steps. The first set of models includes only measures of the intended number of children to estimate the results as if no measure of the desired number of children was
6 Weighted least squares estimator is used to estimate probit models instead of logit models. However, the fit of
these two models should be comparable therefore I decided to use the fit statistics of the probit model to assess the logit. No fit statistics are provided in MPlus when the logit model is employed.
16
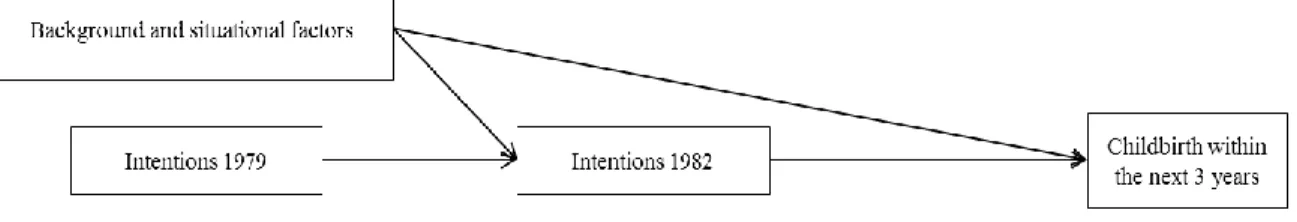
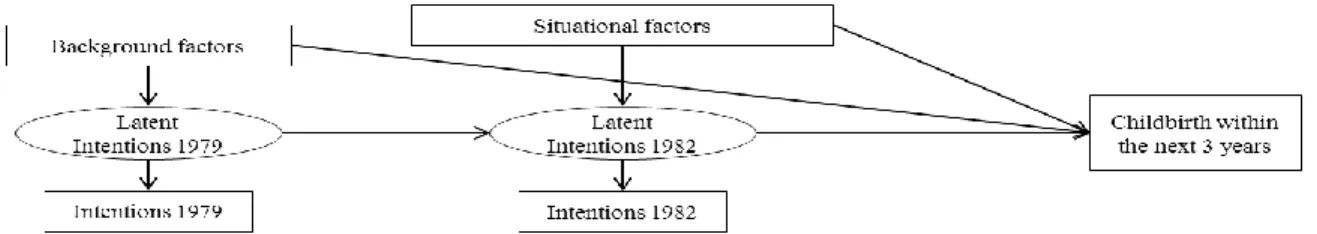
available. In the second set of models, only measures of the desired number of children are included – as if no measures of the intended number of children were available. These models aim at estimating the separate impact of these two measures on the behavior. Both sets of model are estimated following the same procedure: I first estimate a model with one measure in 1982 and then extend the model to two measures – 1982 and 1979 to identify the models with latent concepts. Graphs presenting each model estimated in this sequence are available below (Figures 1- 6 for intentions and 7-12 for desires). This approach is guided by the assumption that there is a causal relationship between one’s intentions in time 1 (1979) and their intentions in time 2 (1982)8. Including measures of 1979 is necessary to identify the models however it might introduce concerns about the relationship between the measures of intentions and desires in 1979 and situational factors in 1982. It is plausible that one’s desires might influence their life decisions such as employment or educational choices. These concerns will be addressed in the results section. In addition, models 1-4 and 7-10 do not have any constraints but models 5-6 and 11-12 have the variances of the errors of the observed measures of intended number of children in 1979 and 1982 (or desired number of children in 1979 and 1982) set to equal.
In the third step, I include both measures of the intended and the desired number of children. In this model, background and situational factors have direct influence on the desired number of children, intended number of children and behavior but all the influence of the desired number of children on the odds of having a(nother) child within the next three years is mediated through the intended number of children. I tested the model which allowed also for the direct effects and the model had a significantly worse fit (see Appendix 2). For brevity, I present only the basic model with all measures introduced as observed – Figure 13 and the last model with all measures introduced as latent – Figure 14. In model 14, the variances of the errors of the observed measures of intended number of children in 1979 and 1982 are set to equal and the variances of the errors of the desired number of children in 1979 and 1982 are set to equal.
8
17 Table 2 Descriptive statistics of the sample.
Individual characteristics Mean Std. Dev.
Age in 1982 20.69 2.27
Has no children 0.70 0.46
Has one child 0.19 0.39
Has two or more children 0.11 0.31
Race: White 0.62 0.48
Race: Hispanic 0.16 0.36
Race: Black 0.22 0.41
Family background
Mother was employed when respondent was 15 y.o. 0.54 0.50
Mothers education in years 10.92 3.13
Fathers education in years 10.89 3.94
No siblings 0.03 0.16
One sibling 0.13 0.34
Two siblings 0.20 0.40
Three or more siblings 0.63 0.48
Religiosity
Attends church once per week or more 0.38 0.49
Education enrollment
Not enrolled, less than 12 grades of education 0.16 0.37
Enrolled in high school 0.12 0.32
Enrolled in college 0.20 0.40
Not enrolled, high school graduate 0.52 0.50
Marital status
Single 0.66 0.47
Married 0.29 0.45
Separated 0.06 0.23
Employment status
Employed 0.56 0.50
Unemployed 0.12 0.33
Out of the labor force 0.31 0.46
Controls
Residing in an urban area 0.78 0.41
Residing in the South 0.37 0.48
18
Figure 1 Intentions: Model 1. Observed measure of intentions in 1982.
Figure 2 Intentions: Model 2. Latent measure of intentions in 1982.
Figure 3 Intentions: Model 3. Observed measures of intentions in 1979 and 1982.
Figure 4 Intentions: Model 4. Observed measure of intentions in 1979 and latent measure of intentions in 1982.
19
Figure 6 Intentions: Model 6. Latent measures of intentions in 1979 and 1982 - changed temporal relationship.
Figure 7 Desires: Model 7. Observed measure of desires in 1982.
Figure 8 Desires: Model 8. Latent measure of desires in 1982.
Figure 9 Desires: Model 9. Observed measures of desires in 1979 and 1982.
20
Figure 11 Desires: Model 11. Latent measures of desires in 1979 and 1982.
Figure 12 Desires: Model 12. Latent measures of desires in 1979 and 1982 - changed temporal relationship.
21
22
CHAPTER 4: RESULTS
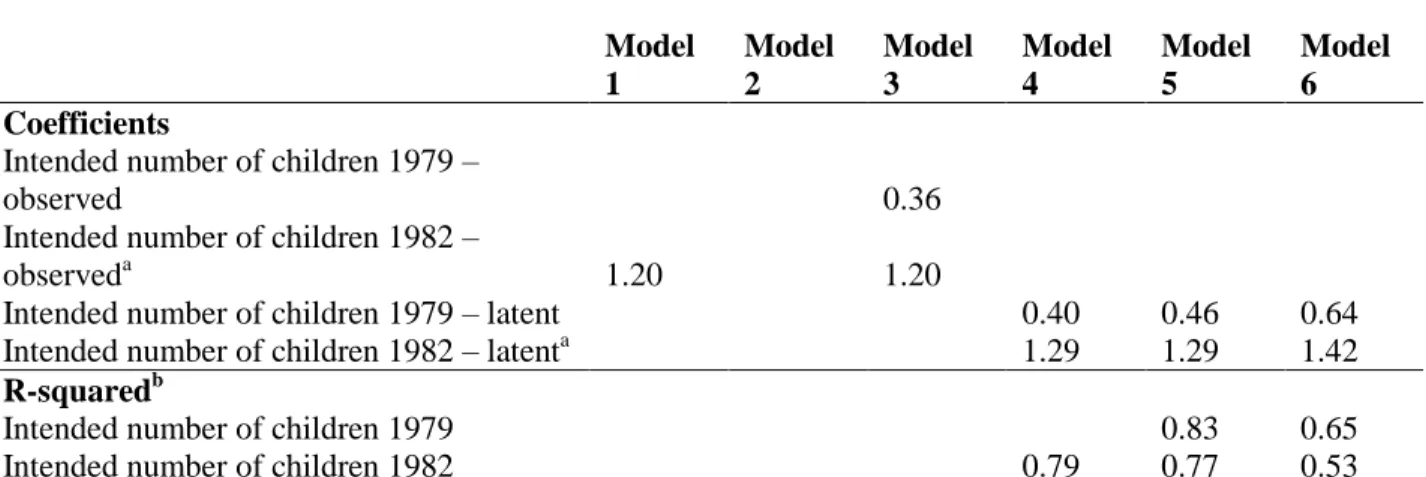
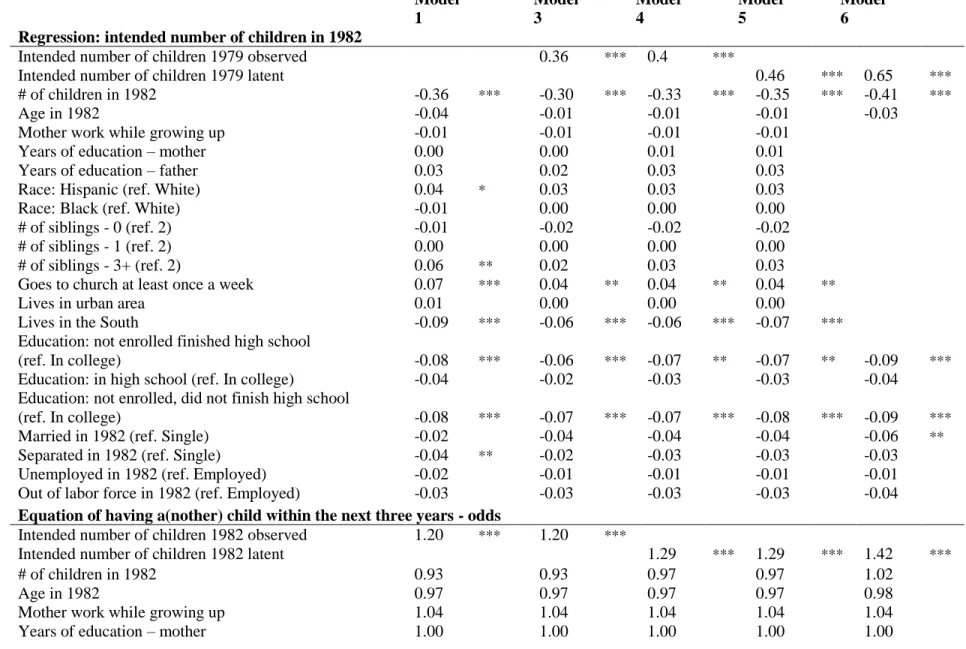
I firstly discuss the results of the models with measures of the intended number of children. In this specification I assume that there is no measure of desires available in the dataset. Results of this estimation are included in Table 3 and 6. First, I estimate the Model 1 with only one observed measure of intentions in 1982 to provide a baseline for the comparison with the measurement models. The odds of having a child within the next three years increase by 20% by a one unit change in the intended number of children. Model 2 includes a latent measure of the intended number of children in 1982 is not identified. I then fit a model with two measures of the intended number of children – as observed and latent concepts. Results from Model 3 are similar to the results of Model 1 – there is no difference in the regression for the odds of having a(nother) child within the next three years but some of the effects of background factors on the intended number of children in 1982 disappear when the intended number of children in 1979 is introduced to the model. There is a strong positive relationship between the intended number of children in 1979 and 1982. In Model 4, after accounting for the measurement error in 1982, the effect of the intentions on the childbearing behavior in the next three years increases, from 20% to 29% increase in the odds. In Model 5, after accounting for the measurement error in 1979 we do not see a change in the coefficient by the intended number of children 1982 but the effect of intentions in 1979 on the intentions in 1982 increases from 0.36 to 0.40. This model does not fit the data – however the CFI and RMSEA values are within acceptable range (above 0.9 for CFI and below 0.05 for RMSEA), the TLI is below acceptable 0.9 and the BIC is positive (should be negative).
23
satisfactory fit. Only TLI value is below acceptable 0.9 which might be due to omitting the mentioned paths between situational factors and intended number of children in 1979. In this specification, the impact of the intentions in 1979 on the intentions in 1982 increases to 0.65 and the impact of the intended number of children in 1982 on the childbearing behavior increases to 40% increase in the odds. In the final specification, the measurement error accounts for 35% of the variance in the intended number of children in 1979 and for 57% of the variance in the intended number of children 1982. The change in the measurement error between Models 5 and 6 is surprising.
In regards to the other effects of other covariates, they remain virtually the same across different specification. Background factors have no or a small effect on the intended number of children in 1982 and 1979. Only the fact of residing in the South and the father’s educational attainment did not influence the intended number of children in 1982 but have a positive influence on the intended number of children in 1979. The effects of background and situational factors on the childbearing behavior increase slightly when the measurement model is estimated suggesting a small attenuation bias that might have been caused by the measurement error in the intended number of children. However, all these changes are very small, usually within a standard error difference across the models. Although the intended number of children has a positive impact on the odds of having a child within the next three years, situational factors such as educational enrollment, employment or marital status are much stronger predictors of
childbearing behavior.
Table 3 Intentions: Results for Models 1 - 6.
Model 1 Model 2 Model 3 Model 4 Model 5 Model 6 Coefficients
Intended number of children 1979 –
observed 0.36
Intended number of children 1982 –
observeda 1.20 1.20
Intended number of children 1979 – latent 0.40 0.46 0.64
Intended number of children 1982 – latenta 1.29 1.29 1.42 R-squaredb
Intended number of children 1979 0.83 0.65
24 Fit statistics
Chi-square 0 0.74 0 187.27 121.91
dF 0 1 0 20 20
p-value 0 0.39 0 0 0
CFI 1 1 1 0.94 0.96
TLI 1 1.00 1 0.79 0.88
RMSEA 0 0 0 0.05 0.04
BIC 0 -7.59 0 20.66 -44.70
N 4,149 4,149 4,149 4,149 4,149
*All coefficients are statistically significant on the level of 0.001. a - odds for logistic regression. b - R-square reported only for models with latent concept. It should be interpreted as the amount of the variance of the observed indicator that is explained by the latent measure.
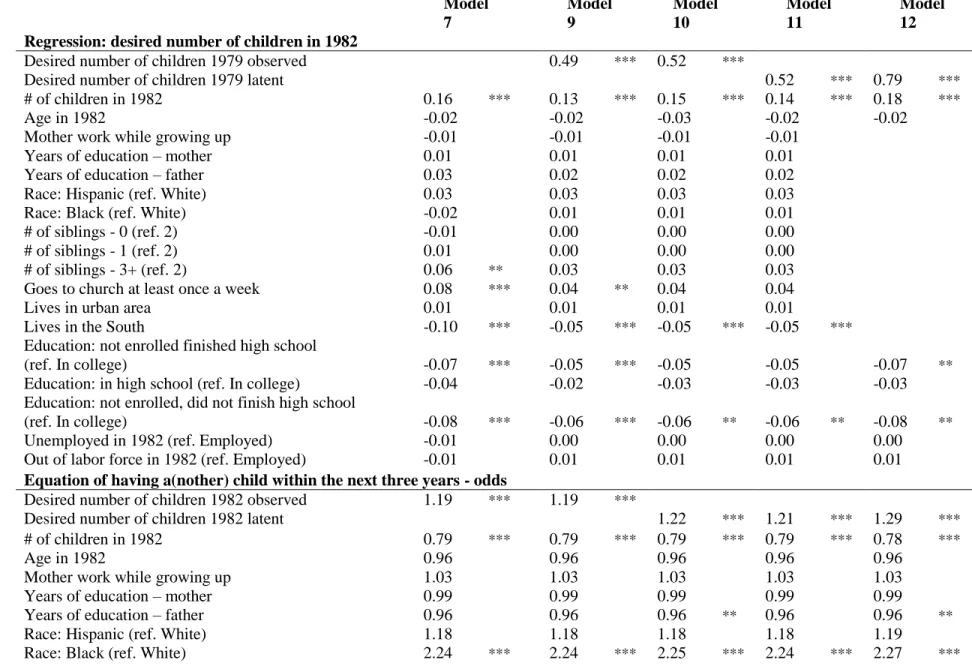
The estimation of the models that include the desired number of children is similar to the procedure for the intended number of children. In this specification, I assume that no measure of the intended number of children is available and predict the childbearing behavior only with the measure of the desired number of children. Table 4 and 7 include results for models 7 - 12. Model 7 provides a baseline of the effect of the desired number of children in 1982 on the odds of having a child within the next three years when it is assumed that the observed variable does not contain measurement error. Under this specification, desires increase the odds of having a(nother) child by 19%. Under the specification that assumes measurement error (model 10), the odds are slightly higher – 23%. In addition, under the
specifications that allow for measurement error in the desired number of children in 1979, the influence of the desires in 1979 on desires in 1982 increase from 0.49 to 0.52. The coefficient in the Model 12
includes the effects of background factors mediated through the desires in 1979 therefore is larger. Model 11 has a better fit than Model 5 estimated for the measures of intentions and is close to being an
25
change in the measurement error between Models 11 and 12 is surprising. Noteworthy, the direction and size of the other coefficients in the models remain unchanged across all models and are very similar to the models that include the intended number of children.
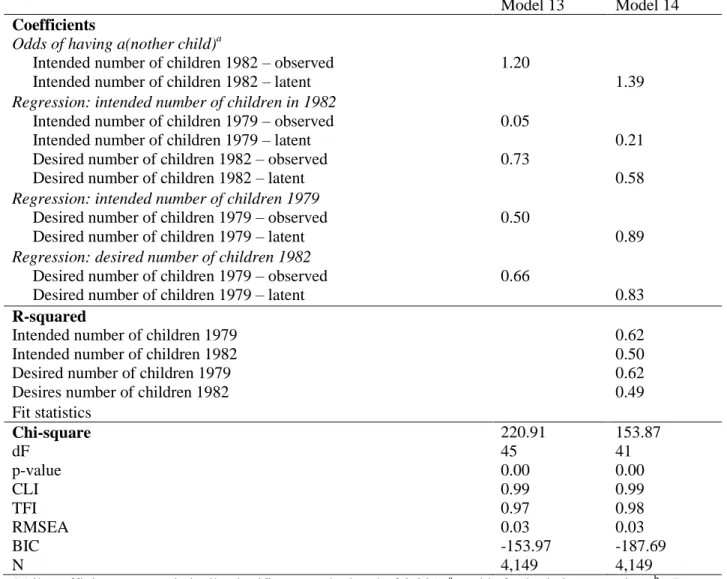
In the last step, I combine the two previous specifications and include both measures of desires and intentions in the model. For brevity, only two models are presented here – the one with all four measures introduced as observed and all four measures introduced as latent. In this specification, desires influence intentions but background and situational factors have impact on both intentions and desires. Only intentions influence behavior, not desires. Models in which background factors and situational factors had only indirect impact on intentions through desires were misspecified (see Appendix 2). Model that included a direct path from desires to behavior were also misspeified (see Appendix 2). Results are presented below in Table 7 and 8.
In this specification, the effect of the intended number of children in 1982 on the childbearing behavior is identical as in the Model 1. However once, the measurement error in all of the measures have been adjusted and the measures of the desired number of children were included in the estimation, the effect increased to 40%, as in the Model 6. All the effects of the desires on intentions and the measures of 1979 on measures of 1982 change once the equations include the measurement error. The direction of the change is not equal. The influence of the measures of 1979 on the measures in 1982 increases after adjusting for the measurement error but decreases for the impact of the desired number of children on the intended number of children. In this specification, measurement error explains 38% of the intended number of children in 1979, 50% of the variance in the intended number of children in 1982. In regards to the desired number of children, the measurement error explains again 38% of the variance in the measure of 1979 and 50% of the variance in the measure of 1982. Although the fit of the initial model is
26 Table 4 Desires: Results for Models 7-12.
Model 7 Model 8 Model 9 Model 10 Model 11 Model 12 Coefficients
Desired number of children 1979 –
observed 0.49
Desired number of children 1982 –
observeda 1.19 1.19
Desired number of children 1979 –
latent 0.52 0.52 0.79
Desired number of children 1982 –
latenta 1.23 1.21 1.29
R-squaredb
Desired number of children 1979 0.96 0.69
Desired number of children 1982 0.87 0.94 0.58
Fit statistics
Chi-square 0 0.08 0 119.48 42.59
dF 0 1 0 20 20
p-value 0 0.77 0 0 0.00
CFI 1 1 1 0.97 0.99
TLI 1 1.01 1 0.89 0.98
RMSEA 0 0 0 0.04 0.02
BIC 0 -8.25 0 -47.13 -124.03
N 4,149 4,149 4,149 4,149 4,149
27
Table 5 Complete results: Estimation of models with the intended number of children. Model 1 Model 3 Model 4 Model 5 Model 6 Regression: intended number of children in 1982
Intended number of children 1979 observed 0.36 *** 0.4 ***
Intended number of children 1979 latent
0.46 *** 0.65 ***
# of children in 1982 -0.36 *** -0.30 *** -0.33 *** -0.35 *** -0.41 ***
Age in 1982 -0.04 -0.01 -0.01 -0.01 -0.03
Mother work while growing up -0.01 -0.01 -0.01 -0.01
Years of education – mother 0.00 0.00 0.01 0.01
Years of education – father 0.03 0.02 0.03 0.03
Race: Hispanic (ref. White) 0.04 * 0.03 0.03 0.03
Race: Black (ref. White) -0.01 0.00 0.00 0.00
# of siblings - 0 (ref. 2) -0.01 -0.02 -0.02 -0.02
# of siblings - 1 (ref. 2) 0.00 0.00 0.00 0.00
# of siblings - 3+ (ref. 2) 0.06 ** 0.02 0.03 0.03
Goes to church at least once a week 0.07 *** 0.04 ** 0.04 ** 0.04 **
Lives in urban area 0.01 0.00 0.00 0.00
Lives in the South -0.09 *** -0.06 *** -0.06 *** -0.07 ***
Education: not enrolled finished high school
(ref. In college) -0.08 *** -0.06 *** -0.07 ** -0.07 ** -0.09 ***
Education: in high school (ref. In college) -0.04 -0.02 -0.03 -0.03 -0.04
Education: not enrolled, did not finish high school
(ref. In college) -0.08 *** -0.07 *** -0.07 *** -0.08 *** -0.09 ***
Married in 1982 (ref. Single) -0.02 -0.04 -0.04 -0.04 -0.06 **
Separated in 1982 (ref. Single) -0.04 ** -0.02 -0.03 -0.03 -0.03
Unemployed in 1982 (ref. Employed) -0.02 -0.01 -0.01 -0.01 -0.01
Out of labor force in 1982 (ref. Employed) -0.03 -0.03 -0.03 -0.03 -0.04
Equation of having a(nother) child within the next three years - odds
Intended number of children 1982 observed 1.20 *** 1.20 *** Intended number of children 1982 latent
1.29 *** 1.29 *** 1.42 ***
# of children in 1982 0.93 0.93 0.97 0.97 1.02
Age in 1982 0.97 0.97 0.97 0.97 0.98
Mother work while growing up 1.04 1.04 1.04 1.04 1.04
28
Years of education – father 0.97 0.97 0.97 0.97 0.97
Race: Hispanic (ref. White) 1.18 1.18 1.17 1.17 1.17
Race: Black (ref. White) 2.23 *** 2.23 *** 2.25 *** 2.24 *** 2.28 ***
# of siblings - 0 (ref. 2) 0.45 0.45 0.45 0.45 0.44 **
# of siblings - 1 (ref. 2) 1.04 1.04 1.04 1.04 1.04
# of siblings - 3+ (ref. 2) 1.12 1.12 1.11 1.11 1.10
Goes to church at least once a week 1.04 1.04 1.03 1.03 1.01
Lives in urban area 0.99 0.99 0.99 0.99 0.98
Lives in the South 0.67 *** 0.67 *** 0.68 *** 0.68 *** 0.69 ***
Education: in high school (ref. In college) 1.60 ** 1.60 ** 1.62 ** 1.62 ** 1.65 ** Education: not enrolled, did not finish high school
(ref. In college) 2.74 *** 2.74 *** 2.79 *** 2.78 *** 2.84 ***
Married in 1982 (ref. Single) 4.25 *** 4.25 *** 4.29 *** 4.29 *** 4.34 ***
Separated in 1982 (ref. Single) 1.74 *** 1.74 *** 1.77 *** 1.77 *** 1.82 ***
Unemployed in 1982 (ref. Employed) 1.18 1.18 1.19 1.19 1.19
Out of labor force in 1982 (ref. Employed) 1.46 *** 1.46 *** 1.46 *** 1.46 *** 1.47 ***
Regression: intended number of children in 1979 Mother work while growing up
-0.01 Years of education – mother
0.03 Years of education – father
0.05 Race: Hispanic (ref. White)
0.07 *** Race: Black (ref. White)
-0.06 ** # of siblings - 0 (ref. 2)
0.00 # of siblings - 1 (ref. 2)
0.01 # of siblings - 3+ (ref. 2)
0.08 ** Goes to church at least once a week
0.17 *** Lives in urban area
0.01 Lives in the South
29
Table 6 Complete results: Estimation of models with the desired number of children. Model 7 Model 9 Model 10 Model 11 Model 12
Regression: desired number of children in 1982
Desired number of children 1979 observed 0.49 *** 0.52 ***
Desired number of children 1979 latent
0.52 *** 0.79 ***
# of children in 1982 0.16 *** 0.13 *** 0.15 *** 0.14 *** 0.18 ***
Age in 1982 -0.02 -0.02 -0.03 -0.02 -0.02
Mother work while growing up -0.01 -0.01 -0.01 -0.01
Years of education – mother 0.01 0.01 0.01 0.01
Years of education – father 0.03 0.02 0.02 0.02
Race: Hispanic (ref. White) 0.03 0.03 0.03 0.03
Race: Black (ref. White) -0.02 0.01 0.01 0.01
# of siblings - 0 (ref. 2) -0.01 0.00 0.00 0.00
# of siblings - 1 (ref. 2) 0.01 0.00 0.00 0.00
# of siblings - 3+ (ref. 2) 0.06 ** 0.03 0.03 0.03
Goes to church at least once a week 0.08 *** 0.04 ** 0.04 0.04
Lives in urban area 0.01 0.01 0.01 0.01
Lives in the South -0.10 *** -0.05 *** -0.05 *** -0.05 ***
Education: not enrolled finished high school
(ref. In college) -0.07 *** -0.05 *** -0.05 -0.05 -0.07 **
Education: in high school (ref. In college) -0.04 -0.02 -0.03 -0.03 -0.03
Education: not enrolled, did not finish high school
(ref. In college) -0.08 *** -0.06 *** -0.06 ** -0.06 ** -0.08 **
Unemployed in 1982 (ref. Employed) -0.01 0.00 0.00 0.00 0.00
Out of labor force in 1982 (ref. Employed) -0.01 0.01 0.01 0.01 0.01
Equation of having a(nother) child within the next three years - odds
Desired number of children 1982 observed 1.19 *** 1.19 *** Desired number of children 1982 latent
1.22 *** 1.21 *** 1.29 ***
# of children in 1982 0.79 *** 0.79 *** 0.79 *** 0.79 *** 0.78 ***
Age in 1982 0.96 0.96 0.96 0.96 0.96
Mother work while growing up 1.03 1.03 1.03 1.03 1.03
Years of education – mother 0.99 0.99 0.99 0.99 0.99
Years of education – father 0.96 0.96 0.96 ** 0.96 0.96 **
Race: Hispanic (ref. White) 1.18 1.18 1.18 1.18 1.19
30
# of siblings - 0 (ref. 2) 0.43 ** 0.43 ** 0.43 ** 0.43 ** 0.43 **
# of siblings - 1 (ref. 2) 1.03 1.03 1.03 1.03 1.03
# of siblings - 3+ (ref. 2) 1.11 1.11 1.11 1.11 1.11
Goes to church at least once a week 1.03 1.03 1.02 1.03 1.02
Lives in urban area 0.98 0.98 0.98 0.98 0.98
Lives in the South 0.67 *** 0.67 *** 0.68 *** 0.67 *** 0.68 ***
Education: not enrolled finished high school
(ref. In college) 3.76 *** 3.76 *** 3.79 *** 3.77 *** 3.85 ***
Education: in high school (ref. In college) 1.6 ** 1.61 ** 1.61 ** 1.61 ** 1.62 ** Education: not enrolled, did not finish high school
(ref. In college) 2.75 *** 2.75 *** 2.77 *** 2.76 *** 2.81 ***
Married in 1982 (ref. Single) 4.24 *** 4.24 *** 4.25 *** 4.24 *** 4.28 ***
Separated in 1982 (ref. Single) 1.72 *** 1.72 *** 1.73 *** 1.73 *** 1.75 ***
Unemployed in 1982 (ref. Employed) 1.18 1.18 1.18 1.18 1.18
Out of labor force in 1982 (ref. Employed) 1.44 *** 1.44 *** 1.44 *** 1.44 *** 1.44 ***
Regression: desired number of children in 1979
Mother work while growing up
-0.01 Years of education – mother
0.00 Years of education – father
0.03 Race: Hispanic (ref. White)
0.02 Race: Black (ref. White)
-0.04 # of siblings - 0 (ref. 2)
-0.01 # of siblings - 1 (ref. 2)
0.01 # of siblings - 3+ (ref. 2)
0.07 ** Goes to church at least once a week
0.12 *** Lives in urban area
0.01 Lives in the South
31
Table 7 Desires and intentions: results for Models 13 and 14.
Model 13 Model 14
Coefficients
Odds of having a(nother child)a
Intended number of children 1982 – observed 1.20
Intended number of children 1982 – latent 1.39
Regression: intended number of children in 1982
Intended number of children 1979 – observed 0.05
Intended number of children 1979 – latent 0.21
Desired number of children 1982 – observed 0.73
Desired number of children 1982 – latent 0.58
Regression: intended number of children 1979
Desired number of children 1979 – observed 0.50
Desired number of children 1979 – latent 0.89
Regression: desired number of children 1982
Desired number of children 1979 – observed 0.66
Desired number of children 1979 – latent 0.83
R-squared
Intended number of children 1979 0.62
Intended number of children 1982 0.50
Desired number of children 1979 0.62
Desires number of children 1982 0.49
Fit statistics
Chi-square 220.91 153.87
dF 45 41
p-value 0.00 0.00
CLI 0.99 0.99
TFI 0.97 0.98
RMSEA 0.03 0.03
BIC -153.97 -187.69
N 4,149 4,149
32 Table 8 Full results of models 13 and 14.
Model 13 Model 14 Regression: intended number of children in 1979
Desired number of children 1979 observed 0.66 ***
Desired number of children 1979 latent 0.83 ***
Mother work while growing up 0.00 0.00
Years of education - mother 0.02 0.02
Years of education - father 0.02 0.01
Race: Hispanic (ref. White) 0.04 *** 0.05 **
Race: Black (ref. White) -0.03 -0.03
# of siblings - 0 (ref. 2) 0.02 0.02
# of siblings - 1 (ref. 2) 0.00 0.00
# of siblings - 3+ (ref. 2) 0.03 0.02
Goes to church at least once a week 0.07 *** 0.06 ***
Lives in urban area 0.01 0.00
Lives in the South -0.04 ** -0.02
Regression: desired number of children in 1979
Mother work while growing up -0.01 -0.01
Years of education – mother 0.00 0.01
Years of education – father 0.03 0.04
Race: Hispanic (ref. White) 0.01 0.03
Race: Black (ref. White) -0.04 -0.04
# of siblings - 0 (ref. 2) -0.02 -0.02
# of siblings - 1 (ref. 2) 0.01 0.01
# of siblings - 3+ (ref. 2) 0.06 ** 0.08 **
Goes to church at least once a week 0.10 *** 0.13 ***
Lives in urban area 0.01 0.02
Lives in the South -0.12 *** -0.15 ***
Regression: intended number of children in 1982
Intended number of children 1979 observed 0.05 ***
Intended number of children 1979 latent 0.21 **
Desired number of children 1982 observed 0.73 ***
Desired number of children 1982 latent 0.58 ***
# of children in 1982 -0.47 *** -0.62 ***
Age in 1982 -0.02 -0.03
Education: not enrolled finished high school (ref. In college) -0.02 -0.04
Education: in high school (ref. In college) -0.01 -0.02
Education: not enrolled, did not finish high school (ref. In college) -0.02 -0.03
Married in 1982 (ref. Single) -0.01 -0.03
Separated in 1982 (ref. Single) -0.02 -0.03
Unemployed in 1982 (ref. Employed) -0.01 -0.01
Out of labor force in 1982 (ref. Employed) -0.02 -0.03
Regression: desired number of children in 1982
Desired number of children 1979 observed 0.50 ***
Desired number of children 1979 latent 0.90 ***
# of children in 1982 0.13 *** 0.23 ***
Age in 1982 -0.02 -0.01
Education: not enrolled finished high school (ref. In college) -0.05 ** -0.07
Education: in high school (ref. In college) -0.02 -0.03
33
Married in 1982 (ref. Single) -0.01 -0.03
Separated in 1982 (ref. Single) -0.02 -0.02
Unemployed in 1982 (ref. Employed) 0.00 0.00
Out of labor force in 1982 (ref. Employed) 0.01 0.01
Equation of having a(nother) child within the next three years - odds
intended number of children 1982 observed 1.20 ***
intended number of children in 1982 latent 1.40 ***
# of children in 1982 0.93 1.01
Age in 1982 0.97 0.97
Mother work while growing up 1.04 1.04
Years of education – mother 1.00 1.00
Years of education – father 0.97 0.97
Race: Hispanic (ref. White) 1.18 1.19
Race: Black (ref. White) 2.23 *** 2.28 ***
# of siblings - 0 (ref. 2) 0.45 0.45
# of siblings - 1 (ref. 2) 1.04 1.04
# of siblings - 3+ (ref. 2) 1.12 1.10
Goes to church at least once a week 1.04 1.01
Lives in urban area 0.99 0.98
Lives in the South 0.67 *** 0.69 ***
Education: not enrolled finished high school (ref. In college) 3.76 *** 3.94 ***
Education: in high school (ref. In college) 1.60 ** 1.64 **
Education: not enrolled, did not finish high school (ref. In college) 2.74 *** 2.83 ***
Married in 1982 (ref. Single) 4.25 *** 4.32 ***
Separated in 1982 (ref. Single) 1.74 *** 1.81 ***
Unemployed in 1982 (ref. Employed) 1.18 1.19
34
CHAPTER 4: CONCLUSIONS
The aim of this paper was to assess the statistical reliability of two widely used measures of childbearing preferences – the intended and the desired number of children and verify any change in the impact of these measures on the childbearing behavior between specification with no measurement error and with measurement error. In addition, I compared the models that utilize only the intended number of children, the desired number of children and both of these measures to predict the childbearing behavior to verify which specification has the best statistical fit. To reach this aim, I utilized the structural
equations framework to simultaneously estimate the measurement models for the childbearing measures and the explanatory models for the childbearing behavior. The outcome of interest was the odds of having a(nother) child within the next three years and I estimated the models for a sample of young American women from the National Longitudinal Survey of Youth.
35
final model with measurement error. In addition, the measurement error in the measures of intentions and desires does not markedly alternate other effects in the model that remain stable across different
specifications.
The effects of the intended number of children and the desired number of children on the odds of having a(nother) child within the next three years when only one of these measures was utilized were similar – 40% for the intentions and 30% for the desires. Additionally, the measurement error accounted for the similar amount of the variance in both measures. Background covariates such as family size or parental education as well as situational factors such as enrollment, employment and marital status seem to influence both intentions and desires in the same way. Both specifications also had a similar,
acceptable statistical fit. Yet, preliminary analysis established that these measures are distinguished by the respondents. To summarize these results, one might conclude that however the desired and intended number of children of children are distinct concepts, they are influenced by the same situational and background factors and have a similar influence on the childbearing behavior. In the absence of one of the measures, utilizing another one would yield very similar results in the prediction of behavior. Lastly, the background and situational factors have both direct effects on the behavior and indirect effects mediated through desires and intentions. The latter result is not supported by the existing theories of the
relationship between intentions and fertility however a similar results was observed by Mencarini and colleagues (2015).
36
the intended number of children in 1979 had a strong positive impact on the intended number of children in 1982; same relationship was observed for the desired number of children.
Desires and intentions were not influenced by the situational and background factors included in this analysis. Only the desired number of children had a significant and marked (sufficiently large) effect on the intended number of children in 1979 and predicted the majority of the variance in the measure (73.5%). Only religiosity and residence in the South had any marked influence on the desired number of children in 1979 and the included covariates explained only 5% of its variance. The intended and desired number of children in 1982 were influenced only by their previous values and the number of children a woman already had (the intended number of children was also influenced as mentioned before by the desired number of children). These covariates alone explained over 80% of the variance in both of these measures. This analysis provides evidence that desires have a strong influence on the intentions and preferences from previous years influence current preferences however little can be said about other determinants of the initial desires that seem to explain future desires and current intentions. Net of desires, none of the background or situational factors impacts the intentions in a significant way. This highlights the importance of the desires in the childbearing decision research.
37
38
APPENDIX 1: DIMENSIONALITY
This Appendix contains a discussion about the dimensionality of desires and intentions. Two specifications are being analyzed – a model where the intended and the desired number of children are treated as separate latent concepts and a model where they are treated as indicator of a one latent concept. In the first step, I compare the means for the variables in 1979 and in 1982 and the correlation between the measures. I started with utilizing the t-test to determine whether the means of the variables are significantly different. I compare the means for the entire population and I later divided the sample by race. I decided to use the 0.001 p-value limit because the NLSY-79 sample is large and even small differences could be marked as significant. Results are presented in Table 10.
Table 1 Means and t-test for the difference between measures of the intended and desired number of children.
All women White Black Hispanic
Mean Std.
Err. Mean
Std.
Err. Mean
Std.
Err. Mean
Std. Err. Intended number of children
1979 2.31 .022 2.34 .026 2.07 .053 2.52 .06
Desired number of children
1979 2.54 .024 2.57 .029 2.36 .052 2.63 .06
Intended number of children
1982 1.86 .019 1.89 .025 1.68 .047 1.97 .05
Desired number of children
1982 2.37 .020 2.35 .025 2.31 .045 2.49 .05
t-test p-value
Intentions = Desires 1979 0.0000 0.0000 0.0000 0.0346
Intentions = Desires 1982 0.0000 0.0000 0.0000 0.0000
In general, the means between desires and expectations in 1979 and 1982 are significantly different. Only Hispanic women might treat the intended and desired number of children in 1979 as similar measures. The correlation between the measures is high but not close to 1 which would be
expected if the measures were truly indistinguishable. However the relationship between the measures can be blurred by the measurement error that is in the center of this study. In the second step, I build a
measurement model which treats the desired and the intended number of children as separate but
39
the model will have a good statistical fit. If this specification is not correct and the measures load on one latent concept, the model will have a poor fit and the measure should be highly correlated. In some cases, when the measures are indistinguishable, the estimated correlation between the measures in the sample might exceed the value of 1. I will verify if this happens for this model. In the third step I build a
measurement model that treats both measures as indicators of one concept – if this specification is correct, the model fit should be much better than the fit of the models with two concepts. This model is presented in the Figure 2. The fit statistics and the correlations between the concepts are presented in the Table 11.
Model 1 has a better fit than model 2. However, the values of CFI, TLI and RMSEA are comparable, they are always slightly better for model 1. In addition, BIC is negative for model 1
indicating a better fit thant he positive BIC for model 2. Positive BIC indicates that the model does not fit the data better than the saturated model. In addition, the correlation between the concepts in model 1 is equal to 0.83 for the measures in 1979 and 0.969 for the measures in 1982. However the correlation is higher for the latent concepts than it was for the observed measures, is it not equal to zero. To summarize, this analysis provides evidence that however the concepts are closely correlated, they are distinguishable by the respondents and should be treated as separate.
Table 2 Fit statistics of models presented in Figure 1 and 2.
Model 1 Model 2
Fit statistics
Chi-square 20.69 101.58
dF 4 10
p-value 0.00 0.00
CFI 0.99 0.99
TLI 0.99 0.98
RMSEA 0.03 0.05
BIC -12.64 18.27
40
Figure 1 Model 1: the desired and intended number of children as separate concepts.
Figure 2 Model 2: the desired and intended number of children as indicators of the same concept.
Preferences T1
Intentions T1 Desires T1
Preferences T2
Intentions T2 Desires T2
Intentions T1 Desires T1
Desires T1 Intentions T1
Intentions T2 Desires T2
41
APPENDIX 2: RELATIONSHIP BETWEEN THE DESIRED, INTENDED NUMBER OF CHILDREN AND THE CHILDBEARING BEHAVIOR
In this appendix, different specifications of the relationship between the intended, desired number of children and the childbearing behavior outcome – having a(nother) child within the next three years are analyzed. In the first model, I assume that all the background and situational factors impact is mediated through desires. The impact of desires is mediated through intentions. In the second model, the
background and situational factors influence both desires and intentions. In the third model, the background and situational factors influence desires, intentions and behavior. In the fourth model, the background and situational factors influence desires, intentions and behavior and desires influence behavior net of intentions. Figures 1-4 below present estimated models. Models that include only
observed measures are usually exactly identified and I cannot obtain similar fit statistics and models with only two measures in 1982 or two measures in 1979 will not converge therefore I had to compare the fully developed models with all four latent measures. In all of the models, the variance of the errors of the observed measures of intentions in 1979 and 1982 are set to equal. The variances of the errors of the observed measures of desires in 1979 and 1982 are set to equal. Measures of desires and intentions in 1979 are correlated. Measures of desires and intentions in 1982 are correlated.
Table 1 Fit statistics for the models presented in Figures 1- 4 below.
Model 1 Model 2 Model 3 Model 4
Chi-square 855.49 632.15 153.93 141.26
Df 83 61 41 40
p-value 0 0 0 0
CFI 0.94 0.96 0.99 0.99
TLI 0.93 0.87 0.98 0.98
RMSEA 0.04 0.05 0.03 0.03
BIC 164.05 123.98 -187.63 -191.96
Additional warnings
Negative residual variance of the latent concept of intentions in
1982
42
Figure 1 Background factors and situational factors influence only desires. Desires influence only intentions.
Figure 2 Background factors and situational factors influence desires and intentions. Desires influence only intentions.
43