ISSN-L: 2501 - 1235 Available on-line at: www.oapub.org/edu
Copyright © The Author(s). All Rights Reserved.
doi: 10.5281/zenodo.2551848 Volume 5 │ Issue 1 │ 2018
DEVELOPMENT OF DISCRIMINANT MODEL FOR CLASSIFYING
THE VOLLEYBALL PLAYERS ON THE BASIS OF SELECTED
ANTHROPOMETRIC VARIABLES ACCORDING
TO THEIR PLAYING POSITION
Nandkishor Pawari
Assistant Professor, Dr., Department of Education (Physical Education)
Regional Institute of Education, Bhopal, Madhya Pradesh, India
Abstract:
The aim of the study was to identify anthropometric variables that discriminate the male volleyball players according to different playing positions i.e., libero (n=16), setter (n=16), and middle blocker (n=20). The anthropometric variables included Standing height, Body weight, Arm length, Wrist circumference, Palm width, Thigh circumference, Calf circumference and Leg length. Multiple Discriminant functions revealed five significant function (p<0.05) i.e. height, weight, arm length, thigh circumference and wrist circumference; which primarily represented in different playing positions. After validation, the analysis showed that 90.4 % of players were correctly classified in their respective playing position.
Keywords: volleyball, discriminant analysis, player positions, anthropometric variables
1. Introduction
An athlete’s anthropometric characteristics represent important prerequisites for successful participation in any given sport. It has been suggested that volleyball players at different positions have different anthropometric characteristics, especially in height. Success in sport competitions has been associated with specific anthropometric characteristics (Jiang D et al. 2007). Only when a volleyball team is collectively equipped with all the ideal anthropometric characteristics can the team win the dominance in the height over the net is a decisive factor for volleyball games, determined by the athletes’ stature and jumping height, and shown in blocking height and spiking height. The height over the volleyball net always means the mastery of the game. The height is decided by a combination of the athlete’s body height and the
jumping height, and usually it is shown in blocking height and spiking height. A team will lose its capacity of winning a score if there is a lack of predominance over the net (Tian, 2006). The knowledge of these characteristics is necessary to establish their importance for the success in competitive sport. Specifically speaking the role played by the player in relation to the position in which he plays different from others.
2. Methods
Fifty two subjects namely Libero (n=16), Setter (n=16) & Middle blocker (n=20) were purposely selected from top eight teams of Senior National Volleyball Championship, 2013. The eight selected anthropometric variables namely Standing height, Body weight, Arm length, Palm width, Wrist circumference, Thigh circumference, Calf circumference and Leg length were selected to construct a multiple discriminant model. Height was measured with the help of Stadiometer in Centimeters. Weight was measured with the help of weighing machine in Kilograms. Palm width was measured with the help of Sliding caliper. Arm length, Leg length, Wrist circumference, Thigh circumference, Calf circumference was measured with the help of Gullick tape in Centimeters. The data were analyzed with the help of Descriptive statistics- Mean and Standard Deviation and Multiple Discriminant analysis to determine which variables were most predictive for volleyball and to determine how accurately the model predicted the groups.
3. Results
The data were analyzed by using multiple discriminant analysis for developing discriminant function for classifying volleyball players according to their playing positions. The analyses were carried by using IBM SPSS software package (ver. 20.0). The results so obtained are discussed in this section.
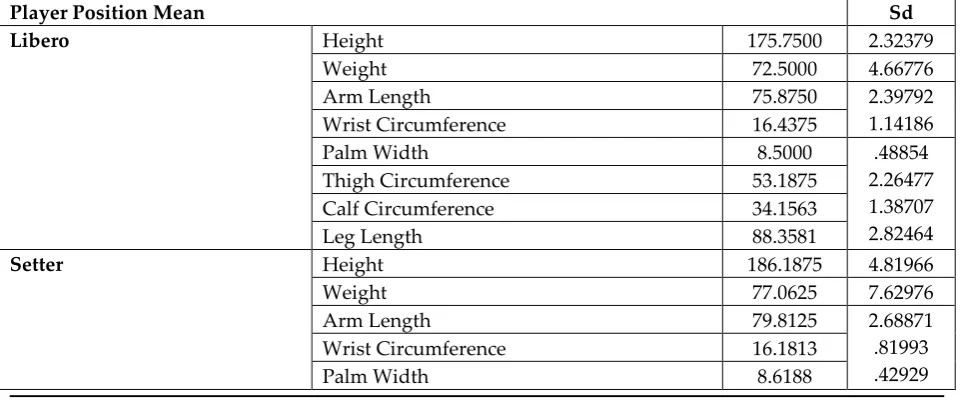
Table 1: Group statistics: mean and standard deviation of
all the independent variables in different group
Player Position Mean Sd
Libero Height 175.7500 2.32379
Weight 72.5000 4.66776
Arm Length 75.8750 2.39792
1.14186
Wrist Circumference 16.4375
Palm Width 8.5000 .48854
2.26477 1.38707 2.82464
Thigh Circumference 53.1875
Calf Circumference 34.1563
Leg Length 88.3581
Setter Height 186.1875 4.81966
Weight 77.0625 7.62976
Arm Length 79.8125 2.68871
.81993
│ │
Thigh Circumference 54.7500 3.58701
1.53297 4.61534
Calf Circumference 35.3750
Leg Length 94.9000
Middle Blocker Height 195.6500 4.09460
Weight 83.3700 7.76504
Arm Length 86.3250 1.81133
Wrist Circumference 17.1555 .74220
Palm Width 9.0700 .47251
2.62215 1.76082
Thigh Circumference 54.6750
Calf Circumference 36.4950
Leg Length 104.1000 4.49151
Total Height 186.6154 9.15264
Weight 78.0846 8.18903
4.98305
Arm Length 81.1058
Wrist Circumference 16.6348 .98464
.52222
Palm Width 8.7558
Thigh Circumference 54.2404 2.89098
Calf Circumference 35.4308 1.83491
Leg Length 96.4256 7.76999
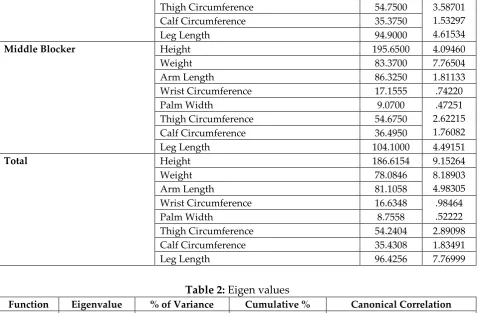
Table 2: Eigen values
Function Eigenvalue % of Variance Cumulative % Canonical Correlation
1 6.443a 93.1 93.1 .930
2 .479a 6.9 100.0 .569
a. First 2 canonical discriminant functions were used in the analysis.
Table 2 shows the eigenvalue and canonical correlation values. This table shows that the values of canonical correlations of function 1 & 2 are .930 and .569 respectively. Since square of the correlation explains the variance, hence function 1 explained 86.49 %( =.9302)of the variation in categorizing the volleyball player in to Libero or (Setter and
Middle blocker) whereas function 2 explained 33.91 % (=.5692) of the variation in
categorizing the volleyball player in to Middle blocker or (Setter and Libero) by the independent variables in the developed model.
Table 3: Wilks' Lambda
Test of Function(s) Wilks' Lambda Chi-square df Sig.
1 through 2 .091 112.724 10 .000
2 .676 18.381 4 .001
Wilks’ lambda indicates the significance of the discriminant function. The Table 3
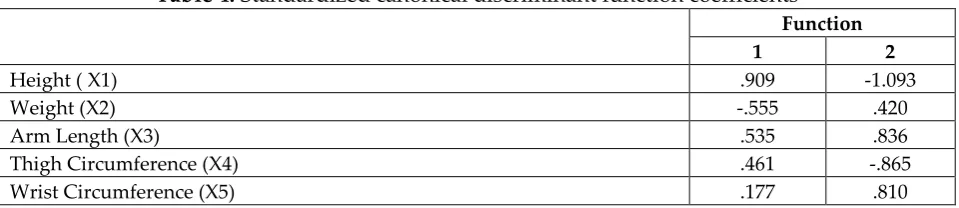
Table 4: Standardized canonical discriminant function coefficients
Function
1 2
Height ( X1) .909 -1.093
Weight (X2) -.555 .420
Arm Length (X3) .535 .836
Thigh Circumference (X4) .461 -.865
Wrist Circumference (X5) .177 .810
Table 4 shows the discriminating power of the variables in the model. The variables having higher magnitude of the absolute function value is more powerful in discriminating the volleyball player in to different playing position. Since for function 1 the absolute function value of height was .909, hence this variable had the highest discriminating power in categorizing volleyball player in to libero or (setter and middle blocker) whereas the wrist circumference variable had least discriminating power because its absolute function value was .177 which is least. For function 2 the absolute function value of height was -1.093 hence this variable had the highest discriminating power in categorizing volleyball player in to middle blocker or (setter and libero) whereas the variable weight had the least discriminating power because its absolute function values was .420 which is least.
Table 5: Canonical discriminant function coefficients (unstandardized coefficients)
Function
1 2
Height (X1) .206 -.247
Weight (X2) -.080 .061
Arm Length (X3) .234 .365
Thigh Circumference (X4) .161 -.303
Wrist Circumference (X5) .195 .896
(Constant) -63.108 13.394
The unstandardised discriminant coefficients shown in the Table 5 were used for constructing discriminant functions. The stepwise method was used in this analysis and only five variables were retained in the model due to its significant discriminating power. Remaining variables did not get selected in the model as they were not found to have sufficient discriminating power. Thus, the discriminant functions one (Z1) was
constructed by using the values of constants and unstandardized discriminant coefficients of the five identified variables in the model whereas the second function (Z2) was developed by using five variables identified in the model as shown in Table 5 .
Z1 = -63.108 + .206 × (X1) - .080 × (X2) +. 234 × (X3) + .161 × (X4) + .195 × (X5)
│ │
Table 6: Functions at group centroids
Player Position Function
1 2
Libero -3.166 .520
Setter -.302 -1.004
Middle Blocker 2.774 .387
Unstandardized canonical discriminant functions evaluated at group means
Table 6 shows the means for the transformed group centriods. These three means have been plotted on the two functions as shown in the Figures 1 and2.
-3.166 -.302 0 2.774
Libero Setter Value of Z1 Middleblocker
Figure 1: Means of the transformed group centriods in the first function z1
1.004 -.387 0 .520 Setter Middle Blocker Value of Z2 Libero
Figure 2: Means of the transformed group centriods in the first function z2
Figure 1 gives the decision rule for classifying any volleyball player into different playing position as per their suitability. If the discriminant score of any volleyball player on the first function is less than zero (Z1<0), he is classified into libero and setter
and if it is greater than zero (Z1>0), he is classified as middle blocker. Figure 2 gives the
decision rule for classifying any subject into any of the three groups. If the discriminant score of any volleyball player is greater than zero (Z2>0), he is classified as libero and if
it is less than zero (Z2<0), he is classified into setter and middle blocker.
Table 7: Classification matrix of predicted group membership Classification Resultsa,C
Predicted Group Membership
Total Player Position Libero Setter Middle Blocker
Original Count Libero 16 0 0 16
16 20
Setter 2 12 2
Middle Blocker 0 1 19
% Libero 100.0 .0 .0 100.0
100.0 100.0
Setter 12.5 75.0 12.5
Middle Blocker .0 5.0 95.0
A. 90.4% Of Original Grouped Cases Correctly Classified.
4. Discussion
The purpose of this investigation was to study the discriminating power of anthropometric characteristics of elite Indian volleyball players at different playing positions (libero, setter and middle blocker).Multiple discriminant analysis was computed to develop a multiple discriminant model to identify the suitability of volleyball player into three different playing positions (libero, setter and middle blocker). Multiple discriminate analyses generated two discriminant functions. Function 1 accounted 86.49 % of the variance and function 2 accounted for 33.91 % of the variance. The developed models overall classified 90.4 % of the original cases correctly. The discriminant function model correctly classified middle blocker, setter and libero with 95.0 %, 75.0 % and 100.0 % accuracy. The variables having higher magnitude of the absolute function value is more powerful in discriminating the volleyball players in to different playing positions. Since for function 1 the absolute function value of height was .909 hence this variable had the highest discriminating power in categorizing volleyball player in to libero or (setter and middle blocker) whereas the wrist circumference variable had least discriminating power because its absolute function value was .177 which is least. For function 2 the absolute function value of height was -1.093 hence this variable had the highest discriminating power in categorizing volleyball player in to middle blocker or (setter and libero) whereas the variable weight had the least discriminating power because its absolute function values was .420 which is least. This model can be used to classify the volleyball players into different playing positions as per their suitability.
│ │
generated, also players having longer arm length can contact the ball at greater height and cover more area during blocking situations.
5. Conclusion
Volleyball players at different positions have different anthropometric characteristics. Anthropometric profiles indicate whether the player would be suitable for the competition at the highest level in a specific sport , anthropometric parameters have significant role on performing all technical and tactical components especially block and Spike. It is concluded that the importance of tall stature in volleyball is considered as dominant factor for elite level of performance in all the aspects of volleyball may be in terms of spike, block and floor defense. Arm length, weight, wrist girth also play significant contribution in the performance of spike. By keeping the above discriminant functions in mind, coaches may select the players for the talent identification.
A volleyball team collectively equipped with all the ideal anthropometric characteristics can have the dominance in a game (Chen, 2005). Height has been reported to be a discriminating factor between successful and non-successful teams (Morrow et al., 1979).
Coaches can use these results to make training programs more specific, e.g., players positions should spend more time improving their efficacy in task related to their specific positions.
References
Chen X.R. (1989). Handbook of Volleyball, Published by Si Chuan Dictionary Press. Chen X.R. (2005). Volleyball. Beijing: Higher Education Press.
Claessens et al. (1999). The contribution of anthropometric characteristics to performance scores in elite female gymnasts. Journal of Sports Medicine and Physical Fitness, (39), 355-360.
Gaurav V., Singh M., Singh S. (2010). Anthropometric characteristics, somatotyping and body composition of volleyball and basketball players. Journal of Physical Education and Sports Management, 1(3), 28-32.
Hakkinen K. (1993). Changes in physical fitness profile in female volleyball players during the competitive season. Journal of Sports Medicine & Physical Fitness, 33, 223-232.
Jiang D., et al. (2007). Research on the Somatotype Growth of the Adolescents of Han Nationality in the West of Liaoning Province Journal of Modern Preventive Medicine, 34, 13.
Morrow, J.R. et al. (1979). Importance of strength, speed, and body size for team success in women's intercollegiate volleyball. Research Quarterly, 50, 429-437.
Tian M.J. (2006). Sports traing. Beijing: Higer Education Press.
│ │
Creative Commons licensing terms