ISSN: 2278-3369
International Journal of Advances in Management and Economics
Available online at:
www.managementjournal.info
RESEARCH ARTICLE
Impact of Corporate Governance on the Performance of Banks
Vedapradha R*, Hariharan Ravi
Department of Commerce & Management. Joseph’s College of Commerce, Bangalore, India.
*Corresponding Author: Vedapradha R
Abstract
Boards of directors are instrumental in influencing banks’ effective performance through corporate governance. They play a pivotal role in making critical decisions based on their skills, expertise knowledge. The composition of the directors in a bank influences the quality in addressing the issues, approaches to decision making. The researcher has considered various variables like return on assets, interest spread, return on assets, profit per employee etc., in identifying the significance of the same on the quality of functionality of the board. No of meetings, outside directors and size of board have impact on corporate governance in public sector commercial banks. However these factors have negative impact and less effective on performance.
Keywords:
Board of directors, Return on asset, Bankage and performance.Introduction
The board of directors and top management are placed in the structure of corporate to interface, interact and intervene, when necessary, to carry on the running of the company efficiently. It is ultimately responsible for the operations and financial soundness of the bank. The board of directors is increasingly being known as a critical success factor for corporations, be they large or small, private or public. This understanding and appreciation of the role of the boards as being valuable has resulted in several recommendations to boost their contributions to success of companies by innumerable committees.
Some of the previous studies focus on the impact of corporate governance on the performances of banks. Bank related studies have had similar findings that Large Banking Holding Companies (BHCs), have a statistical significant and it is positive impact between board size and performance, found by both Belkhir [1]. In addition, the average BHCs’ board is larger than its non-bank counterparts [1]. A strategic board can be built to ensure better governance practices. Board size and its negative impact
with firm performance is a common finding in the corporate governance literature. The smaller the size of the board, the greater will be the involvement of its members. Adams and Mehran Smaller boards are effective and value additive because of their nimbleness, cohesiveness, and less communication and coordination costs as well as less ‘free-riding’ director problems. However, this relationship depends upon a firm’s economic environment. The firms with greater advising needs (such as diversified firms and on heavily debt-financing) may benefit from large boards. Some of the researchers have concluded that the board of directors has much impact on the performance of companies especially in terms of the association with the external environment.
the quality of strategic decisions that ultimately impact on performance.
The board meetings frequency is also considered to increase board’s effectiveness in monitoring managers. The importance of attending board meetings for bank directors is emphasized in various instances as in OCC (1997) director’s book. The greater frequency of meetings is likely to result in superior performance. An opposing view professed is that routine tasks absorb much of a board’s meeting time and thus limit the opportunities for outside directors to exercise meaningful control over management. Boards should to relatively inactive and evidence of higher board activity is likely to symbolize a response to poor performance.
Independence should be the essence of strategic boards. To achieve this end, it is advisable to have less number of insiders and more of outsiders. As Susan F. Shultz points out, this kind of composition of the board will add to the proactiveness of the company’s board. Further, an insider’s allegiance is likely to be to his or her boss and not necessarily to the company’s shareholders. Another downside to an insider dominated board is that only can the CEO intimidate insiders, but insiders can also inhibit the CEO”.
Most of literature on corporate governance has discussed upon the board composition and bank performance uses variables like Tobin’s Q, return on asset, return on equity, EBITD, cost and profit efficiency are used. The corporate governance like board size, ratio of outside directors, meetings, ownership structure, board independence, CEO age and CEO duality are
also used. This gives an idea for the researcher to find out the impact of corporate governance on the performance of select banks in India.
This paper explains the impact of corporate governance on the performance of select public sector commercial banks. The corporate governance and its impact on the performance of select banks are assessed with suitable corporate governance (independent) and performance (dependent) variables. The corporate governance variables like board size (lbos), ratio of outside director (rod) and meeting (lme) are used.
The performance variables like return on equity (roe), return on asset, net interest margin (nim) interest spread (is), business per employee (bpe), profit per employee (plpe), net non performing asset (nnpa) and loan (lloan) are used; the two control variables like bank age (bnkg) and deposits (ldep) are also used.
The data related to above said variables are collected through secondary source i.e from corporate governance report and balance sheet of eight public sector commercial banks for the period of ten years (2005-2015). The panel data regression is used to analyze the impact of corporate governance on the performance variables of select public sector commercial banks.
Corporate Governance and its Impact
on Return on Equity (ROE)
The model of the Panel data regression is roeit (performance) = α + 1lbosit + 2lrodit + 3lmeit +
4bnkgit + 5ldepit + εit … (1)
Table 1:Corporate governance and its impact on return on equity
Variables
Return on Equity (roe)
Pooled OLS Fixed effect model Random effect model (GLS)
I II III
Const (48.09)***
(14.64) [3.28]
(49.69)*** (15.09)
[3.29]
(48.09)*** (13.25)
[3.63]
Lbos (-0.14)
(2.86) [-0.05]
(6.43)* (3.84) [1.68]
(-0.14) (3.56) [-0.04]
Rod (-1.90)
(4.02) [-0.47]
(-14.62)** (6.05) [-2.42]
(-1.90) (5.61) [-0.34]
Lme (-8.30)**
(3.62)
(-6.73)*** (2.05)
[-2.30] [-3.29] [-2.53]
Bnkg (0.06)***
(0.01) [4.70]
(0.00) (0.02) [0.08]
(0.06)** (0.02) [2.60]
Ldep (-1.11)
(0.85) [-1.30]
(-2.11)*** (0.68) [-3.12]
(-1.11) (0.72) [-1.55]
Number of obs 80 80 80
F Test 2.40
(0.04)
2.93 (0.00)
R-squared 0.14 0.51
Durbin-Waston 1.76 2.13
Wald Test Chi-square
11.58 (0.17) Hausman test
chi-square
12.32 (0.03) Statistically significant at 0.01(***), 0.05(**) and 0.10(*) level.
Source: Computed results based on compiled data collected from CMIE Prowess Pvt. Ltd
From the above, it is observed that the Wald test’s Chi square value (11.58) is not significant, it indicates that the data are pooled and it is appropriate to use Pooled OLS than fixed effect model. In Hausman test, the estimated chi square value (12.32) is significant; it says that the error terms are correlated with one or more explanatory variables in the model. Hence the fixed effect model is considered to be more appropriate than random effect model.
The fixed effect model reveals the significance of corporate governance namely board size (lbos) has positive significance at 0.10 per cent level. The board size increase has positive impact on the return on equity by increasing in the performance of banks. The ratio of outside directors (rod), meeting (lme) and deposits (ldep) has negative significance 0.05 and 0.01 per cent levels. The decrease in the outside directors,
meeting and deposits has negative impact by decrease in the performance of return on equity. The R-sq value is 0.51 (51 per cent) which tells that corporate governance (independent variables) have 51 per cent impact on the return on equity (dependent variable). The Durbin-Waston (2.13) shows that there is no first order serial correlation in the error term between the variables. The ‘F’ value (2.93) is significant. So the null hypothesis (H02) is rejected and it is considered that there is a significant impact of corporate governance on the performance of return on equity in public sector commercial banks in India.
Corporate Governance and its Impact
on Return on Asset (ROA)
The model of the Panel data regression is roait (performance) = α + 1lbosit + 2lrodit + 3lmeit +
4bnkgit + 5ldepit + εit … (2)
Table 2: Corporate Governance and its Impact on Return on Asset
Variables
Return on Asset (roa)
Pooled OLS Fixed effect model Random effect model (GLS)
I II III
Const (0.71)
(0.87) [0.81]
(0.64) (0.60) [1.07]
(0.70) (0.74) [0.95]
Lbos (0.40)
(0.15) [2.61]
(0.613)*** (0.21) [2.86]
(0.41)** (0.20) [2.03]
Rod (-0.46)
(0.31) [-1.50]
(-1.03)*** (0.34) [-3.00]
(-0.46) (0.32) [-1.45]
Lme (-0.17)
(0.20) [-0.84]
(0.02) (0.16) [0.14]
(-0.17) (0.18) [-0.93]
Bnkg (0.00)***
(0.00) [5.82]
(-0.00) (0.00) [-0.53]
Ldep (-0.03) (0.04) [-0.60]
(-2.11) (0.04) [-1.14]
(-0.02) (0.04) [-0.73]
Number of obs 80 80 80
F Test 3.01
(0.01)
4.22 (0.00)
R-squared 0.17 0.60
Durbin-Waston 1.76 1.97
Wald Test Chi-square
20.55 (0.00) Hausman test
chi-square
1.98 (0.85) Statistically significant at 0.01(***), 0.05(**) and 0.10(*) level.
Source: Computed results based on compiled data collected from CMIE Prowess Pvt. Ltd
From the above, it is observed that the Wald test chi square value (20.55) is significant, it indicates that the data are not pooled and it is appropriate to use fixed effect model than Pooled OLS model. In Hausman test the estimated chi square value (1.98) is not significant, it says that the error terms are uncorrelated with one or more explanatory variables in the model. Hence the random effect model is considered as more appropriate than fixed effect model.
The random effect model is check with the LM test, whether to use random effect model or Pooled OLS model to discuss on the results. The LM test, chi square value (1.66) is not significant, so it indicates that there is no significant difference across units (no panel effect). Therefore, it’s better to use Pooled OLS model than the random effect model. The Pooled OLS
model reveals the positive significance of bank’s age (bnkg) on the return on assets at 0.01 per cent level, and the R-sq value is 0.17 (17 per cent) which tells that corporate governance (independent variables) have impact of 17 per cent on the return on asset (dependent variable). The Durbin-Waston (1.76) shows that there is no first order serial correlation in the error term between the variables. The ‘F’ value (3.01) is also significant. So the null hypothesis (H02) is rejected, there is significant impact of corporate governance on the performance of return on asset in public sector commercial banks.
Corporate Governance and its Impact
on Net Interest Margin (NIM)
The model of the Panel data regression is nimit (performance) = α + 1lbosit + 2lrodit + 3lmeit +
4bnkgit + 5ldepit + εit … (3)
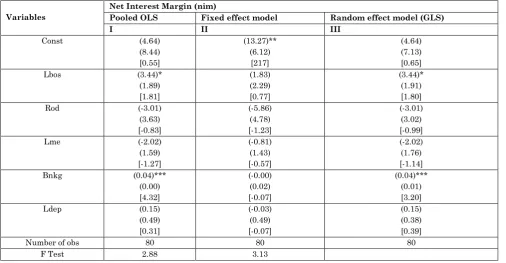
Table 3: Corporate governance and its impact on net interest margin
Variables
Net Interest Margin (nim)
Pooled OLS Fixed effect model Random effect model (GLS)
I II III
Const (4.64)
(8.44) [0.55]
(13.27)** (6.12)
[217]
(4.64) (7.13) [0.65]
Lbos (3.44)*
(1.89) [1.81]
(1.83) (2.29) [0.77]
(3.44)* (1.91) [1.80]
Rod (-3.01)
(3.63) [-0.83]
(-5.86) (4.78) [-1.23]
(-3.01) (3.02) [-0.99]
Lme (-2.02)
(1.59) [-1.27]
(-0.81) (1.43) [-0.57]
(-2.02) (1.76) [-1.14]
Bnkg (0.04)***
(0.00) [4.32]
(-0.00) (0.02) [-0.07]
(0.04)*** (0.01) [3.20]
Ldep (0.15)
(0.49) [0.31]
(-0.03) (0.49) [-0.07]
(0.15) (0.38) [0.39]
Number of obs 80 80 80
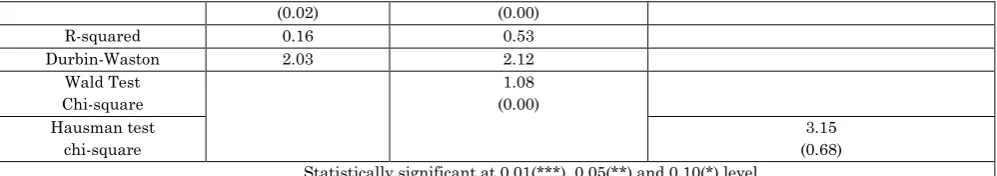
(0.02) (0.00)
R-squared 0.16 0.53
Durbin-Waston 2.03 2.12
Wald Test Chi-square
1.08 (0.00) Hausman test
chi-square
3.15 (0.68) Statistically significant at 0.01(***), 0.05(**) and 0.10(*) level.
Source: Computed results based on compiled data collected from CMIE Prowess Pvt. Ltd
From the table it is observed that the Wald test chi square value (1.08) is significant, it indicates that the data are not pooled one and it is appropriate to use fixed effect model than Pooled OLS model. In Hausman test, the estimated chi square value (3.15) is not significant; it says that the error terms are uncorrelated with one or more explanatory variables in the model. Hence the random effect model is considered as more appropriate than fixed effect model.
The random effect model is checked with the LM test, whether to use random effect model or Pooled OLS model to discuss on the results. The LM test, chi square value (1.17) is not significant, so there is no significant difference across units (no panel effect). Therefore, it is better to use Pooled OLS model than the random effect model. The Pooled OLS model reveals positive significance in the board size (lbos) at 0.10 per cent level. The board size increase has positive impact on the return on equity by increasing the performance of banks. The bankage (bnkg) also
shows the positive significance at 0.01 per cent level on the performance of net interest margin. The R-sq value is 0.16 (16 per cent) which tells that corporate governance (independent variable) have effect 16 per cent on the net interest margin (dependent variable). The Durbin-Waston (2.03) shows that there is no first order serial correlation in the error term between the variables. The ‘F’ value (2.88) is also significant. So the null hypothesis (H02) is rejected and it is considered that there is significant impact of corporate governance on the performance of net interest margin in public sector commercial banks.
Corporate Governance and its Impact
on Interest Spread (IS)
The model of the Panel data regression is isit (performance) = α + 1lbosit + 2lrodit + 3lmeit +
4bnkgit + 5ldepit + εit … (4) ts
Table 4: Corporate governance and its impact on interest spread
Variables
Interest Spread (is)
Pooled OLS Fixed effect model Random effect model (GLS)
I II III
Const (1.87)
(1.15) [1.63]
(5.47)*** (1.33) [4.11]
(1.87) (1.71) [1.60]
Lbos (0.54)***
(0.14) [3.86]
(0.43) (0.39) [1.07]
(0.54)* (0.31) [1.74]
rod (0.46)
(0.24) [1.93]
(-1.22)** (0.47) [-2.61]
(0.46) (0.49) [0.94]
lme (0.17)
(0.19) [0.88]
(0.44)** (0.19) [2.30]
(0.17) (0.29) [0.59]
bnkg (-0.00)
(0.00) [-0.89]
(-0.00)* (0.00) [-1.88]
(-0.00) (0.00) [-0.85]
ldep (0.02)
(0.08) [0.25]
(-0.17) (0.09) [-2.23]
(0.02) (0.06) [0.32]
Number of obs 80 80 80
F Test 1.64
(0.16)
R-squared 0.09 0.44
Durbin-Waston 1.63 1.81
Wald Test Chi-square
17.60 (0.02) Hausman test
chi-square
4.21 (0.52) Statistically significant at 0.01(***), 0.05(**) and 0.10(*) level.
Source: Computed results based on compiled data collected from CMIE Prowess Pvt. Ltd
From the above, it is observed that the Wald test, chi square value (17.06) is significant, it indicates that the data are not pooled one and it is appropriate to use fixed effect model than the Pooled OLS model. In Hausman test the estimated chi square value (4.21) is not significant, it says that the error terms are uncorrelated with one or more explanatory variables in the model. Hence the random effect model is considered as more appropriate than fixed effect model.
The random effect model is check with the LM test, whether to use random effect model or Pooled OLS model to discuss on the results. The LM test, chi square value (0.60) is not significant, so there is no significant difference across units (no panel effect). Therefore, it’s better to use Pooled OLS model than the random effect model. The Pooled OLS model reveals the positive significance of board size (lbos) on the
performance at 0.01 per cent levels, and the R-sq
value is 0.09 (nine per cent) which tells that corporate governance (independent variable) have effect nine per cent on the interest spread (dependent variable). The Durbin-Waston (1.63) shows that there is no first order serial correlation in the error term between the variables. The ‘F’ value (1.64) is not significant. So the null hypothesis (H02) is accepted and it is considered that there is no significant impact of corporate governance on the performance of interest spread in public sector commercial banks.
Corporate Governance and its Impact
on Business per Employees (BPE)
The model of the Panel data regression is bpeit (performance) = α + 1lbosit + 2lrodit + 3lmeit +
4bnkgit + 5ldepit + εit … (5)
Table 5: Corporate governance and its impact on business per employee
Variables
Business Per Employee (bpe)
Pooled OLS Fixed effect model Random effect model (GLS)
I II III
Const (-142.93)**
(68.03) [-2.10]
(-595.71)** (51.07) [-11.66]
(-142.93)* (75.16)
[-1.90]
Lbos (0.62)
915.81) [0.04]
(40.29)*** (9.59) [4.20]
(0.62) 920.11)
[0.03]
Rod (-97.23)***
(15.44) [-6.30]
(1.86) (31.96)
[0.06]
(-97.23)*** (31.83)
[-3.05]
Lme (26.32)
(17.76) [1.48]
(6.45) (20.43)
[0.31]
(26.32) (18.55) [1.42]
Bnkg (0.07)
(0.08) [0.84]
(0.02) (0.11) [0.21]
(0.07) (0.12) [0.51]
Ldep (15.81)***
(2.75) [5.76]
(38.85)*** (3.42) [11.36]
(15.81)*** (4.06) [3.89]
Number of obs 80 80 80
F Test 4.44
(0.00)
R-squared 0.23 0.67
Durbin-Waston 1.64 2.43
Wald Test Chi-square
369.48 (0.00) Hausman test
chi-square
2.77 (0.73) Statistically significant at 0.01(***), 0.05(**) and 0.10(*) level.
Source: Computed results based on compiled data collected from CMIE Prowess Pvt. Ltd
From the above, it is observed that the Wald test chi square value (369.48) is significant, it indicates that the data are not pooled one and it is appropriate to use fixed effect model than Pooled OLS model. In Hausman test the estimated chi square value (2.77) is not significant, it says that the error terms are uncorrelated with one or more explanatory variables in the model. Hence the random effect model is considered to be more appropriate than fixed effect model.
The random effect model is checked with the LM test, whether to use random effect model or Pooled OLS model to discuss on the results. The LM test chi square value (1.98) is not significant, so there is no significant difference across units (no panel effect). Therefore it is better to use Pooled OLS model than random effect model. The Pooled OLS model reveals the negative significance of ratio of outside directors (rod) at 0.01 per cent level. The decrease in the ratio of outside directors has negative impact on the
performance of business per employee. The deposits (ldep) show the positive significance at 0.01 per cent level. The increase in the deposits has its positive impact on the performance of business per employee. The R-sq value is 0.23 (23 per cent) which tells that corporate governance (independent variable) have effect 23 per cent on the business per employee (dependent variable). The Durbin-Waston (1.64) shows that there is no first order serial correlation in the error term between the variables. The ‘F’ value (4.44) is significant. So the null hypothesis (H02) is rejected and it is concluded that there is significant impact of corporate governance on the performance of business per employee in public sector commercial banks.
Corporate Governance and its Impact
on Profit Per Employees (PLPE)
The model of the Panel data regression is plpeit (performance) = α + 1lbosit + 2lrodit + 3lmeit +
4bnkgit + 5ldepit + εit … (6)
Table 6: Corporate Governance and its Impact on Profit per Employees
Variables
Profit Per Employees (plpe)
Pooled model Fixed effect model Random effect model (GLS)
I II III
Const (-9.97)**
(5.12) [-1.95]
(-10.65)*** (3.21) [-3.32]
(-9.97)** (3.85) [-2.59]
Lbos (-0.24)
(0.67) [-0.36]
(1.21) (0.73) [1.66]
(-0.24) (1.03) [-0.23]
Rod (-0.41)
(1.04) [-0.39]
(-2.03) (2.18) [-0.93]
(-0.41) (1.63) [-0.25]
Lme (2.26)**
(1.43) [1.58]
(2.14)* (1.26) [1.70]
(2.26)** (0.95) [2.37]
Bnkg (0.00)
(0.00) [0.46]
(-0.00) (0.00) [-0.69]
(0.00) (0.00) [0.30]
Ldep (0.53)**
(0.24) [2.17]
(0.34) (0.23) [1.44]
(0.53)** (0.20) [2.56]
Number of obs 80 80 80
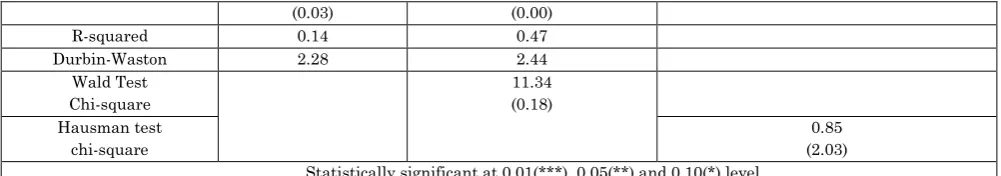
(0.03) (0.00)
R-squared 0.14 0.47
Durbin-Waston 2.28 2.44
Wald Test Chi-square
11.34 (0.18) Hausman test
chi-square
0.85 (2.03) Statistically significant at 0.01(***), 0.05(**) and 0.10(*) level.
Source: Computed results based on compiled data collected from CMIE Prowess Pvt. Ltd
From the above, it is observed that the Wald test chi square value (11.34) is not significant, it indicates that the data are pooled one and it is appropriate to use Pooled OLS model than fixed effect model. In Hausman test the estimated chi square value (4.21) is not significant, it says that the error terms are uncorrelated with one or more explanatory variables in the model. Hence the random effect model is considered to be more appropriate than fixed effect model.
The random effect model is check with the LM test, whether to use random effect model or Pooled OLS model to discuss on the results. The LM test chi square value (1.58) is not significant, so there is no significant difference across units (no panel effect). Therefore it’s better to use Pooled OLS model than random effect model. The Pooled OLS model reveals that there is positive significance of meeting (lme) and deposits (ldep) at 0.05 per cent levels. The increase in the meeting and deposits has positive impact on the
performance of profit per employee. The R-sq value is 0.14 (14 per cent) which tells that corporate governance (independent variable) have effect 14 per cent on the profit & loss per employee (dependent variable). The Durbin-Waston (2.28) shows that there is no first order serial correlation in the error term between the variables. The ‘F’ value (2.48) is also significant. So the null hypothesis (H02) is rejected and it is concluded that there is significant impact of corporate governance on the performance of profit per employee in public sector commercial banks.
Corporate Governance and its Impact
on Loan (LLOAN)
The model of the Panel data regression is lloanit (performance) = α + 1lbosit + 2lrodit + 3lmeit +
4bnkgit + 5ldepit + εit … (7).
Table 7: Corporate governance and its impact on loan
Variables
Loan (lloan)
Pooled model Fixed effect model Random effect model (GLS)
I II III
Const (-7.07)***
(1.11) [-6.38]
(-3.89)*** (1.31) [-2.99]
(-7.08)*** (1.94) [-3.65]
Lbos (0.40)
(0.36) [1.01]
(-0.39) (0.28) [-1.35]
(0.40) (0.52) [0.77]
Rod (-0.45)
(0.32) [-1.39]
(0.01) (0.45) [0.03]
(-0.45) (0.82) [-0.55]
Lmee (2.25)***
(0.31) [7.21]
(1.44)*** (0.31) [4.61]
(2.24)*** (0.48) [4.68]
Bnkg (-0.00)***
(0.00) [-4.22]
(-0.00)*** (0.00) [-3.87]
(-0.00)*** (0.00) [-2.86]
Ldep (0.87)
(0.09) [9.54]
(0.89) (0.12) [7.44]
(0.87)*** (0.10) [8.34]
F Test 18.38 (0.00)
9.37 (0.00)
R-squared 0.55 0.77
Durbin-Waston 2.09 2.55
Wald Test Chi-square
13.10 (0.11) Hausman test
chi-square
1.77 (0.88) Statistically significant at 0.01(***), 0.05(**) and 0.10(*) level.
Source: Computed results based on compiled data collected from CMIE Prowess Pvt. Ltd
From the above, it is observed that the Wald test chi square value (13.10) is not significant, it indicates that the data are pooled one and it is appropriate to use Pooled OLS model than fixed effect model. In Hausman test the estimated chi square value (1.77) is not significant, it says that the error terms are uncorrelated with one or more explanatory variables in the model. Hence the random effect model is considered as more appropriate than fixed effect model.
The random effect model is checked with the LM test, whether to use random effect model or Pooled OLS model to discuss on the results. The LM test chi square value (1.82) is not significant, so there is no significant difference across units (no panel effect). Therefore it’s better to use Pooled OLS model than random effect model. The Pooled OLS model reveals the positive significance of meeting (lme) and bankage (bnkg) on the performance at 0.01 per cent levels. The increase in meeting and bankage has positive
impact on the performance of loan. The R-sq value is 0.55 (55 per cent) which tells that corporate governance (independent variable) have effect 55 per cent on the loan margin (dependent variable). The Durbin-Waston (2.28) shows that there is no first order serial correlation in the error term between the variables. The ‘F’ value (2.09) is also significant. So the null hypothesis (H02) is rejected, so there is significant impact of corporate governance on the performance of loan in public sector commercial banks.
Corporate Governance and its Impact
on Net Non Performing Asset (NNPA)
The model of the Panel data regression is nnpait (performance) = α + 1lbosit + 2lrodit + 3lmeit +
4bnkgit + 5ldepit + εit … (8)
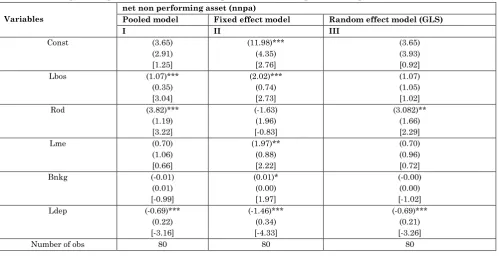
Table 8: Corporate governance and its impact on net non performing asset
Variables
net non performing asset (nnpa)
Pooled model Fixed effect model Random effect model (GLS)
I II III
Const (3.65)
(2.91) [1.25]
(11.98)*** (4.35) [2.76]
(3.65) (3.93) [0.92]
Lbos (1.07)***
(0.35) [3.04]
(2.02)*** (0.74) [2.73]
(1.07) (1.05) [1.02]
Rod (3.82)***
(1.19) [3.22]
(-1.63) (1.96) [-0.83]
(3.082)** (1.66) [2.29]
Lme (0.70)
(1.06) [0.66]
(1.97)** (0.88) [2.22]
(0.70) (0.96) [0.72]
Bnkg (-0.01)
(0.01) [-0.99]
(0.01)* (0.00) [1.97]
(-0.00) (0.00) [-1.02]
Ldep (-0.69)***
(0.22) [-3.16]
(-1.46)*** (0.34) [-4.33]
(-0.69)*** (0.21) [-3.26]
F Test 3.76 (0.00)
2.95 (0.00)
R-squared 0.20 0.51
Durbin-Waston 2.15 2.03
Wald Test Chi-square
31.70 (0.00)
Test Hausman chi-square 3.79
(0.58) Statistically significant at 0.01(***), 0.05(**) and 0.10(*) level.
Source: Computed results based on compiled data collected from CMIE Prowess Pvt. Ltd
From the above, it is observed that the Wald test chi square value (313.70) is significant, it indicates that the data are not pooled one and it is appropriate to use fixed effect model than Pooled OLS model. In Hausman test the estimated chi square value (3.78) is not significant, it says that the error terms are uncorrelated with one or more explanatory variables in the model. Hence the random effect model is considered to be more appropriate than fixed effect model.
The random effect model is check with the LM test, whether to use random effect model or Pooled OLS model to discuss on the results. The LM test chi square value (1.47) is not significant, so there is no significant difference across units (no panel effect). Therefore it is better to use Pooled OLS model than random effect model. The Pooled OLS model reveals the positive significance of board size (lbos) and ratio of outside directors (rod) significant at 0.01 per cent levels. The increase in the board size and ratio of outside directors has its positive impact on the performance of net non performing asset. The deposits (ldep) show negative significant at 0.01 per cent level. The decrease in the deposits has negative impact on the performance of net non performing asset. The R-sq value is 0.20 (20 per cent) tells that corporate governance
(independent variable) have effect 20 per cent on the net non performing asset (dependent variable). The Durbin-Waston (2.14) shows that there is no first order serial correlation in the error term between the variables.
The ‘F’ value (3.76) is significant. So the null hypothesis (H02) is rejected and it is concluded that there is significant impact of corporate governance on the performance of net non performing asset in public sector commercial banks [3-22].
Conclusion
In public sector commercial banks the governance namely board size, ratio of outside directors and meeting has its impact on the performance namely return on equity, return on asset, net interest margin, business per employee, profit & loss per employee, loan and net non performing asset.
In the public sector commercial banks, the outside directors have negative impact towards the performance. It is observed that the role of outside directors in board is less effectively impact on the performance of banks. The meetings conducted in the banks also have negative impact towards the performance. It is observed that meetings are less efficiently impact on the performance of banks. Hence it is concluded that there is impact between governance on the performance of selected public sector commercial banks.
References
1.Belkhir Mohamed (2004) Board structure, Ownership structure, and Firm performance: Evidence from Banking, Applied Financial Economics, 19(19):1581-1593.
2.Shultz Susan F (2002) The Board Book. The ICFAI Journal of Corporate Governance,1(1).
3.Ananya Mukherjee (2002) Reed corporate governance reforms in India, Journal of Business Ethics, 37(3):249.
5.Balasubramaniam SC, Ruda Prakash Pradhan (2005) Corporate Governance and its Role in Banking Sector, Finance India 19(4):1393-1404. 6.Banerjee Arindam (2004) Corporate
Governance: A Relook into the Indian Banking System, Available at SSRN:http://ssrn.com/ abstract=631681.
7.Basanta Kalita (2008) Post 1991 Banking Sector Reforms in India: Policies and Impacts, second Singapore International Conference on
Finance, Available at
SSRN:http://ssrn.com/abstract=1089020. 8.Belkhir Mohamed (2008) Board of Directors’
Size and Performance in the Banking Industry, International Journal of Managerial Finance, 5(1):1-24.
9.Benjamin E Hermalin, Michel S Weisbach (2003) Boards of Directors as an Endogenously Determined Institution: A Survey of the Economic Literature, FRBNY Economic Policy Review/7-26.
10. Benjamin E Hermalin, Michel S Weisbach (1988) The determinants of baords composition, RAND Journal of Economics, 19(4):589-606.
11. Beverley Jackling, Shireenjit Johl (2009) Board Structure and Firm Performance: Evidence from India’s Top Companies, Corporate Governance: An International Review, 17(4):492-509.
12. Chakrabarti Rajesh (2005) Corporate Governance in India- Evolution and Challenges, January 17. Available at SSRN: http://ssrn.com/abstract=649857.
13. Chakrabarti Rajesh, Megginson William, L Yadav, Pradeep K (2007)Corporate governance in India, Journal of Applied Corporate Finance, CFR working paper 08-02(8):1-25.
14. Charu G Raheja (2005) Determinants of Board Size and Composition: A Theory of Corporate Boards, Journal of Financial and Quantitative Analysis, 40(2).
15. Chatterjee DSH (2011) Board Composition and Performance in Indian Firms: A Comparative analysis empirical”, The International Journal of Management Science and Information Technology (IJMSIT), 1(2):1-15.
16. Christopher W Anderson, Terry L Campbell (2000) Corporate governance of Japanese banks,
http://papers.ssrn.com/paper.taf?abstract_id= 231950.
17. Hariharan R, Sudalaimuthu S (2015) Relationship between Corporate Governance and Performance of Select Banks, Disseminate Knowledge-International Journal of Research in Management Science and Technology, 3(1).
18. Hariharan Ravi, Vedapradha R (2016) Composition of Board in Public Sector Commercial Banks, International Journal for Innovative Research in Multidisciplinary Field, 2(8):1-8.
19. Hasnan Ahmed, András Gábor (2012) An Examination of the Relationship of Governance Structure and Performance: Evidence from Banking Companies in Bangladesh”, Society and Economy 34(4)643-666.
20. Hima Bindu Kota and Sarika Tomar (2010) Corporate governance practices in Indian firms, Journal of Management & Organization 16:266-279.
21. Houssem Rachdi, Ines Ghazouani Ben Ameur (2011) Board Characteristics, Performance and Risk Taking Behaviour in Tunisian Banks, International Journal of Business and Management, 6(6).