ISSN: 2501 - 1235 ISSN-L: 2501 - 1235 Available on-line at: www.oapub.org/edu
doi: 10.5281/zenodo.1296539 Volume 4 │ Issue 8 │ 2018
NORMS CONSTRUCTION AND GRADING
FOR PHYSICAL FITNESS TEST ITEMS
Surinder Singhi,
Baljinder Singh Bal
Department of Physical Education (T), Guru Nanak Dev University, Amritsar,
Punjab, India
Abstract:
The present study was conducted to construct norms for selected physical fitness test items of handball players. For the purpose of the present study, fourty eight (N=48), male Handball players of Panjab University, Chandigarh between the age group of 18-25 years were selected as subjects. The Muscular Strength was measured by Handgrip Strength Test, Muscular Power was measured by Vertical Jump Test, Muscular Endurance was measured by Pull-Up Test, Running Speed was measured by 20-Meter Dash, Running Agility was measured by Illinois Agility Test, Jumping Ability was measured by Standing Long Jump Test, Throwing Ability was measured by Overhead Medicine Ball Throw Test, Flexibility was measured by Sit and Reach Flexibility Test and Balance was measured by Stork Balance Stand Test. The data, which was collected by administering tests, was statistically treated to develop for all the test items. In order to construct the norms, Percentile Scale was used. Further, the scores were classified into five grades i.e., very good, good, average, poor and very poor. In Muscular Strength, the mean score was 49.562 and standard deviation score was 3.679. In Muscular Power, the mean score was 48.062 and standard deviation score was 2.276. In Muscular Endurance, the mean score was 6.958 and standard deviation score was 1.098. In Running Speed, the mean score was 4.6354 and standard deviation score was 0.143. In Running Agility, the mean score was 17.606 and standard deviation was 0.834. In Jumping Ability, the mean score was 2.7260 and standard deviation was 0.415. In Throwing Ability, the mean score was 13.562 and standard deviation score was 0.976. In Flexibility, the mean score was 4.625 and standard deviation score was 0.832. In Balance, the mean score was 46.354 and standard deviation score was 1.561of Panjab University, Chandigarh.
Keywords: norms, muscular strength, muscular power, muscular endurance, running speed, running agility, jumping ability, throwing ability, flexibility and balance
1. Introduction
There is consensus that regular physical activity (PA) can improve physical fitness (PF) and health and assist in the prevention of disease (S. N. Blair & T. S. Church, 2004). Several studies have shown that physically active adults are healthier and have a higher PF than inactive adults throughout different nations and populations groups (Kuh et al., 2005, Dionne et al., 2003). Physical activity is therefore promoted as part of a healthy lifestyle (World Health Organization, 2010).
There are more than fifteen battery tests for the assessment of the physical fitness of children and adolescents and several key components of physical fitness currently in use worldwide (Castro-Pinero et al., 2010).
There have been many studies in team sports linking fitness and/or anthropometric test scores to playing level and success in sports such as American football, (Fry A, & Kraemer W, 1991; Black W, & Roundy E, 1994) soccer, (Abrantes C, Ma¸c as V, Sampaio J, 2004) rugby union, (Quarrie KL, Handcock P, Waller AE, 1995) Australian rules football, (Young WB, Pryor L, 2007) field hockey, (Keogh JW, Weber CL, Dalton CT, 2003) volleyball (Gualdi-Russo E, Zaccagni L., 2001) and basketball (Drinkwater EJ, Hopkins WG, McKenna MJ, 2007; Hoare DG, 2000).
2. Material and Methods
2.1 Selection of Subjects
For the purpose of the present study, fourty eight (N=48), male Handball players of
Panjab University, Chandigarh between the age group of 18-25 years were selected as
subjects.
3. Selection of Variables
The research investigator reviewed all the available scientific literature books, journals, periodicals, magazines and research papers pertaining to the study. Taking into consideration of the importance of variables and the relevance of the study the following variables were selected for this investigation.
3.1 Physical Fitness Test Items:
a) muscular strength;
b) muscular power;
c) muscular endurance;
d) running speed;
e) running agility;
f) jumping ability;
g) throwing ability;
h) flexibility;
3.2 Procedure
The Muscular Strength was measured by Handgrip Strength Test, Muscular Power was measured by Vertical Jump Test, Muscular Endurance was measured by Pull-Up Test, Running Speed was measured by 20-Meter Dash, Running Agility was measured by Illinois Agility Test, Jumping Ability was measured by Standing Long Jump Test, Throwing Ability was measured by Overhead Medicine Ball Throw Test, Flexibility was measured by Sit and Reach Flexibility Test and Balance was measured by Stork Balance Stand Test.
4. Statistical Analysis
The data, which was collected by administering tests, was statistically treated to develop for all the test items. In order to construct the norms, Percentile Scale was used. Further, the scores were classified into five grades i.e., very good, good, average, poor and very poor.
5. Results
For each of the chosen variable, the result pertaining to Descriptive Statistics (Mean & Standard Deviation) and Percentile Plot (Hi & Low) of selected physical fitness test items of handball players are presented in the following tables:
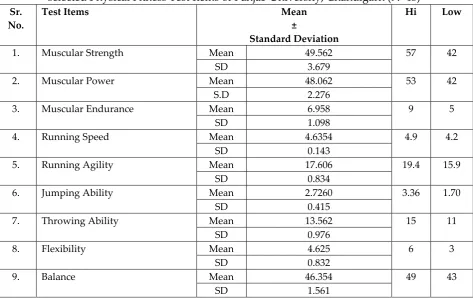
Table 1: Descriptive Statistics (Mean & Standard Deviation) and Percentile Plot (Hi & Low) of selected Physical Fitness Test Items of Panjab University, Chandigarh (N=48)
Sr. No.
Test Items Mean
±
Standard Deviation
Hi Low
1. Muscular Strength Mean 49.562 57 42
SD 3.679
2. Muscular Power Mean 48.062 53 42
S.D 2.276
3. Muscular Endurance Mean 6.958 9 5
SD 1.098
4. Running Speed Mean 4.6354 4.9 4.2
SD 0.143
5. Running Agility Mean 17.606 19.4 15.9
SD 0.834
6. Jumping Ability Mean 2.7260 3.36 1.70
SD 0.415
7. Throwing Ability Mean 13.562 15 11
SD 0.976
8. Flexibility Mean 4.625 6 3
SD 0.832
9. Balance Mean 46.354 49 43
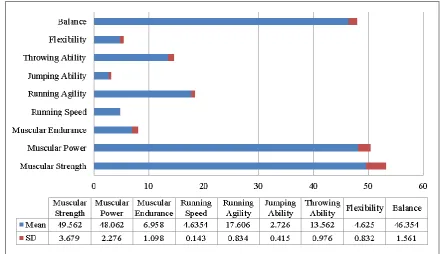
Table 1 shows that in Muscular Strength, the mean score was 49.562 and standard deviation score was 3.679. In Muscular Power, the mean score was 48.062 and standard deviation score was 2.276. In Muscular Endurance, the mean score was 6.958 and standard deviation score was 1.098. In Running Speed, the mean score was 4.6354 and standard deviation score was 0.143. In Running Agility, the mean score was 17.606 and standard deviation was 0.834. In Jumping Ability, the mean score was 2.7260 and standard deviation was 0.415. In Throwing Ability, the mean score was 13.562 and standard deviation score was 0.976. In Flexibility, the mean score was 4.625 and standard deviation score was 0.832. In Balance, the mean score was 46.354 and standard deviation score was 1.561of Panjab University, Chandigarh.
Figure 1: Descriptive Statistics (Mean & Standard Deviation) and Percentile Plot (Hi & Low) of selected Physical Fitness Test Items of Panjab University, Handball players
Table 2: Grading for the selected Physical Fitness Test Items of Panjab University, Chandigarh (N=48) Handball players
Test Items Very Poor Poor Average Good Very Good
Muscular Strength Less than (<) 42.204 42.204- 45.883 45.883- 53.241 53.241- 56.92 Greater than (>)56.92 Muscular Power Less than (<)
43.51 43.51-45.786 45.786- 50.338 50.338- 52.614 Greater than (>)52.614 Muscular Endurance
Less than (<) 3.253 3.253- 5.86 5.86- 8.056 8.056- 9.154 Greater than (>)9.154 Running Speed Greater than
(>)4.921 4.921- 4.778 4.778- 4.492 4.492- 4.349
Less than (<) 4.349 Running Agility Greater than
(>)19.274 19.274- 18.44 18.44 16.772 16.772-15.938
Less than (<) 15.938 Jumping Ability Less than (<)
11.61 12.586 14.538 15.514 (>)15.514 Flexibility Less than (<)
2.961
2.961- 3.793
3.793- 5.457
5.457- 6.289
Greater than (>)6.289 Balance Less than (<)
43.232
43.232- 44.793
44.793- 47.915
47.915-49.476
Greater than (>)49.476
The values listed in Table 2 gives a guide to expected scores of Panjab University, Chandigarh for the selected Physical Fitness Test Item. In Muscular Strength, the scores below 42.204 are considered very poor, from about 42.204-45.883 is considered poor, 45.883-53.241 is considered average, 53.241-56.92 is considered good and the scores above 56.92 are considered very good. In Muscular Power, the scores below 43.51 are considered very poor, from about 43.51-45.786 is considered poor, 45.786-50.338 is considered average, 50.338-52.614 is considered good and the scores above 52.614 are considered very good. In Muscular Endurance, the scores below 3.253 are considered very poor, from about 3.253-5.86 is considered poor, 5.86-8.056 is considered average, 8.056-9.154 is considered good and the scores above 9.154 are considered very good. In Running Speed, the scores above 4.921 are considered very poor, from about 4.921-4.778 is considered poor, 4.778-4.492 is considered average, 4.492-4.349 is considered good and the scores below 4.349 are considered very good. In Running Agility, the scores above 19.274 are considered very poor, from about 19.274- 18.44 is considered poor, 18.44-16.772 is considered average, 16.772-15.938 is considered good and the scores below 15.938 are considered very good. In Jumping Ability, the scores below 1.896 are considered very poor, from about 1.896-2.311 is considered poor, 2.311-3.141 is considered average, 3.141-3.556 considered good and the scores above 3.556 are considered very good. In Throwing Ability, the scores below 11.61 are considered very poor, from about 11.61-12.586 is considered poor, 12.586-14.538 is considered average, 14.538-15.514 is considered good and the scores above 15.514 are considered very good. In Flexibility, the scores below 2.961 are considered very poor, from about 2.961-3.793 is considered poor, 3.793-5.457 is considered average, 5.457-6.289 is considered good and the scores above 6.289 are considered very good. In Balance, the scores below 43.232 are considered very poor, from about 43.232-44.793 is considered poor, 44.793-47.915 is considered average, 47.915-49.476 is considered good and the scores above 49.476 are considered very good.
(c) (d)
(e) (f)
(g) (h)
(i)
Figure 2: Normal distribution of selected Physical Fitness Test Items (i.e., a. Muscular Strength, b. Muscular Power, c. Muscular Endurance, d. Running Speed, e. Running Agility, f. Jumping
6. Conclusions
1. To conclude, it is evident that in Muscular Strength, the scores below 42.204 are
considered very poor, from about 42.204-45.883 is considered poor, 45.883-53.241 is considered average, 53.241-56.92 is considered good and the scores above 56.92 are considered very good.
2. To conclude, it is evident that in Muscular Power, the scores below 43.51 are considered very poor, from about 43.51-45.786 is considered poor, 45.786-50.338 is considered average, 50.338-52.614 is considered good and the scores above 52.614 are considered very good.
3. To conclude, it is evident that in Muscular Endurance, the scores below 3.253 are
considered very poor, from about 3.253-5.86 is considered poor, 5.86-8.056 is considered average, 8.056-9.154 is considered good and the scores above 9.154 are considered very good.
4. To conclude, it is evident that in Running Speed, the scores above 4.921 are considered very poor, from about 4.921-4.778 is considered poor, 4.778-4.492 is considered average, 4.492-4.349 is considered good and the scores below 4.349 are considered very good.
5. To conclude, it is evident that in Running Agility, the scores above 19.274 are considered very poor, from about 19.274- 18.44 is considered poor, 18.44-16.772 is considered average, 16.772-15.938 is considered good and the scores below 15.938 are considered very good.
6. To conclude, it is evident that in Jumping Ability, the scores below 1.896 are considered very poor, from about 1.896-2.311 is considered poor, 2.311-3.141 is considered average, 3.141-3.556 considered good and the scores above 3.556 are considered very good.
7. To conclude, it is evident that in Throwing Ability, the scores below 11.61 are considered very poor, from about 11.61-12.586 is considered poor, 12.586-14.538 is considered average, 14.538-15.514 is considered good and the scores above 15.514 are considered very good.
8. To conclude, it is evident that in Flexibility, the scores below 2.961 are considered
very poor, from about 2.961-3.793 is considered poor, 3.793-5.457 is considered average, 5.457-6.289 is considered good and the scores above 6.289 are considered very good.
9. To conclude, it is evident that in Balance, the scores below 43.232 are considered
very poor, from about 43.232-44.793 is considered poor, 44.793-47.915 is considered average, 47.915-49.476 is considered good and the scores above 49.476 are considered very good.
7. Recommendations
The study can be broadened by involving players of different performance levels (i.e. state, national, and international).
A similar study may be undertaken using larger sample for overall better consistency of result.
Acknowledgements
Heartiest thanks and appreciation are extended to all players who served as subjects for this study and without whose help this study could not have been completed.
References:
1. Abrantes, C., Macas, V. & Sampaio, J. (2004). Variation in football players’ sprint
test performance across different ages and levels of competition. J Sports Sci Med, 3 (YISI 1): 44-9.
2. Black, W. & Roundy, E. (1994). Comparisons of size, strength, speed, and power
in NCAA Division 1-A football players. J Strength Cond Res, 8 (2): 80-5.
3. Castro-Pinero, J., Artero, E.G., Espana-Romero, V., Ortega, F.B., Sjostrom, M.,
Suni, J. (2010). Criterion related validity of field-based fitness tests in youth: A systematic review. British Journal of Sports Medicine, 44, 934-943.
4. D. Kuh, E. J. Bassey, S. Butterworth, R. Hardy, and M. E. J. Wadsworth. (2005).
Grip strength, postural control, and functional leg power in a representative cohort of British men and women: associations with physical activity, health status, and socioeconomic conditions, The Journals of Gerontology Series A: Biological Sciences and Medical Sciences, 60, 2, 224–231.
5. Drinkwater, E.J., Hopkins, W.G. & McKenna, M.J. (2007). Modeling age and
secular differences in fitness between basketball players. J Sports Sci, 25 (8): 869-78.
6. Fry, A. & Kraemer W. (1991). Physical performance characteristics of American collegiate football players. J Strength Cond Res 4. 5 (3): 126-38.
7. Gualdi-Russo, E. & Zaccagni, L. (2001). Somatotype, role and performance in elite volleyball players. J Sports Med Phys Fitness, 41 (2): 256-62.
8. Hoare, D.G. (2000). Predicting success in junior elite basketball players: the
contribution of anthropometric and physiological attributes. J Sci Med Sport, 3 (4): 391-405.
9. I. J. Dionne, P. A. Ades, and E. T. Poehlman. (2003). Impact of cardiovascular fitness and physical activity level on health outcomes in older persons, Mechanisms of Ageing and Development, 124, 3, 259–267.
11.Quarrie, K.L., Handcock, P. & Waller, A.E. (1995). The New Zealand rugby injury and performance project. III: anthropometric and physical performance characteristics of players. Br J Sports Med, 29 (4): 263-70.
12.S. N. Blair and T. S. Church. (2004). The fitness, obesity, and health equation: is
physical activity the common denominator? Journal of the American Medical Association, 292, 10, 1232–1234.
13.World Health Organization. (2010). Global recommendations on physical activity
for health.
14.Young, W.B., & Pryor, L. (2007). Relationship between pre-season
Creative Commons licensing terms