http://scienceasia.asia
_______________
Key words and phrases: Combinatorial optimization, Greenhouse Gases, Multi-objective Modeling, Mixed Integer Programming, Solid Waste Management.
© 2017 Science Asia 1 / 15
Multi-Objective Optimization Model Formulation for Solid Waste Management in Dar es Salaam, Tanzania
Halidi Ally Lyeme1, 3, Allen Mushi2, Yaw Nkansah-Gyekye1
Abstract: Solid waste management is a challenging problem in developing nations. The health and environmental negative implications associated with solid waste management are very serious particularly in the developing nations where a large percent of waste is dumped into open areas. These implications are essentially on climate change and global warming due to environmental problems. In this paper, a multi-objective optimization model is developed to address the conflicting multi-objectives of cost minimization, minimization of final waste disposal to the landfill, and environmental impact minimization. The model follows a mixed-integer programming formulation and tested by data from selected wards in Dar es Salaam city. The output is the best location of recycling plants, separating plants, composting plants, incinerating plants, landfill and waste flow allocation between them. The solution shows a high reduction of the amount of waste to the landfill and greenhouse gas emissions by 76% and 55.2% respectively compared to the current system.
1. Introduction
Societies in the world, especially in urban areas, are facing extended complications in managing their municipal solid waste (MSW) successfully and cost-effectively. The growing of waste portions, declining of landfill space, increasing public environmental consciousness, stern technical requisites on management options, as well as waste avoidance protocols and waste diversion goals have forced us to have different insight in MSW management. Observing that claims for appropriate MSW management has risen over time, the standpoint of waste management has constantly altered from open disposal to controlled dumpsite to integrated solid waste management (ISWM) system, which needs a mixture of strategies and agenda to manage the waste flow [1].
The disposal and management of solid waste are worldwide threats, particularly in developing nations due to their detrimental effects and the environmental and high consumption of public funds with little output service [2]. It is estimated that municipal authority in developing nations allocate up to 50% of their budget in each year to the management of solid waste, while service covers less than 50% of the population in the regions [3].
rapidly due to increase in the worldwide population levels over the last five decades [4]. The rapid urbanization, booming economies, and rise in human living standards are among the factors which contributed to high generation rate of solid waste [5]. Approximately about 95% of the generated solid waste is landfilled in open areas in developing countries, which causes problems to the environment. These landfills are the sources of Green House Gases (GHGs) emissions particularly methane and carbon dioxide emissions. These landfill gasses account for about 4% of total global GHG emissions which are causing climate change and global warming [6].
Solid waste management involves activities related to generation, collection and depository, transfer and transportation, treatment and dumping of solid wastes. The SWM requires an appropriate framework, upkeep and improvement for all operations. Consequently, this has become more costly and very complicated caused by the progressive and unexpected advancement of the town areas. The problems in providing the desired service in the town areas are frequently attributed to the poor economic condition to manage municipal corporate body [7]. Different alternatives are still accessible to manage the municipal solid waste like a waste to energy technology, use of a land application for waste composting, vermin-composting, digestion, and landfilling [8]. In the existing plot, most of the generated wastes are throw away in open dumps in developing nations and in landfills in developed nations [4].
Decision-makers and the professional must analyze the key technical, legal, economic, environmental, social and political issues connected to ISWM systems to establish a persuasive program for waste management. As the complication of SWM options increased, the choice of the most excellent waste management systems grow into a very complicated task. Thus, systems analysis and mathematical modeling methodology were introduced to solid waste management in order to assist the decision-maker [9]. With such approaches, each nation can make the exclusive system to take care of the diverse ingredients of the waste flow in an environmentally and economical sound manner.
The mathematical modeling technique introduced in this article was fostered by a municipal solid waste management problem that contains the location of various technologies. The benefits of multi-objective techniques to a single objective function were documented in SWM system literature. Some of the benefits referred to are the improvements of the extent to the decision-maker by considering the various angle of the problems, and the added resilience related to the models which are based only on economic [10]. The review of the SWM system literature reveals the limited extension of environmental factors as constraints in some models should exceed that of adding new environmental aspects. Therefore, the addition of more effective environmental objective in models, which includes GHG emissions CO2 and CH4 from both technologies and
Multi-objective models have been widely applied in the SWM problem with environmental considerations in the research literature. For example, [11] has developed a multi-objective model for SWM with two conflicting objectives. The total cost minimization and the environmental impact minimization which is measured by pollution are two objectives respectively.
The research done by [12] in the city of Duisburg (Germany) presented a multi-objective optimization model for solid waste flows, which aimed to assist the decision-maker on the optimum flows of solid waste transported to different facilities such as organic material treatment, refusal derived fuel (RDF), incinerator plants and sanitary landfill. Four objectives were considered which related to unrecycled waste, economic costs, sanitary landfill disposal and environmental impact (incinerator emissions). In addition, [13] proposed a multi-objective optimization model which integrates economic and environmental factors for the SWM system.
The study conducted by [14] formulated a model based on a multi-objective integer programming technique. The objective of their model is to recommend the optimum solution for transportation, processing and final disposal to different waste facilities with minimal cost and minimum environmental risk.
Furthermore, [9] have developed a multi-objective mixed integer programming model for interpreting the hidden adverse among the environmental and economic aspirations. The model was assessed in Kaohsiung city in Taiwan for the sustainable SWM programs. [15] developed a multi-objective model for solid waste collection system, whereby decision-making approach was considered with economic, environmental, technical and social aspects.
The models above are seen as a good representation of sustainable waste management systems that includes environmental objective with GHGs emission minimization. Moreover, the models are well addressed by presenting decision variables for the selection of technology type. However, the environmental impact cannot only be considered in incinerator emissions as presented by [12] but should be considered in other technologies such as recycling, composting and landfill as the sources for the emission of GHGs, where it will contribute towards new trade-off solutions. This paper adds environmental factors in the objective function which includes GHG emissions and from technologies. The rest of the paper is organized as follows: following the proposed MSW management model, then we present a mathematical programming formulation, followed by a summary of results and lastly a conclusion with areas of further research.
2. The Solid Waste Management System Model
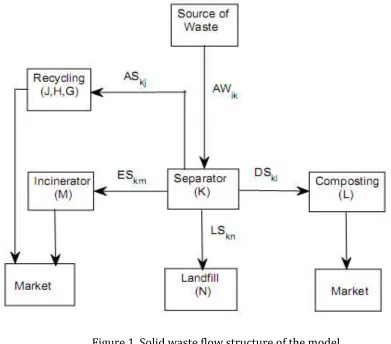
and G for remanufacturing and the products will be sold, humid material will be sent to L composting plants in which organic fertilizer will be sold and dry material will be sent to M incinerator plants in which energy recovery will be sold for electricity power generation, N potential landfill sites, which will receive rejected wastes from K separators. The solid waste flow structure is illustrated in Figure 1. In this work, we consider minimization of economic cost, minimization of final disposed quantities to the landfill and environmental impact (GHGs) as optimization objectives and find out the best solution with respect to the location of recycling plants, separating plants, composting plants, incinerating plants, landfill and waste flow allocation.
Figure 1. Solid waste flow structure of the model 3. Mathematical Programming Formulation
3.1Indices
Potential sources of solid waste index, Potential separation plant index, Potential plastic recycling plants index,
Potential incineration plants index, Potential landfills index,
3.2Decision Variables
The decision variables in the model are the amounts of solid waste transferred from one point to another. In this mathematical formulation, these are defined as follows:
ik
AW - Amount of daily solid waste to be transferred from source
i
to separation plantk
kj
AS - Amount of daily solid waste to be transferred from separation plant
k
to plasticrecycling plant
j
kh
BS - Amount of daily solid waste to be transferred from separation plant
k
to metal recycling planth
kg
CS - Amount of daily solid waste to be transferred from separation plant
k
to paper recycling plantg
kl
DS - Amount of daily solid waste to be transferred from separation plant
k
to composting plantl
km
ES - Amount of daily solid waste to be transferred from separation plant
k
to incinerator plantm
kn
LS - Amount of daily solid waste to be transferred from separation plant
k
to landfilln
j
R - Binary variable, it takes the value 1 if a plastic recycling plant is to be set up at
candidate location
j
j
1
,...,
J
and 0 otherwise.h
S - Binary variable, it takes 1 if a metal recycling plant is to be set up at candidate location
h
h
1
,...,
H
and 0 otherwiseg
U - Binary variable, it takes 1 if a paper recycling plant is to be set up at candidate
location
g
g
1
,...,
G
and 0 otherwisek
V - Binary variable, it takes 1 if a separation plant is to be set up at candidate location
k
k
1
,...,
K
and 0 otherwisel
W - Binary variable, it takes 1 if a composting plant is to be set up at candidate location
l
k
1
,...,
K
and 0 otherwisem
X - Binary variable, it takes 1 if a incinerator plant is to be set up at candidate location
m
m
1
,...,
M
and 0 otherwisen
Y - Binary variable, it takes 1 if a landfill is to be set up at candidate location
n
3.3Parameters
The parameters are the known values (data) that are required by the model as inputs data to calculate the decision variables. These parameters are:
k
FS - Fixed cost of the separation plant represented as per unit weight.
j
FR - Fixed cost of the plastic recycling plant represented as per unit weight.
h
FM - Fixed cost of the metal recycling plant represented as per unit weight.
g
FP - Fixed cost of the paper recycling plant represented as per unit weight.
l
FC - Fixed cost of the composting plant represented as per unit weight.
m
FE - Fixed cost of the incinerator plant represented as per unit weight.
n
FL - Fixed cost of the landfill represented as per unit weight.
k
CS - Daily capacity of the separation plant
j
CR - Daily capacity of the plastic recycling plant
h
CM - Daily capacity of the metal recycling plant
g
CP - Daily capacity of the paper recycling plant
l
CC - Daily capacity of the composting plant
m
CE - Daily capacity of the incinerator plant
n
CL - Daily capacity of the landfill
k
VS - Cost per unit weight processed at the separation plant
k
j
VR - Cost per unit weight processed at the plastic recycling plant
j
h
VM - Cost per unit weight processed at the metal recycling plant
h
g
VP - Cost per unit weight processed at the paper recycling plant
g
l
VC - Cost per unit weight processed at the composting plant
l
m
VE - Cost per unit weight processed at the incinerator plant
m
n
VL - Cost per unit weight processed at the landfill
n
ik
TW - Transportation cost per unit weight of waste from source
i
to separation plantk
kj
TS - Transportation cost per unit weight of waste from separator
k
to plastic recyclingplant
j
kh
TS - Transportation cost per unit weight of waste from separator
k
to metal recycling planth
kg
kl
TS - Transportation cost per unit weight of waste from separator
k
to composting planti
km
TS - Transportation cost per unit weight of waste from separator
k
to incineratorm
kn
TS - Transportation cost per unit weight of waste from separator
k
to landfilln
j
Q - Revenue generated per unit weight of product from plastic recycling plant
j
h
Q - Revenue generated per unit weight of product from metal recycling plant
h
g
Q - Revenue generated per unit weight of product from paper recycling plant
g
l
Q - Revenue generated per unit weight of product from composting plant
l
m
Q - Revenue generated per unit weight of product from incinerator plant
m
1
- Fractional of plastic material in the waste.
2
- Fractional of metal material in the waste.
3
- Fractional of paper material in the waste.
- Fractional of compostable material in the waste
- Fractional of dry material in the waste.
GHE j
G - Emission coefficients for greenhouse effect in ton of CO2 and CH4 per unit weight
of waste from plastic recycling plant
j
GHE h
G - Emission coefficients for greenhouse effect in ton of CO2 and CH4 per unit weight
of waste from metal recycling plant
h
GHEg
G - Emission coefficients for greenhouse effect in ton of CO2 and CH4 per unit weight of waste from paper recycling plant
g
GHE l
G - Emission coefficients for greenhouse effect in ton of CO2 and CH4 per unit weight
of waste from composting plant
l
GHEm
G - Emission coefficients for greenhouse effect in ton of CO2 and CH4 per unit weight of waste from incinerator plant
m
GHE n
G - Emission coefficients for greenhouse effect in ton of CO2 and CH4 per unit weight of waste from landfill
n
i
A - Amount of daily waste generated at source
i
3.4Objective Functions
disposal of waste. The costs for every operating facility and capital costs are contained; 2) Minimization of total environment impact (GHG emissions), which includes carbon and methane emissions due to recycling, composting, incineration and disposal to the landfill; and 3) Minimize the final disposal to the landfill that is the total amount of waste per day disposed to all landfills from separation facilities. The multi-objective optimization model is as follows:
R
TC
VC
FC
Z
Min
1
(1)where
I i l l K k k k J j G g g g H h h h jj
R
FM
S
FP
U
FS
V
FC
W
FR
FC
1 1
1 1 1
M m N n n n mmX FL Y
FE 1 1 (2)
J j G g K k kg g H h K k kh h K k kj j K k I i ikk
AW
VR
AS
VM
BS
VP
CS
VS
VC
1 1 1 1 1 1
1 1
K k N n kn M m n K k km m L l K k kll DS VE ES VL LS
VC 1 1 1 1 1 (3)
I i K k K k G g kg kg K k H h kh kh J j kj kj K k ikikAW TS AS TS BS TS CS
TW TC
1 1 1 1 1 1 1 1
K k N n kn kn K k M m km km K k L l klklDS TS ES TS LS
TS 1 1 1 1 1 1 (4)
K k K k M m km m L l kl l K k G g kg g K k H h kh h K k J j kji AS Q BS Q CS Q DS Q ES
Q R
1 1 1 1
1 1 1 1 1 1 (5)
N n K k kn GHE n L l K k M m K k km GHE m kl GHE l G g K k kj GHE g J h H k kh GHE h J j K k kj GHE jLS
G
ES
G
DS
G
CS
G
BS
G
AS
G
Z
Min
1 11 1 1 1
1 1 1 1 1 1 2 (6)
K k N n knLS
Z
Min
1 13 (7)
subject to the constraints:
I) , … (1, = i for , 1
K k i ik AAW (8)
J j K k I i K k ik kj AW AS1 1 1 1
1
K k H h I i K k ik kh AW BS1 1 1 1 2 (10)
K k G g I i K k ik kg AW CS1 1 1 1 3 (11)
K k L l I i K k ik kl AW DS1 1 1 1
(12)
K k M m I i K k ik km AW ES1 1 1 1
(13)
K k N n I i K k ik kn AW LS1 1 1 1
3 2
1 )
1
( (14)
K) , … (1, = k for , 1
I i k k ik CS VAW (15)
J) , … (1, = j for , 1
K k j j kj CR RAS (16)
H) , … (1, = h for , 1
K k h h kh CM SBS (17)
G) , … (1, = g for , 1
K k g g kg CPUCS (18)
L) , … (1, = l for , 1 l l K k
kl CCW
DS
(19) L) , … (1, = l for , 1 l l K kkl CCW
ES
(20) N) , … (1, = n for , 1 n n K kkn CLY
LS
(21) N) , … (1, = n M); (1,..., m L); (1,..., l K); (1,..., k J); (1,..., j I); (1,..., i for 0 , 0 , 0 , 0 , 0 , 0 , 0 kj kh kg kl km kn
ik AS BS CS DS ES LS
AW (22) J) , … (1, = j for 1, or 0
Rj (23)
H) , … (1, = h for 1, or 0
Sh (24)
G) , … (1, = g for 1, or 0
Ug (25)
K) , … (1, = k for 1, or 0
Vk (26)
L) , … (1, = l for 1, or 0
Wl (27)
M) , … (1, = m for 1, or 0
Xm (28)
N) , … (1, = n for 1, or 0
The sum of equations (1) through (5) is the cost objective function, which is the sum of daily fixed cost of constructing technology facilities, variable cost of running the selected waste facilities, transportation cost from waste sources (wards) to the separation plants, and transportation cost from the separation plants to various waste facilities. Equation (6) is the environmental impact objective function, which considers GHG emissions from all waste facilities. Equation (7) is the final disposal objective function, which minimizes the waste to the landfill. Equations (8) – (14) are mass balance constraints, which ensure that all solid waste from each ward are sorted at separation plants and properly assigned to all waste facilities. Inequalities (15) – (21) are capacity limitation constraints, which ensure that the total waste sent to various waste facilities does not exceed their capacity. Inequality (22) is a non-negativity inequality, which ensures that the values of decision variable are either zero or positive. Equations (23) – (29) are binary variables, which determine whether facilities have been selected or not.
4. Summary of Results
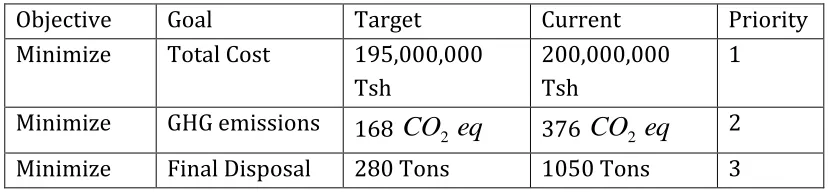
The multi-objective optimization model above has been converted to lexicographic preemptive goal programming (PGP) model for the model test. Goals for the PGP model are provided in Table 1 along with their target, current and the priority of each goal.
Table 1: Goals for the Preemptive Goal Programming
Objective Goal Target Current Priority
Minimize Total Cost 195,000,000
Tsh
200,000,000 Tsh
1
Minimize GHG emissions 168
CO
eq
2 376
CO
2eq
2Minimize Final Disposal 280 Tons 1050 Tons 3
The aim of goal programming is to launch a goal level of attainment for each criterion. Goal programming (GP) method needs the decision maker to set goals for each objective that he/she desires to obtain. A favored solution is then well-defined as the one which reduces the deviations from the set goals. The purpose of GP is to minimize the deviations between the attainment of goals [16]. In this model, the primary objective of the problem is to minimize the total cost for the SWM system. The second priority is to minimize total environmental impact, that is, GHG emissions and to minimize the final disposal from various separation plants, which is the third priority goal as suggested by the decision maker.
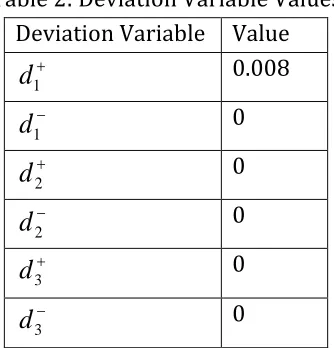
solved as single objective. Thereafter, the second priority goal was formulated and solved in which the first priority goal has been taken as a constraint. The third priority goal was formulated and solved in which the first and second priority goals have been taken as the constraints. Finally the last objective was formulated and solved, Tables 2, 3, 4, and 4 shows the solution obtained after the last formulated objective was solved which comprises of only deviation variables. The final value of the objective function and all deviation variables is zero as shown in Table 2, which indicates that both goals are perfectly satisfied. That is, all the waste in the separation plants are evacuated with minimum cost and all the waste in the recycling, composting, incineration as well as in the landfill are processed with minimum GHG emissions.
Table 2: Deviation Variable Values Deviation Variable Value
1
d
0.008 1
d
0 2
d
0 2
d
0
3
d
0
3
d
0Table 3: Objective Functions Value Priority Goal Objective
Function
Values
1
1
Z
192,550,594.1Tsh 2
2
Z
168CO
2eq
3
3
Z
273 Tons-
Z
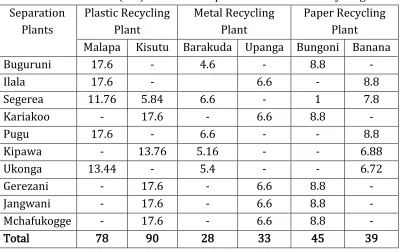
0.008Table 4: Waste Amount (ton) Flow from Separation to Various Recycling Plants Separation
Plants
Plastic Recycling Plant
Metal Recycling Plant
Paper Recycling Plant Malapa Kisutu Barakuda Upanga Bungoni Banana
Buguruni 17.6 - 4.6 - 8.8 -
Ilala 17.6 - 6.6 - 8.8
Segerea 11.76 5.84 6.6 - 1 7.8
Kariakoo - 17.6 - 6.6 8.8 -
Pugu 17.6 - 6.6 - - 8.8
Kipawa - 13.76 5.16 - - 6.88
Ukonga 13.44 - 5.4 - - 6.72
Gerezani - 17.6 - 6.6 8.8 -
Jangwani - 17.6 - 6.6 8.8 -
Mchafukogge - 17.6 - 6.6 8.8 -
Table 5: Waste Amount (ton) Flow from Separation to Composting, Incineration Plants and Landfill
Separation Plants
Composting Plant Incineration Plant Landfill
Kamata Mombasa Amana Kinyerezi Kigogo P/Kinyamwezi
Buguruni 42.9 - 5.5 - - 28.6
Ilala - 42.9 - 5.5 28.6 -
Segerea - 42.9 - 5.5 - 28.6
Kariakoo 42.9 - 5.5 - 28.6 -
Pugu - 42.9 - 5.5 - 28.6
Kipawa 0.5 33.4 2.5 1.8 - 22.36
Ukonga - 32.76 - 4.2 - 21.84
Gerezani 42.9 - 5.5 - 28.6 -
Jangwani 42.9 - 5.5 - 28.6 -
Mchafukogge 42.9 - 5.5 - 27.6 1
Total 215 195 30 23 142 130
5. Conclusions and Future Research Directions
In this paper, the new model proposed is formulated as a multi-objective optimization model (MOOM), which simultaneously solves the three objectives. The multi-objective programming algorithm was considered in developing the proposed model using the principle of mixed-integer programming. The model objectives functions focused on minimizing the costs, environmental impact and final disposal to the landfill.
The lexicographic goal programming technique is used to solve the formulated MOOM. This approach allows the analyst to assign different priorities given by decision maker to the goals considered, first of all looking for a solution that meets the most important of these priorities. The model has been tested in a real SWM system of some wards in Dar es Salaam city. This approach provides solutions that are consistent with the decision maker’s preferences.
The model is coded in GNU Linear Programming Kit (GLPK) software for Linux and has been run to optimality. The developed model provides a reduced amount of waste to the landfill and GHG emissions by 76% and 55.2% respectively. Moreover, the model proposed 10 separation plants and 2 recycling plants for plastics, metals and paper respectively. Two composting plants, 2 incineration plants as well as 2 landfills were also proposed by the model.
waste disposal in Dar es Salaam, implementations and compliance to regulations should be considered for a successful waste management relief in the future.
Acknowledgements
The authors would like to thank the Government of the Republic of Tanzania through the Commission for Science and Technology (COSTECH) for the full financial support of this study.
References
[1] Najm MA, El-Fadel M, Ayoub G, El-Taha M, Al-Awar F. An optimisation model for regional integrated solid waste management I. Model formulation. Waste Manag Res 20(2002) 37–45.
[2] Kadafa AA, Latifah AM, Abdullah HS, Sulaiman WA. A Comparative Assessment of the Municipal Solid Waste Management Services. Life Sci J 2013(2013), ID 10.
[3] Nzeadibe TC, Ajaero CK. Informal waste recycling and urban governance in Nigeria: Some experiences and policy implications. Handb Environ Policy 2010:245–264.
[4] Singh RP, Singh P, Araujo ASF, Hakimi Ibrahim M, Sulaiman O. Management of urban solid waste: Vermicomposting a sustainable option. Resour Conserv Recycl 55 (2011) 719–729.
[5] Guerrero LA, Maas G, Hogland W. Solid waste management challenges for cities in developing countries. Waste Manag 33 (2013) 220–232.
[6] Anderzen C, Blees V. Solid waste management in the city of Kathmandu, Nepal; Evaluation of the Vaxjo risk assessment model applied on Gokarna landfill site. Program of Environmental Engineering, Kalmar University. Thesis, 2003.
[7] Barma M, Wajiga GM, Okolo A, Hammandikko GM. Multi-objective Mathematical Programming Approach to Minimize Volume of Solid Waste at Waste Collection Centers in Municipalities. Int J Waste Manag Technol 1 (2014) 1–22.
[8] Pires A, Martinho G, Chang N-B. Solid waste management in European countries: A review of systems analysis techniques. J Environ Manage 92 (2011) 1033–1050.
[9] Chang N-B, Shoemaker CA, Schuler RE. Solid waste management system analysis with air pollution and leachate impact limitations. Waste Manag Res 14 (1996) 463–481.
[10] Morrissey AJ, Browne J. Waste management models and their application to sustainable waste management. Waste Manag 24 (2004) 297–308.
[11] Galante G, Aiello G, Enea M, Panascia E. A multi-objective approach to solid waste management. Waste Manag 30 (2010) 1720–1728.
[12] Minciardi R, Paolucci M, Robba M, Sacile R. Multi-objective optimization of solid waste flows: Environmentally sustainable strategies for municipalities. Waste Manag 28 (2008) 2202–2212. [13] Noche B, Rhoma F, Chinakupt T, Jawale M, others. Optimization model for solid waste management
system network design case study. Comput. Autom. Eng. (ICCAE), 2010 2nd Int. Conf., vol. 5, 2010, p. 230–236.
[14] Nema AK, Gupta SK. Optimization of regional hazardous waste management systems: an improved formulation. Waste Manag 19 (1999) 441–51.
[15] Sudhir V, Muraleedharan VR, Srinivasan G. Integrated solid waste management in urban India: A critical operational research framework. Socioecon Plann Sci 30 (1996) 163–181.
[16] Izadikhah M, Razieh R, Farhad HL. Using goal programming method to solve DEA problems with value judgments. Yugosl J Oper Res 24 (2014) 267–282
Http//www Ibm Com/developerworks/linux/library/l-Glpk 1 2006.
[18] Lyeme HA, Mujuni E, Mushi A. Optimization model for Solid Waste Management at Ilala Municipal, Tanzania. J INFORMATICS VIRTUAL Educ 2011:18–24.
1DEPARTMENT OF MATHEMATICAL AND COMPUTER SCIENCES AND ENGINEERING, SCHOOL OF COMPUTATIONAL AND
COMMUNICATION SCIENCE AND ENGINEERING,NELSON MANDELA AFRICAN INSTITUTION OF SCIENCE AND TECHNOLOGY,P.O. BOX 447,ARUSHA,TANZANIA
2DEPARTMENT OF MATHEMATICS,COLLEGE OF NATURAL AND APPLIED SCIENCE,UNIVERSITY OF DAR ES SALAAM,P.O.BOX
35062,TANZANIA
3DEPARTMENT OF MATHEMATICS,FACULTY OF SCIENCE,MUSLIM UNIVERSITY OF MOROGORO,P.O.BOX 1031,MOROGORO,