International Journal of Advances in Management and Economics
Available online at: www.managementjournal.info
RESEARCH ARTICLE
The Relationship between Productivity, Relative Prices and Real
Exchange Rates in Turkey
Kaya Ahmet I
Treasury Expert, under secretariat of Treasury, İnönü Bulvarı No: 36, 06510 Emek/Ankara, Turkey.
Abstract
In this study, the relationship between productivity, relative prices, and real exchange ratesis investigated for Turkey in the period of 2005:Q1–2016:Q4.We estimated three different models to measure the effect of prices of non-traded goods and relative labor productivity on real exchange rates, and the effect of relative labor productivity on the prices of non-traded goods. Empirical models are estimated by using ARDL approach. Results show that although there are strong positive links between relative labor productivity and prices of non-traded goods, the effects of relative labor productivity and prices of non-traded goods on real exchange rate are found significant and negative, converse to the Balassa-Samuelson hypothesis.
Keywords: Balassa-Samuelson effect, Real exchange rate, Productivity, Traded and non-traded goods, Relative prices
Introduction
It is a long-standing debate in the international economics literature that what drives the real exchange rates. In the short-run, it is widely acknowledged that the highly volatile nominal exchange rates partly
stem from the speculative capital
movements, drive most of the movements in the real exchange rates.
However, in the long-run, the behavior of the real exchange rates is being discussed extensively by researchers. In the theoretical side, the behavior of the real exchange rates is mainly explained by the Purchasing Power Parity (PPP) hypothesis.
The PPP hypothesis, according to its absolute
definition ,I mp lies that“… the real exchange
rates should equal 1 or at least have a tendency to return quickly to 1”[1] in a world that can be characterized by the perfect mobility of factors and notransaction costs. In the real world, however, due to the barriers of perfect mobility, transaction costs, and framework of exchange rate regime prevents
PPP hypothesis to be valid. Yet, the weak (or
relative) definition of PPP argues that the real exchange rate is mean-reverting meaning that the real exchange rate is a covariance stationary process [2].
This theoretical framework regarding the long-run behavior of the real exchange rates, PPP hypothesis, may not be valid in the real world. Along with the above-mentioned reasons (i.e. trade barriers, transaction costs, type of exchange rate regime, etc.), one possible explanation to this is offered as the relative productivity differences across countries in the context of Balassa-Samuelson hypothesis.
Balassa-Samuelson hypothesis provides a theoretical explanation for the long-run behavior of the real exchange rates in terms of relative productivity performance of traded and non-traded goods. The main argument of Balassa-Samuelson hypothesis is that as the productivity of traded goods rises compared to the non-traded goods, the real exchange rates tend to appreciate.
For this reason, Balassa-Samuelson effects are considered as one of the key sources of real exchange rate differences across countries [3].
To this end, the relationship between the real exchange rates and relative productivity differences is examined for Turkey in the period of 2005:Q1– 2016:Q4.The empirical approach in this study is two-staged. As a first step, we will examine the effect of traded and non-traded productivity differences of Turkey on the relative prices of non-traded goods as one of the main underlying outcomes of Balassa-Samuelson hypothesis. In the second step, we will look for the effect of relative prices of non-traded goods, as well as the terms of trade, on the real exchange rates of Turkey.
Further, we will also investigate the Balassa-Samuelson effects by differencing variables with respect to EU’s relative productivity indicators to see if the relative productivity differences compared to the EU can explain the movements of the real exchange rates of Turkey. The rest of the paper is organized as follows. Section 2 briefly summarizes the theoretical background of Balassa-Samuelson hypothesis and reviews the empirical literature. Section 3 describes the model and data. Section 4presents the empirical results and the last section conclude.
Theoretical
Background
and
Empirical Literature
The discussions regarding the impact of international productivity differences on price levels date back to the studies of Balassa [4] and Samuelson [5]. Earlier, Harrod [6] also proposed that the deviations from PPP might result from the productivity differences.
For this reason, the hypothesis is sometimes
called as Harrod-Balassa-Samuelson (HBS)
Effect. The Balassa-Samuelson effect is
explained as “the tendency for countries with
higher productivity in tradables compared with non-tradable to have higher price levels” [1].
To illustrate the Balassa-Samuelson effects in terms of real exchange rates we use following equations depending on the Obstfeld & Rogoff [1] and [7].
𝑅𝐸𝑅 = 𝑃𝑑
𝑃𝑓𝐸 (1)
The equation (1) shows the real exchange rates, where 𝑃𝑑 and 𝑃𝑓 indicate the consumer
prices indices of domestic and foreign country
respectively while 𝐸 shows the bilateral
nominal exchange rates between these countries. We can decompose the price indices of countries as traded and non-traded goods as depicted in 2nd equation:
𝑃𝑗= (𝑃𝑗𝑇)∝𝑗(𝑃𝑗𝑁)1−∝𝑗; 𝑗 = {𝑑𝑜𝑚𝑒𝑠𝑡𝑖𝑐, 𝑓𝑜𝑟𝑒𝑖𝑔𝑛} (2)
In equation (2), T and N represent the traded
and non-traded goods, while α corresponds the weights of traded goods. Substituting the equation (2) into the equation (1) and using basic algebra, one can easily find the real exchange rate equation in terms of the price indices of traded and non-traded goods.
𝑅𝐸𝑅 = (𝑃𝑑𝑇
𝑃𝑓𝑇𝐸) (𝑃𝑑𝑁
𝑃𝑑𝑇 ⁄ )(1−∝)𝑑
(𝑃𝑓
𝑁
𝑃𝑓𝑇 ⁄ )(1−∝)𝑓
(3)
As we can observe from the equation (3), the real exchange rate can indeed be affected by the relative price levels of traded and non-traded goods, as well as the weight of non-traded goods in the total goods basket of countries.
In order to connect the real exchange rates to relative productivity, one may rewrite the production function in terms of traded and non-traded goods. Following, the production function is decomposed as traded and non-traded goods under the constant-returns-to-scale assumption:
𝑌𝑗𝑇 = (𝐴
𝑗𝑇)(𝐿𝑗𝑇)𝜇(𝐾𝑗𝑇)1−𝜇 (4) 𝑌𝑗𝑁 = (𝐴
𝑗𝑁)(𝐿𝑗𝑁)𝜇(𝐾𝑗𝑁)1−𝜇
In above equations, A, L, and K denote total factor productivity, labor, and capital respectively. In the assumption of perfect competition, implying that the workers are paid as much as their marginal productivity and perfect mobility of labor across sectors, implying the equalization of wages, we reach following equation:
𝑃𝑗𝑇μ𝐴 𝑗𝑇(
𝐾𝑗𝑇
𝐿𝑇𝑗)
1−𝜇= 𝑃
𝑗𝑁μ𝐴𝑗𝑁( 𝐾𝑗𝑁
𝐿𝑗𝑁)
1−𝜇 (5)
𝑅𝐸𝑅 =
( [𝐴𝑑𝑇(𝐾𝑑
𝑇
𝐿𝑑𝑇) 1−𝜇]
[𝐴𝑑𝑁(𝐾𝑑𝑁
𝐿𝑑𝑁) 1−𝜇]
⁄
[𝐴𝑓𝑇(𝐾𝑓𝑇 𝐿𝑓𝑇)
1−𝜇]
[𝐴𝑓𝑁(𝐾𝑓
𝑁
𝐿𝑓𝑁)1−𝜇]
⁄
) 1−𝛼
(6)
In order to read equation (6) more easily, we can rewrite the term of 𝐴𝑗𝑖(𝐾𝑗𝑖
𝐿𝑖𝑗)1−𝜇 as the
productivity of ith sector in j country (𝑝𝑟𝑜𝑑
𝑗𝑖).
Finally, we can take the natural logarithm of this equation and rewrite in a linear form:
𝑙𝑛𝑅𝐸𝑅 = (1−∝)[𝑙𝑛(𝑝𝑟𝑜𝑑𝑑𝑇/𝑝𝑟𝑜𝑑𝑑𝑁) −
𝑙𝑛(𝑝𝑟𝑜𝑑𝑓𝑇/𝑝𝑟𝑜𝑑𝑓𝑁)] (7)
As it can be seen from the equation (7), when the relative productivity of traded and non-traded goods in the domestic country is greater than that of the foreign country, real exchange rates tend to appreciate. It is also be inferred from the above equation that if the share of traded goods in total goods basket is higher (that means if α in the equation is higher); the positive impact on real exchange rates will be lower [19].
The argument behind the Balassa-Samuelson effect is twofold. On one hand, relative productivity increases in tradable sectors will increase the prices of non-traded goods under the assumption of free labor mobility and wage-equalization across sectors. On the other hand, increases in prices of non-traded goods, resulting from the raising relative productivity, push the real exchange rates to appreciate.
Thus, some studies in the literature investigate the direct effect of relative productivity differences on real exchange rates, while some other examines the effect of relative productivity differences on the price level of non-traded goods by rewriting equation (7) to link productivity to prices of non-traded goods.
There are several limitations and
simplifications when determining the
tradable and non-tradable sectors in the empirical literature. First of all, sect oral price and productivity data is not available in most of the countries. Secondly, basic sect oral segmentation could not separate some
non-traded sectors from the traded sectors, vice versa. Thirdly, since the time dimension would be limited for several countries, increase in industrial production is used as a proxy for the productivity of traded sectors, however, productivity increases in services sector is assumed to be zero.
Uslu [5] provides detailed discussion about variable selection and limitations of related literature. One way or another, this theoretical framework, i.e. the effect of relative productivity of traded and non-traded goods on the real exchange rates (and/or relative price differences), has been investigated several times for different countries and different time periods.
Early studies, such as Balassa [4], Hsieh [8], Marston [9], Rogoff [10], Gregorio et al. [11] and Asea & Mendoza [12] focused on the developed countries and used real exchange rates or PPP-adjusted exchange rates as dependent, and labor productivity, gross domestic product (GDP) value added, or total factor productivity as independent variables in their analysis. Depending on the ordinary least squares (OLS) or seemingly unrelated regression (SUR) methods, these studies found mixed results; some of them confirm the validity of Balassa-Samuelson, some not. As time goes by and as data has been available for developing countries, studies investigating the Balassa-Samuelson effects in developing countries are becoming widespread.
We will briefly summarize some of the featured studies focusing on the developing countries and Turkey, specifically. Ègert [13] investigates the Balassa-Samuelson effects for five transition economies by using Johansen co integration test. Although the magnitude differs across countries, the study concludes that the long-run co integration relationship exists between productivity growth and relative prices while the link between relative price movements and real exchange rates is weaker.
Fischer [15] also focuses on the central and eastern countries and finds that productivity shocks work both with Balassa-type supply-side channels and also through investment demand channel. Some studies such as Faria & Leon-Ledesma [16] applies recently developed econometric methods in order to get rid of the spurious regression problem resulting from the non-stationary of some of the variables.
They utilize bound test technique developed by Pesaran, Shin, & Smith [17] to investigate the Balassa-Samuelson effects for Germany, Japan, United Kingdom and the USA in the period of 1960-1996 and do not find supportive evidence for Balassa-Samuelson effects in the long run. García-Solanes et al.
[18] analyze the Balassa-Samuelson
hypothesis for new and old member states of European Union. For the new member states, they find that the hypothesis may be valid if the model enlarged with variables that account for both quality improvements in the tradable sector and increases in the demand for domestic tradable goods.
However, in the old member states, the model fails because national markets of tradable goods remain segmented. Ito, Isard, & Symansky [19] investigated the impacts of Balassa-Samuelson hypothesis for Asian countries and conclude that the applicability of Balassa-Samuelson hypothesis depends on the development stage of the economy. Although the economy grows fast, the hypothesis may not be valid if the economy is in the phase of planned economy or just reach the primary goods exporter in the development process.
Choudhri & Khan[3] investigate whether the Balassa-Samuelson effects can explain the long-run behavior of real exchange rates in 16 developing countries as well as Turkey in the period of 1976 to 1994. They find that labor productivity differences exert a significant effect on the real exchange rate both directly and via its influence on the relative price of non-traded goods. Also, they found that terms of trade are a significant determinant of the real exchange rates are a significant determinant of the real exchange rates.
From studies related to Turkey, Ozcicek [20], Altunoz [21], and Lopcu, Burgac & Dulger [22] find supportive evidence in their studies
in favor of the Balassa-Samuelson hypothesis in Turkey by using different econometric techniques. Uslu [5], however, do not find a long-run relationship between productivity differences and real exchange rates according to ARDL bound test analysis although results show some evidence a link between productivity dynamics and pricing behavior in Turkey.
Model and Data
We followed Choudhri & Khan [4] and estimated three models to examine the
Balassa-Samuelson effects which are
depicted in following equations:
ln(𝑟𝑒𝑟)𝑡 = 𝛽1+ 𝛽2𝑙𝑛(𝑟𝑝)𝑡+𝛽3ln(𝑡𝑡)𝑡+ 𝜀𝑡(8)
ln(𝑟𝑝)𝑡 = ∝1+∝2𝑙𝑛(𝑟𝑙𝑝)𝑡+𝑢𝑡
(9)
ln(𝑟𝑒𝑟)𝑡 = 𝛾1+ 𝛾2𝑙𝑛(𝑟𝑙𝑝)𝑡+𝛾3ln(𝑡𝑡)𝑡+ 𝑣𝑡(10)
In above equations, 𝑟𝑒𝑟 is the real exchange rate,𝑡𝑡 is the terms of trade, 𝑟𝑝 and 𝑟𝑙𝑝 are relative prices of non-traded goods and relative labor productivity of traded and non-traded goods of Turkey respectively. In equation (8), we investigate the effect of relative prices of non-traded goods on real exchange rates by using prices of non-traded goods as a proxy to relative labor productivity as we have shown in the equation (3).
In equation (9), we look for the link between relative labor productivity and relative prices of non-traded goods. Finally, equation (10) shows the direct Balassa-Samuelson effects by linking relative labor productivity to the real exchange rates as well as the terms of trade variable. We first estimated above mentioned models by using data of Turkey to see if the productivity dynamics of Turkey itself can explain the movements of real exchange rates.
of traded and non-traded goods are derived by using sect oral gross domestic product (GDP) deflators while labor productivity of traded and non-traded goods is calculated with sect oral GDP and sect oral employment
data. We choose agriculture and
manufacturing sector as traded sector and all of the other sectors are selected as non-traded sector. All variables in the analysis are seasonally adjusted and converted into indices reflecting 2010=100. We used TRAMO/SEATS technique to seasonally adjust all of the variables.
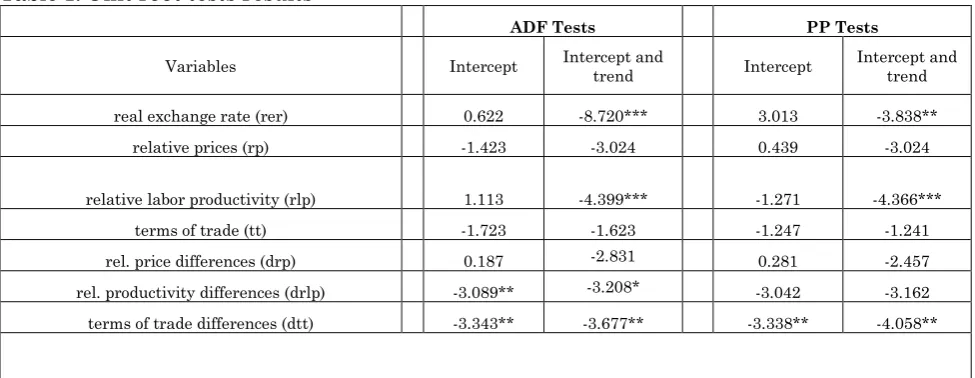
We also smoothed real exchange rates with Hodrick-Prescott filtering method. Sect oral current and constant GDP, sect oral employment and terms of trade data of Turkey are derived from the TURKSTAT while corresponding EU data is from Euro stat database. Real exchange rate data, on the other hand, is derived from the Central Bank of Republic of Turkey (CBRT). Firstly, we start our analysis by looking at the stationary of variables. As we know, ignoring the stationary of variables might yield spurious regression. Table 1 demonstrates the results of Augmented Dickey-Fuller [23] and Phillips-Perron [24] unit root tests.
As we can see from the table, only drlp and dtt variables in specifications with intercept reject the null hypothesis of unit root according to ADF test statistics. Looking at the intercept and trend specifications,
however, we can see that rer and rlp
variables also reject the unit root hypothesis according to both ADF and PP tests.
In general, we can conclude that rer, rlp, drlp
and dtt are stationary while other variables are not. We have differenced non-stationary variables and tested whether they are stationary at their first differences. Both
ADF and PP tests indicate that rp, tt and dr
p variables are stationary at their first
differences. ADF test statistics are found as -6.466, -4.901, and -4.008 for differenced data of rp, tt, and drp respectively in intercept and trend specifications.
PP test statistics, on the other hand, are found as -7.350, -4.945 and -6,131 respectively for the same variables in same specifications. Thus, we can conclude that some of our variables (rer, rlp, drlp and dtt) are integrated of order zero, while the other variables (rp, tt and drp) are integrated of order one.
Table 1: Unit root tests results
ADF Tests PP Tests
Variables Intercept Intercept and trend Intercept Intercept and trend
real exchange rate (rer) 0.622 -8.720*** 3.013 -3.838**
relative prices (rp) -1.423 -3.024 0.439 -3.024
relative labor productivity (rlp) 1.113 -4.399*** -1.271 -4.366***
terms of trade (tt) -1.723 -1.623 -1.247 -1.241
rel. price differences (drp) 0.187 -2.831 0.281 -2.457
rel. productivity differences (drlp) -3.089** -3.208* -3.042 -3.162
terms of trade differences (dtt) -3.343** -3.677** -3.338** -4.058**
Notes: Values in thetable represent the corresponding ADF or PP test statistics. The first panel shows data of Turkey, while the second panel indicates the differenced data between Turkey and EU. Lag lengths are selected by Akaike Information Criteria (AIC) in ADF statistics. Bandwidths are selected by Newey-West in PP statistics. Null hypothesis implies unit root in both ADF and PP tests. ***p<0.01, **p<0.05, *p<0.1
Because we have some I(1) variables, it is important to determine whether these variables move together in the long run, i.e. if there are any co integration relationship exist. There are several tests in time-series literature for investigating the co integration relationship between stationary variables. However, as we have variables which are integrated of a different order, we will use
bound test approach depending on the Autoregressive Distributed Lags (ARDL) model developed by Pesaran, Shin, &Smith [17].In order to perform bound test approach, first of all, one forms an Unrestricted Error Correction Model (UECM) as depicted below.
∆Y𝑡= 𝑐 + ∑𝑝𝑖=1∝1𝑖∆𝑌𝑡−𝑖+∑𝑞𝑖=1∝2𝑖∆𝑋𝑡−𝑖+ 𝛽1𝑌𝑡−1+ 𝛽2𝑋𝑡−1+ 𝜀𝑡
In equation (11), 𝑌 and 𝑋 are dependent and
independent variables, ∝ is short-term
coefficient, 𝛽 is long-term coefficient and p and q are lag orders. For a given p and q lags, model is called as ARDL (p,q). In order to perform co integration relationship, we test whether 𝛽1 and 𝛽2 coefficients are equal zero or not. Calculated Wald or F-statistics are compared with the upper and lower critical values which is given by Pesaran, Shin, & Smith [17].
If the calculated test statistic is above the corresponding upper bound critical value, we can reject the null hypothesis meaning that series are co integrated. However, if the calculated test statistic is below the corresponding lower bound critical value, we cannot reject the null hypothesis. If the calculated value is between the upper and lower bounds, on the other hand, we conclude the series are co integrated if only they are integrated of order one.
Estimation Results
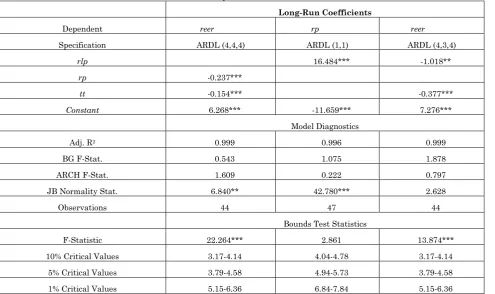
Long-run coefficients and model diagnostics of estimated ARDL models are presented in Table 2.Each column in this table represents the relevant models depicted in equation 8, 9 and 10 above. The results presented in Table 2 gives estimation results for only Turkey’s variables. As it can be seen from the Table 2, real exchange rate equations which are in the first and third column of the table are co integrated according to the boundtest statistics.
As we can see from the table F-statistics are found 22.264 and 13.874 respectively, which
are significantly greater than the
corresponding critical bounds meaning that the co integration relationship for these equations. However, F-statistics of the relative price equation cannot reject the null hypothesis of no co integration.
Table 2: ARDL estimation results for Turkey variables
Long-Run Coefficients
Dependent reer rp reer
Specification ARDL (4,4,4) ARDL (1,1) ARDL (4,3,4)
rlp 16.484*** -1.018**
rp -0.237***
tt -0.154*** -0.377***
Constant 6.268*** -11.659*** 7.276***
Model Diagnostics
Adj. R2 0.999 0.996 0.999
BG F-Stat. 0.543 1.075 1.878
ARCH F-Stat. 1.609 0.222 0.797
JB Normality Stat. 6.840** 42.780*** 2.628
Observations 44 47 44
Bounds Test Statistics
F-Statistic 22.264*** 2.861 13.874***
10% Critical Values 3.17-4.14 4.04-4.78 3.17-4.14
5% Critical Values 3.79-4.58 4.94-5.73 3.79-4.58
1% Critical Values 5.15-6.36 6.84-7.84 5.15-6.36
Notes: ARDL lag lengths are selected by Akaike Information Criteria (AIC). BG: Breusch-Godfrey Serial Correlation LM Test. ARCH: Heteroskedasticity ARCH Test. JB: Jarque-Bera Normality Test. Critical values are lower and upper bounds depending on ARDL model. The null hypothesis of bounds test is no co integration. ***p<0.01, **p<0.05, *p<0.1
As for the long-run coefficients of these equations, the first column of Table 2 indicates that the impact of relative prices and terms of trade on the real exchange rates are significantly negative. On the other hand, when the relative prices of non-traded goods increase, real exchange rates decrease at the 1 percent significance level. Similar results
are also presented in the third column. According to the results of the third column, the relative labor productivity affects real exchange rates negatively. These results also
found robust in terms of possible
relative labor productivity of traded and non-traded goods significantly and positively affect the relative prices of non-traded goods. Together, these results imply mixed results for the validity of Balassa-Samuelson hypothesis. On one hand, we have found a
strong link between relative labor
productivity and relative prices of non-traded goods in line with the BS hypothesis. On the other hand, the impact of relative prices of non-traded goods on real exchange rates is negative, contrary to the BS hypothesis.
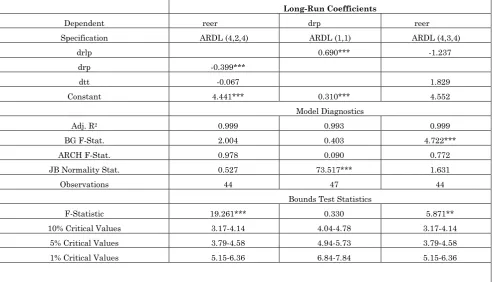
Table 3: ARDL Estimation results for Turkey relative to EU
Long-Run Coefficients
Dependent reer drp reer
Specification ARDL (4,2,4) ARDL (1,1) ARDL (4,3,4)
drlp 0.690*** -1.237
drp -0.399***
dtt -0.067 1.829
Constant 4.441*** 0.310*** 4.552
Model Diagnostics
Adj. R2 0.999 0.993 0.999
BG F-Stat. 2.004 0.403 4.722***
ARCH F-Stat. 0.978 0.090 0.772
JB Normality Stat. 0.527 73.517*** 1.631
Observations 44 47 44
Bounds Test Statistics
F-Statistic 19.261*** 0.330 5.871**
10% Critical Values 3.17-4.14 4.04-4.78 3.17-4.14
5% Critical Values 3.79-4.58 4.94-5.73 3.79-4.58
1% Critical Values 5.15-6.36 6.84-7.84 5.15-6.36
Notes: ARDL lag lengths are selected by Akaike Information Criteria (AIC). BG: Breusch-Godfrey Serial Correlation LM Test. ARCH: Heteroskedasticity ARCH Test. JB: Jarque-Bera Normality Test. Critical values are lower and upper bounds depending on ARDL model. The null hypothesis of bounds test is no co integration. ***p<0.01, **p<0.05, *p<0.1
Table 3 provides results from the Balassa-Samuelson effects in Turkey relative to the EU. Once again, we can see that co integration relationships exist for real exchange rate equations according to bound test results. According to estimation results for the real exchange rate equation, we can see that relative price differences have a significant but negative effect on real exchange rates.
On the other hand, the effect of relative labor productivity differences on real exchange rates which shows the direct Balassa-Samuelson effect is not found statistically significant. The terms of trade coefficients are also found insignificant in real exchange rate equations. According to the results from the second column of Table 3, we can see that labor productivity differences significantly and positively affects the relative price differences meaning that an increase in relative productivity differences associated with an increase in relative prices of non-traded goods.
Conclusion
Balassa-Samuelson hypothesis suggests that an increase in the productivity in tradable sectors accompany with an increase in the wages in both tradable and non-tradable sectors. Thus, prices in non-tradable sectors increase with an increase in the relative productivity in tradable sectors. This process yields an increase in the real exchange rates also.
For this reason, BS hypothesis is considered as one of the main explanations on the invalidation of the purchasing power parity theorem.In this study, we empirically investigated whether BS hypothesis is valid for Turkey with the help of ARDL model and bound test approach suggested by Pesaran, Shin, &Smith [17]. To this end, we estimated three different models to measure the effect of prices of non-traded goods and relative labor productivity on real exchange rates,
and the effect of relative labor productivity on the prices of non-traded goods. Results from Turkey and Turkey relative to EU specifications did not show enough evidence of the validity of BS hypothesis in Turkey.
There might be two reasons for this results.
Firstly, we selected agriculture and
manufacturing sectors as traded and all of
the other sectors as non-traded
sectors,although, in reality, this is not the
case.Oursegmentationmethod might not
distinguish between traded and non-traded sectors in Turkey. Secondly, TURKSTAT has made asignificant revision ofthe national accounts methodology in line with the latest international standardsrecently. Accordingly, the link between GDP and employment has weakened following the revision. For this reason, there may be some bias in our calculations on the sectoral productivity and price indices.
References
1 Obstfeld M, Rogoff K (1996) Foundations
of International Macroeconomics.
Cambridge: The MIT Press, p.101.
2 Huang CH, Yang CY (2015) European
exchange rate regimes and purchasing power parity: An empirical study on eleven euro zone countries. International Review of Economics and Finance, 35, 100-109.
3 Choudhri EU, Khan MS (2005) Real
Exchange Rates in Developing Countries: Are Balassa Samuelson Effects Present? IMF Staff Papers, 52(3):387-409.
4 Balassa B (1964) The purchasing-power
parity doctrine: a reappraisal. Journal of political Economy, 72(6):584-596.
5 Uslu E (2012) Reel Kurun Denge
Degerinden Sapmasında
Balassa-Samuelson Etkisi: Turkiye Ornegi.
Ankara: TCMB, p.102-107.
6 Harrod R (1933) International Economics.
London: James Nisbet and Cambridge University Press, p.1-100
7 Ozbilgin HM (2015) A Review on the
relationship between real exchange rate, productivity, and growth. Central Bank Review, 15, 61-77.
8 Hsieh DA (1982) The determination of the
real exchange rate: The productivity
approach. Journal of International
Economics, 12(3-4):355-362.
9 Marston RC (1990) Pricing to market in
Japanese manufacturing. Journal of International Economics, 29(3-4):217-236.
10Rogoff K (1992) Traded goods consumption
smoothing and the random walk behavior of the real exchange rate. National Bureau of Economic Research Working Papers, w4119.
11Gregorio J, Giovannini A, Krueger TH
(1994) The behavior of no tradable goods
prices in Europe: Evidence and
interpretation. Review of International Economics, 2(3):284-305.
12Asea PK, Mendoza EG (1994) The Balassa
-Samuelson model: A general equilibrium
appraisal. Review of International
Economics, 2(3):244-267.
13Egert B (2002) Estimating the impact of
the Balassa–Samuelson effect on inflation and the real exchange rate during the transition. Economic Systems, 26, 1-16.
14Egert B, Drine I, Lommatzsch K, Rault C
(2003) The Balassa–Samuelson effect in central and eastern Europe: Myth or reality? Journal of comparative Economics, 31(3):552-572.
15Fischer C (2004) Real currency
appreciation in accession countries:
Balassa-Samuelson and investment
16Faria JR, Leon-Ledesma M (2003) Testing
the Balassa–Samuelson effect:
Implications for growth and the PPP. Journal of Macroeconomics, 25(2):241-253.
17Pesaran MH, Shin Y, Smith RJ (2001)
Bounds testing approaches to the analysis of level relationships. Journal of applied econometrics, 16(3):289-326.
18Garcia-Solanes J, Sancho-Portero FI,
Torrejón-Flores F (2008) Beyond the Balassa–Samuelson effect in some new member states of the European Union. Economic Systems, 32(1):17-32.
19Ito T, Isard P, Symansky S (1999)
Economic growth and real exchange rate: an overview of the Balassa-Samuelson hypothesis in Asia. In NBER-EASE, In Changes in Exchange Rates in Rapidly Developing Countries: Theory, Practice, and Policy Issues. Chicago: University of Chicago Press, p.109-132.
20Ozcicek 20 PM (2006) İn Turkey ıntersectoral
productivity enflasyonv the real exchange rate
effects on the matter. Journal of Social Sciences, 6 (1):145-158.
21Altunoz of 21 (2014) Balassa-Samuelson
hypothesis: Turkey ekonomisiiç Limits
Test Approach. Çankırı Karatekin
University Faculty of Economics and
Administrative Sciences Journal, 4
(1):107-122.
22Lopcu K, Burgaç A, Dülger F (2012)
Balassa-Samuelson hypothesis: A test for the Turkish economy. Anadolu University Journal of Social Sciences, 12(4):1-21.
23Dickey DA, Fuller WA (1979) Distribution
of the estimators for autoregressive time series with a unit root. Journal of the American Statistical Association, 74 (366):427-431.
24Phillips PC, Perron P (1988) Testing for a
unit root in time series regression. Biometrika, 75(2):335-346.
25Samuelson PA (1964) Theoretical notes on