©Science and Education Publishing DOI:10.12691/nnr-4-4-2
XRD Peak Shift and Enhancement of Repeated
Mechanically Exfoliated SnO
2
Thin Films Synthesized
from SnCl
2
Powder by Direct Heating
Muqtaf Najich Abdillah, Wipsar Sunu Brams Dwandaru*
Physics Education Department, Faculty of Mathematics and Natural Sciences, Universitas Negeri Yogyakarta, Karangmalang Complex, Yogyakarta, Indonesia
*Corresponding author: [email protected]
Abstract
Mechanical exfoliation (ME) using a duct tape has been conducted upon SnO2 thin film. The film issynthesized from direct heating of SnCl2 powder. The SnCl2 powder is deposited upon a special arrangement of
glass slides and directly heated using an electric stove with a temperature of around 350°C. The material resulted from the heating process occurs on glass slides adjacent to the heated powder glass slides. The materials are then analyzed using scanning electron microscope (SEM) and energy dispersive X-ray (EDX) to confirm the presence of SnO2 material. The SEM results show stacking of spherical particles with sizes in the ranges of 700 nm to 1 µm. The
EDX result confirms the occurrence of 20% and 66% of Sn and O, respectively, as well as 13% of carbon and a very small percentage (0.99%) of chlorine remaining. The thin films are then mechanically exfoliated using a duct tape for as many as 5, 10, and 20 times. For each ME variation, the thin films are analyzed and compared using X-ray diffraction (XRD). The XRD results show semi-crystalline structure of SnO2 in cubic phase. The XRD results after
ME show peaks, which are characteristics to SnO2 and tend to shift the peaks to higher 2θ. Furthermore, the intensity
of the peaks is highest for 10 times ME showing crystalline improvement of the thin film after the ME treatment.
Keywords
: SnO2, direct heating, mechanical exfoliation, X-ray DiffractionCite This Article:
Muqtaf Najich Abdillah, and Wipsar Sunu Brams Dwandaru, “XRD Peak Shift and Enhancement of Repeated Mechanically Exfoliated SnO2 Thin Films Synthesized from SnCl2 Powder by DirectHeating.” Nanoscience and Nanotechnology Research, vol. 4, no. 4 (2017): 127-131. doi: 10.12691/nnr-4-4-2.
1. Introduction
Tin dioxide (SnO2) or stannic oxide is an inorganic
compound material that has been a subject of various studies especially concerning its applications as catalysts [1,2], ceramic glazes, polishing, coatings [3], antibacterial [4], lithium battery storage [5,6,7], solar cells [8,9,10], gas sensor [11,12,13], supercapacitors [14,15,16], and transparent thin films [17,18,19]. The various applications above use SnO2 materials in many forms with sizes ranging
from micro to nano scales [20], such as nanoparticles [21,22,23], nanowires and nanobelts [24,25,26], nanoribbons
[27,28], nanorods [29], quantum dots [30,31], and
nanocomposites [32]. Moreover, various methods have been used in order to synthesize SnO2, such as
hydrothermal [33,34,35], electrospinning with side-by-side spinneret [36], spray pyrolysis [37], chemical vapor deposition (CVD) [38,39,40], and dip coating [41]. These methods are put forward to produce good quality of SnO2
thin films for various uses and applications.
In this study, we use a simple method in synthesizing SnO2 materials by direct heating of SnCl2 powder in a
special arrangement of glass slides using an electric heater, which provides a temperature of around 350°C. This effort is of course acknowledged inferior to the previously
mentioned methods, but, for scientific curiosity this study may give additional information in the various methods in preparing and synthesizing thin film materials. Furthermore we have added a treatment, which has not been reported before, that is a repeated mechanical exfoliation (ME) using a duct tape after the materials are printed on the appropriate glass slides.
ME using a duct tape is initially conducted to produce monocrystalline graphitic films from graphite materials [42]. The advantage of this arguably simple method is that it produces graphene layers with extremely good physical and chemical properties. However, this method is usually limited to fundamental scientific interests and has not been used to fabricate large scale graphene for direct applications [43]. In this case, we investigate whether this method may be used for thin films such as SnO2 produced
by simple direct heating of SnCl2 powder. The aim of this
study is to understand the effect of repeated ME towards the synthesized SnO2 thin films based on X-ray diffraction
(XRD) patterns by varying the number of ME for as many as 5, 10, and 20 times.
2. Experimental Method
tissue, and iv) a duct tape (Goldtape brand). The equipment used in this study are i) an electrical stove, ii) a stopwatch, iii) glass slides, iv) two clamps, v) an asbestos screen, vi) a measuring cup, vii) a ruler, viii) a digital thermometer, ix) a glass cutter, x) an XRD apparatus (Rigaku Mniflex 600), and xi) an SEM-EDX apparatus (JSM 6510 series).
Figure 1. Top view pictures of the SnCl2 powder and glass slides arrangements. (a) The SnCl2 powder (white color) arranged in a circular form with a diameter of 1 cm, and (b) the glass slides arrangements with the sandwiched SnCl2 in the middle and two other glass slides on its the left and right sides
Figure 2.The SnCl2 powder is sandwiched between two glass slides
The procedure in obtaining SnO2 thin films from SnCl2
powder by direct heating may be explained as follows.
Clean the glass slides using distilled water. Wipe the glass slides using tissues to dry them. Weigh a mass of SnCl2
powder as much as 0.2 grams. Put the weighted SnCl2
powder on a clean glass slide in a form of a circular shape with diameter of 1 cm (Figure 1a). Place another clean glass slide on top of the prepared SnCl2 powder such that
the powder is sandwiched between two glass slides
(Figure 2). Lay the sandwiched SnCl2 powder on the
middle of the asbestos screen. Put two clean glass slides on the left and right sides of the sandwiched SnCl2 as
shown in Figure 1b. Turn on the electric stove with a power of 300 watts and wait around 10 minutes to get a constant temperature of around 350°C. Set the asbestos screen on top of the electric stove. Heat the SnCl2 powder
for about 10 minutes. SnO2 films will gradually appear on
the left and right glass slides of the sandwiched SnCl2
powder. Turn off the electrical stove and let the SnO2
films materials cool down.
Once the glass samples are cool enough, we may proceed with the repeated ME treatment and carry out XRD and SEM-EDX tests. This procedure is done as follows: i) cut some pieces of duct tape with a size matching the glass slide, ii) take a glass slide layered with SnO2 film, iii) cut a small piece of the slide that consists
of SnO2 film and perform XRD and SEM-EDX tests, iv)
stick a piece of duct tape upon the glass slide that consists of SnO2 layer, v) slowly and firmly press the duct tape one
way throughout the glass slide, vi) slowly detach the duct tape from the glass slide and discard it, vii) take a new duct tape and repeat steps iv) to vi) upon the same glass slide using as many as 5 pieces of duct tape, viii) slice a
small sample of the glass slide and perform XRD measurement, ix) repeat steps iv) to viii) for 10 and 20 repeated ME.
3. Results and Discussion
Oxide materials are generally synthesized using tools and methods that are fairly complex, but in this study we use a simple method, namely direct heating using an electric stove. The heating is carried out with a temperature of 350 °C in order to exceed the melting point of SnCl2 which is around 247 °C. Furthermore, the oxygen
(O2) in the air will be used to form the layers of SnO2. The
oxygen will react with the tin element contained in the SnCl2 compound. This reaction will form layers of SnO2
on the glass slides. The simple reaction takes the following form:
2 2 2 2
SnCl +O →SnO +Cl .
The SnO2 materials produced by direct heating of SnCl2
powder may be observed in Figure 3. Three pairs of SnO2
layers are obtained by different time duration of the direct heating. It may be observed that all layers of the SnO2
materials show different colors starting from white color at the outermost layer, and then changing to yellow, violet, blue, and green. The pattern is then repeated. These colored layers are produced due to the thin-film interference effect caused by different thickness of the SnO2 layers. As the white colored layer is the thinnest
layer, the farther the distance of the left and right substrates from the SnCl2 powder, the thinner the layer
produced. This might be due to less exposure of the heated SnCl2 on farther parts of the glass slides. The SnO2 layers
are also not uniformly distributed through the glass slides. The longer the time duration of the direct heating process, the more area of the glass slides are covered by SnO2
materials. For 5 minutes of direct heating, the layers on the right and left glass slides form a heart-like structure, whereas for 10 and 15 minutes of direct heating, the layers form leaf-like structures where the top regions are wider than the lower regions. Furthermore, for 5 minutes of direct heating, the right and left layers are quite symmetric; however, it is not the case for layers resulted from 10 and 15 minutes of direct heating.
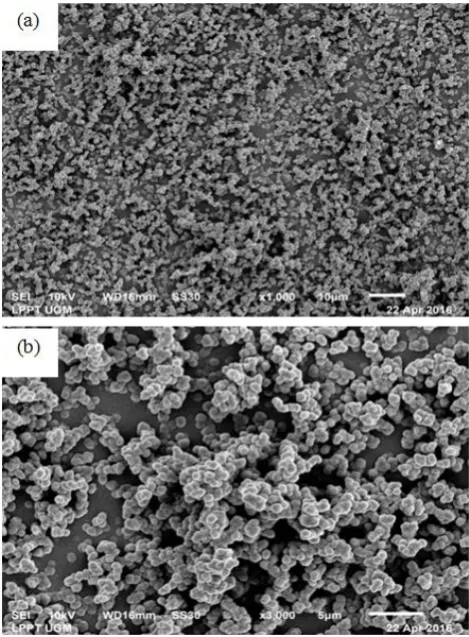
Figure 4.SEM images of the SnO2 layers with (a) 1000X and (b) 5000X magnifications
Next, the SEM results of the SnO2 material may be
observed in Figure 4. The SEM images show spherical grains distributed throughout the glass slides. The sizes of these grains range from 700 nm to 1 micron. The grains appear to be stacked on top of each other. Figure 4a and
Figure 4b show that some regions have more stacked
grains than others; hence the stacking is not homogenous throughout the sample. This different stacking may contribute to different thickness of the SnO2 layers, and
hence produces different colors in Figure 3.
Figure 5. The EDX results of the SnO2 sample obtained by direct heating of SnCl2
The EDX results may be viewed in Figure 5. From the EDX results of Figure 5, the substances that occur on the sample include 20% of tin, 66.2% of oxygen, 12.8% of carbon, and a remaining of 1% chlorine. It can be deduced that the SnO2 layer formed on the sample has a molarity
ratio of Sn : O of around 1.0: 3.3, which theoretically should be 1 : 2. This mismatch may be due to the carbon atom impurity that is high enough to eliminate places for Sn atoms in a thin layer. If the carbon atoms of 12.8% are replaced with Sn, then the Sn atoms will become 32.8%, and hence the ratio is closer to 1: 2. Moreover, the data also shows that the chlorine element contained in the sample is very small. This suggests that the compound of SnCl2 material has been separated; the most likely
elements are separated into the air in gaseous form. Finally, the XRD results of the samples being treated using repeated ME may be perceived in Figure 6. Figure 6(a) to Figure 6(d) is XRD results of SnO2 layers
with 0, 5, 10, and 20 times repeated ME, respectively. It may be observed from the XRD data that the SnO2
materials are semi-crystals as no sharp distinctive high peaks are found. Furthermore, the XRD patterns of SnO2 samples show a cubical crystal phase. The result
from XRD of SnO2 thin film without ME treatment shows
two peaks on (111) and (200). For 5 ME treatment the XRD result shows peaks at (200), (220), and (222). However, the peak at (111) disappears. For 10 ME treatment the peak at (111) occurs again with other peaks at (200), (220), and (222). Finally, for 20 ME the peaks at (111) and (200) disappear, but a deeper 2θ at a peak of (400) occurs. It can be observed that increasing ME treatment makes the peaks tend to shift to larger diffraction angles. ME treatment may cause the X-ray to penetrate deeper into the SnO2 layers. Moreover, the XRD
results show that the ME treatment makes the crystal phase becomes more visible. This is shown by the peak at (200) where the X-ray intensity increases from 5 to 10 times ME treatments. But, for 20 times ME the intensity drops again.
It can also be observed that the FWHM values of the XRD data at certain peaks change due to the ME treatment. The FWHM values tend to increase when the ME treatment is applied. FWHM values for 5, 10, and 20 times ME at the peak of (220) are shown in Table 1. The table shows that FWHM data increase from 5 to 10 times of ME, but then decrease when ME treatment is applied for 20 times. This might be associated to the surface stress of the SnO2 layer caused by the ME treatments. From 5 to
10 times of ME the surface stress increases as the FWHM also increases. But after 20 times of ME, the treatments do not have any more effect towards the surface stress of the SnO2 layer.
Table 1. FWHM values from XRD results for 5, 10, and 20 times ME at the peak of (220)
No. ME treatment FWHM
1 5 1.8(3)
2 10 4.73297
3 20 2.3(3)
4. Conclusions
The SnO2 thin film layers produced by direct heating of
SnCl2 powder show a range of different colors in certain
areas of the layers indicating different thickness of the layers. This is also supported by the SEM results that show non-homogeneity of spherical particles with sizes in the range of 700 nm to 1 micron. Furthermore, EDX results show the sample consisting of tin, oxygen, carbon, and chlorine atoms with a composition of 20%, 66%, 13%, and 1%, respectively. The XRD results show that ME treatments cause the XRD peaks to shift to higher diffraction angles. The XRD intensities especially at the peak of (200) indicate that after 10 times of ME treatment the crystallinity of the SnO2 thin layer increases, but then
decreases after 20 times of ME. Finally, the FWHM values at the peak of (220) indicate an increase of surface stresses after 10 times of ME but decreases after 20 times of ME.
Acknowledgements
The authors would like to thank the Faculty of Mathematics and Natural Sciences of Universitas Negeri Yogyakarta for the funding of this study under the grant of DANA DIPA FAKULTAS 2017.
References
[1] Gibson, G., Wang, Z., Hardacre, C., et al., “Insights into the mechanism of electrochemical ozone production via water splitting on the Ni and Sb doped SnO2 catalyst”, Phys. Chem.
Chem. Phys. 19, 3800, Jan 2017.
[2] Kumar, B., Atla, V., Brian, J.P., et al., “Reduced SnO2 porous nanowires with a high density of grain boundaries as catalysts for efficient electrochemical CO2-into-HCOOH conversion”, Angew.
Chem. Int. Ed., 56, 3645, March 2017.
[3] Shirahata, Y., Oku, T., Kanamori, Y., Murozono, M., “Effects of heat treatment on fluorine-doped tin oxide anti-reflection films coated on silicon spheres”, Journal of the Ceramic Society of Japan, 125(3), 145, March 2017.
[4] Yalcinkaya, F. and Lubasova, D., “Quantitative evaluation of antibacterial activities of nanoparticles (ZnO, TiO2, ZnO/TiO2, SnO2, CuO, ZrO2, and AgNO3) incorporated into polyvinyl butyral nanofibers”, Polym. Adv. Technol., 28, 137, Aug 2017.
[5] Zhao, K., Zhang, L., Xia, R., et al., “SnO2 quantum dots@graphene oxide as a high-rate and long-life anode material for lithium-ion batteries”, Small, 12, 588, Dec 2016.
[6] Zhou, X., Yu, L., Lou, X.W., “Formation of uniform N-doped carbon-coated SnO2 submicroboxes with enhanced lithium storage properties”, Adv. Energy Mater., 6, 1600451, May 2016.
[7] Hasan, A.S., Moyer, K., Ramachandran, B.R., Wick, C.D., “Comparison of storage mechanisms in RuO2, SnO2, and SnS2 for lithium-ion battery anode materials”, J. Phys. Chem. C, 120(4), 2036, Jan 2016.
[8] Barbe, J., Tietze, M.L., Neophytou, M., et al., “Amorphous tin oxide as a low-temperature-processed electron-transport layer for organic and hybrid perovskite solar cells”, ACS Appl. Mater. Interfaces, accepted paper, 2017.
[10] Lin, Y.-C. and Lee, M.–W., “Bi2S3 liquid-junction semiconductor-sensitized SnO2 solar cells”, J. Electrochem. Soc., 161, H1, Oct 2014.
[11] Wang, B., Zhu, L.F., Yang, Y.H., Xu, N.S., Yang, G.W., “Fabrication of a SnO2 nanowire gas sensor and sensor performance for hydrogen”, J. Phys. Chem. C, 112(17), 6643, Apr 2008.
[12] Leite, E.R., Weber, I.T., Longo, E., Varela, J.A., “A new method to control particle size and particle size distribution of SnO2 nanoparticles for gas sensor applications”, Adv. Mater., 12, 965, June 2000.
[13] Barsan, N. and Weimar U., “Understanding the fundamental principles of metal oxide based gas sensors; the example of CO sensing with SnO2 sensors in the presence of humidity”, J. Phys.:
Condens. Matter, 15, R813, May 2003.
[14] Li, F., Song, J., Yang, H., et al., “One-step synthesis of graphene/SnO2 nanocomposites and its application in electrochemical supercapacitors”, Nanotechnology, 20, 455602, Oct 2009.
[15] Wu, N.–L., “Nanocrystalline oxide supercapacitors”, Materials Chemistry and Physics, 75, 6, April 2002.
[16] Prasad, K.R. and Miura, N., “Electrochemical synthesis and characterization of nanostructured tin oxide for electrochemical redox supercapacitors”, Electrochemistry Communications, 6(8), 849, Aug 2004.
[17] Datolli, E.N., Wan, Q., Guo, W., Chen, Y., Pan, X., Lu, W., “Fully transparent thin-film transistor devices based on SnO2 nanowires”,
Nano Lett., 7(8), 2463, June 2007.
[18] Jang, J., Kitsomboonloha, R., Swisher, S.L., et al., “Transparent high-performance thin film transistors from solution-processed SnO2/ZrO2 gel-like precursors”, Adv. Mater., 25, 1042, Nov 2013. [19] Kim, W.J., Koo, W.H., Jo, S.J., et al., “Ultraviolet-enduring
performance of flexible pentacene TFTs with SnO2 encapsulation films” Electrochem. Solid-State Lett., 9(7), G251, May 2006.
[20] Fang, M., Zhang, L., Tan, X., et al., “Fabrication and photoluminescence property of SnO2 microtowers with interstitial tin ions”, J. Phys. Chem. C, 113(22), 9676, May 2009.
[21] Zhu, J., Lu, Z., Aruna, S.T., Aurbach, D., Gedanken, A., “Sonochemical synthesis of SnO2 nanoparticles and their preliminary study as Li insertion electrodes”, Chem. Mater., 12(9), 2557, Aug 2000.
[22] Chiu, H.C. and Yeh, C.–S., “Hydrothermal synthesis of SnO2 nanoparticles and their gas-sensing of alcohol”, J. Phys. Chem. C, 111(20), 7256, April 2007.
[23] Anandan, K. and Rajendran, V., “Size controlled synthesis of SnO2 nanoparticles: facile solvothermal process”, Journal of
Non-Oxide Glasses, 2(2), 83 May 2010.
[24] Luo, S., Fan, J., Liu, W., et al., “Synthesis and low-temperature photoluminescence properties of SnO2 nanowires and nanobelts”,
Nanotechnology, 17(6), 1695, Feb 2006.
[25] Liu, Z., Zhang, D., Han, S., et al., “Laser ablation synthesis and electron transport studies of tin oxide nanowires”, Adv. Mater., 15, 1754, Oct 2003.
[26] Qin, L., Xu, J., and Dong, X., et al., “The template-free synthesis of square-shaped SnO2 nanowires: the temperature effect and acetone gas sensors”, Nanotechnology, 19(18), 185705, April 2008.
[27] Hu, J.Q., Ma, X.L., Shang, N.G., et al., “Large-scale rapid oxidation synthesis of SnO2 nanoribbons”, J. Phys. Chem. B, 106(15), 3823, March 2002.
[28] Kong, X., Yu, D., and Li, Y., “Synthesis of SnO2 nanoribbons by direct oxidation of tin powders”, Chemistry Letters, 32(1), 100, 2003.
[29] Liu, Y., Zheng, C., Wang, W., “Synthesis and characterization of rutile SnO2 nanorods”, Adv. Mater., 13, 1883, Dec 2001.
[30] Xu, X., Zhuang, J., and Wang, X., “SnO2 quantum dots and quantum wires: controllable synthesis, self-assembled 2D architectures, and gas-sensing properties”, J. Am. Chem. Soc., 130(37), 12527, Aug 2008.
[31] Zhu, H., Yang, D., Yu, G., and Yao, K., “A simple hydrothermal route for synthesizing SnO2 quantum dots”, Nanotechnology, 17(9), 2386, Apr 2006.
[32] Wang, W.–W. and Yao, J.–L., “Hydrothermal synthesis of SnO2/Fe3O4 nanocomposites and their magnetic property”, J. Phys.
Chem. C, 113(8), 3070, Jan 2009.
[33] Yang, H.X., Qian, J.F., Chen, Z.X., et al., “Multilayered nanocrystalline SnO2 hollow microspheres synthesized by chemically induced self-assembly in the hydrothermal environment”, J. Phys. Chem C, 111(38), 14067, Sept 2007.
[34] Chen, D. and Gao, L., “Facile synthesis of single-crystal tin oxide nanorods with tunable dimensions via hydrothermal process”,
Chemical Physics Letters, 398(1 – 3), 201, Nov 2004.
[35] Niu, M., Huang, F., Ciu, L., et al., “Hydrothermal synthesis, structural characteristics, and enhanced photocatalysis of SnO2/α-Fe2O3 semiconductor nanoheterostructures”, ACS Nano, 4(2), 681, Jan 2010.
[36] Liu, Z., Sun, D.D., and Guo, P., and Leckie, J.O., “An efficient bicomponent TiO2/SnO2 nanofiber photocatalyst fabricated by electrospinning with a side-by-side dual spinneret method”, Nano Lett., 7(4), 1081, Sept 2007.
[37] Patil, G.E., Kajale, D.D., and Chavan, D.N., et al., “Synthesis, characterization and gas sensing performance of SnO2 thin films prepared by spray pyrolysis”, Bull. Mater. Sci., 34, 1, Feb 2011.
[38] Liu, Y., Koep, E., and Liu, M., “A highly sensitive and fast-responding SnO2 sensor fabricated by combustion chemical vapor deposition”, Chem. Mater., 17(15), 3997, June 2005.
[39] Davazoglou, D., “Optical properties of SnO2 thin films grown by atmospheric pressure chemical vapour deposition oxiding SnCl4”,
Thin Solid Films, 302(1-2), 204, June 1997.
[40] Yin, W, Wei, B., and Hu, C., “In situ growth of SnO2 nanowires on the surface of Au-coated Sn grains using water-assisted chemical vapor deposition”, Chemical Physics Letters, 471(1-3), 11, 2009.
[41] Olivi, P., Pereira, E.C., Longo, E., et al., “Preparation and characterization of a dip‐coated SnO2 film for transparent electrodes for transmissive electrochromic devices”, J. Electrochem. Soc., 140(5), L81, Feb 1993.
[42] Novoselov, K.S., Geim, A.K., Morosov, S.V., et al., “Electric field effect in atomically thin carbon films”, Science 306(5696), 666, Oct 2004.
[43] Singh, D.K., Iyer, P.K, and Giri, P.K., “Improved chemical synthesis of graphene using a safer solvothermal route”,