147
STUDY REGARDING THE BEHAVIOR OF WINTER WHEAT CROP
CULTIVATED IN THE TURCENI AND ROVINARI AREA FROM GORJ
COUNTY
MATEI GHEORGHE University of Craiova,Faculty of Agriculture, Crop fields department, Craiova, 19 Libertatii Street, 200583, Romania, E-mail: [email protected]
Key words: wheat, yields, industrial pollution
ABSTRACT
The study aims to determine the pollution effect to the growth and development stages of the cultivated winter wheat by farmers in studied area.
The agricultural lands from middle area of Jiu river – in the vicinity of two important Thermo Power Stations Turceni and Rovinari has a heterogeneity of the soils, especially of their natural fertility. This parameter is hard influenced by the entropic actions which conduct to registered different micro zones in the crops field.
Researches regarding the soil quality changes were made in major area of Romania: in Moldavia, Banat and Oltenia and those are concluded that as a results of mining operations and coal combustion the vegetation and soil quality has suffer important changes due the toxicity of the resulted products: ashes, heavy metals, radionuclide, etc (Oprea et al., 2008).
As general aspect, in the studied area is practiced a subsistence agriculture, characterized by small cultivated parcels with area of 0.5 – 0.7 ha which belong to the small farmers. The most cultivated species belongs to the cereal group: winter wheat, oat, rye, triticale, barley and maize. The registered yields at winter wheat crops varied in large way due the many factors, but the most important proved to be the natural fertility of soil.
INTRODUCTION
Wheat - is the most important cereal in the world, occupying the largest area under cultivation. In existence and human activity, for large geographical areas of the world, wheat is the primary and indispensable.
Factors determining the spread of wheat crop in the world are climate, soil and economic conditions. Each specific set of environmental conditions may correspond to a different genotype, given by the complexity of interactions within the system plant - soil - climatic conditions.
Although an area ideal for a variety may not correspond to each other because no matter how small it may be in size, there is variability in environmental conditions over time and space. An example of this is the fact that varieties with high production potential, encountered large areas in France, such as Texel, Thésée, Orqual, not suitable for ecological area of Oltenia and even Romania as a whole. Their lateness particularly stressful climatic conditions lead to a decrease in our production potential (Paunescu, 1999).
MATERIAL AND METHOD
For the analysis of the main stressors growing economic interest in the studied area to undertake field visits to identify those cultures assess and characterize them in terms of plant growing and harvesting of representative samples according to experimental technique, which is material which is assessed based on the average yield to be obtained from these crops.
148
Figure 1
a - Rovinari area; b – Turceni area
After identifying crop land was made a visual assessment of the homogeneity of these cultures to establish a number of representative points that allow sampling of plants. Due to variations in natural fertility of soils in the area, the degree of uniformity of cultures was relatively low, which required that for a more accurate assessment of the degree of growth and development of plants, observation points are placed on both diagonals of the cultures studied using the technique recommended for such situations (Ecaterina Feher, Gheorghe Matei, 2003).
Distance between points of observation was determined using the formula:
n
S
d
10000
in which:
S – area of parcel
n – number of observation points
In every observation point were done determinations as follow: number of spike/m2;
length of straw - the arithmetic average of 30 plants - cm;
the number of internodes of the stalk - the arithmetic mean of 30 plants; spike length - the arithmetic mean of 30 plants - cm;
average number of spike components - arithmetic mean from 20 spikes; average number of grains / spike - arithmetic mean from 20 spikes; mass of 1000 seeds - grams;
moisture grain - using electronic humidometer;
average production for each point - kg / ha, making it the correction related the moisture at standards.
Processing of data recorded by the observations and measurements made in the field and laboratory was made, using the statistical computer analysis program 7.0, Basic Statistics / one way ANOVA.
As standard it was used the Şimnic 30 variety cultivated in the same year at RDAS Şimnic Craiova.
RESULTS AND DISCUSSIONS
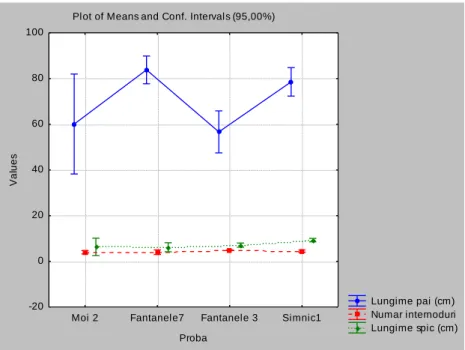
Straw length - the analyzed samples ranged from 56.7 cm at Fântânele 3 point to
149
high at Moi sample 2 compared with samples from the Fântânele 7 and Şimnic Craiova (Figure 2 and Table 1).
Plot of Means and Conf. Intervals (95,00%)
Lungime pai (cm) Numar internoduri Lungime spic (cm) Moi 2 Fantanele7 Fantanele 3 Simnic1
Proba -20
0 20 40 60 80 100
V
a
lu
e
s
Figure 2 - Variability characters straw length, number internodes and spike length in wheat samples analyzed (2010)
Related to this data we can see that straw length is strongly influenced by climatic conditions and has been developed especially by the natural soil fertility status.
Number of internodes - is a relatively a stable character, observing the samples from Moi 2 and Fântânele 7 placed on stockpiles a higher variability of its (Figure 2 and Table 1).
Table 1
Analysis of variance (winter wheat 2010) Marked effects are significant at p < ,05000 GENOTYPE
SS df MS SS df MS F p
Straw leght (cm) 1618 3 539,4 206,9 8 25,86 20,85820 0,000387
Number of internods 2 3 0,5 0,6 8 0,07 6,90637 0,013057
Spike leght (cm) 19 3 6,2 6,4 8 0,80 7,73027 0,009492
Spike length - is a polygenic character that influenced production, but is also influenced by culture conditions to achieve. It was found that the samples collected from the study area values are much lower than the data obtained from the same genotype grown under luvosoil from Şimnic Craiova conditions, all the differences being significant by the control (Figure 2 and Table 1).
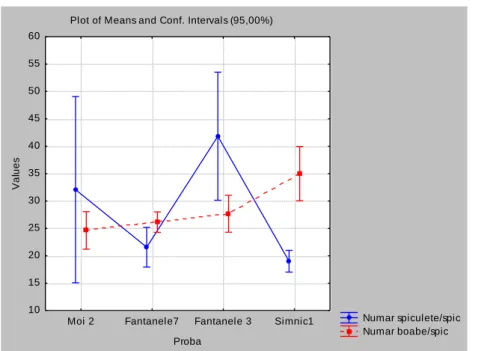
Number of components/spike - showed a very high variability in samples from Moi Fântânele 2 and 3, with the difference statistically very significant, 13 to 22 components/spike, to the values recorded in the control (Figure 3 and Table 2).
150
Plot of Means and Conf. Intervals (95,00%)
Numar spiculete/spic Numar boabe/spic Moi 2 Fantanele7 Fantanele 3 Simnic1
Proba 10
15 20 25 30 35 40 45 50 55 60
V
a
lu
e
s
Figure 3 - Variability of characters number of components/spike and number of grains/spike in wheat samples analyzed (2010)
Table 2
Analysis of variance (winter wheat 2010) Marked effects are significant at p < ,05000 GENOTYPE
SS df MS SS df MS F p
Number of components/spike 986 3 328,8 143,7 8 17,96 18,30543 0,000610
Number of seeds/spike 190 3 63,4 16,6 8 2,08 30,52534 0,000099
MMB 51 3 17,1 6,2 8 0,77 22,27663 0,000307
Number of grains/spike - is an important element of production whose values ranged from 24.6 grains/spike proven Moi 2 and 27.7 grains/spike proven Fântânele 3, lower values Witness - 35.0 grains/spike. Analyzing the number of grains/spike in correlation with the number of components/spike it observe that samples at Moi 2 and Fântânele 3 had a high number of sterile components in spike, influenced by the pedoclimatic stress factors less favorable for wheat crop in this zone (Figure 3 and Table 2).
Weight of 1000 seeds (MMB) - is one of the determinants elements of production.
On this index, we see that compared to the witness who made this year an average of 42.1 grams of points of observation samples have values below it, the differences being statistically ensured (Figure 4 and Table 2). The lowest value was recorded at sample Fântânele 3, of 36.8 grams, which also showed the smallest amplitude variation of this character, of 0.36, provided statistical difference compared to control.
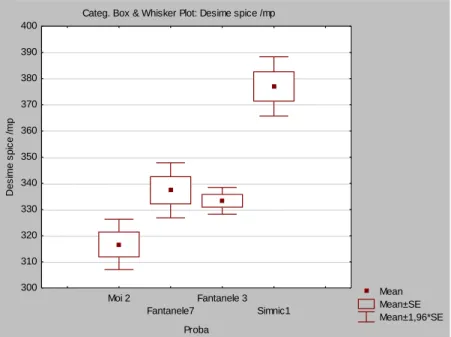
Number of spikes/m2 - is highly dependent on seeding density and culture
151
Categ. Box & Whisker Plot: MMB (g)
Mean Mean±SE Mean±1,96*SE Moi 2
Fantanele7
Fantanele 3 Simnic1
Proba 36
37 38 39 40 41 42 43 44
M
M
B
(
g
)
Figure 4 - MMB's variability in wheat samples analyzed (2010)
The highest value of this character is found in the blank at Şimnic Craiova, 377 spikes/m2 all other locations recorded lower values, statistically significant and highly significant (Figure 5 and Table 3). We note that the sample drawn from the point Moi 2 has the lowest value, due to the stress caused by the influence of proximity to CET which lead to a smaller number of fertile siblings.
Categ. Box & Whisker Plot: Desime spice /mp
Mean Mean±SE Mean±1,96*SE Moi 2
Fantanele7
Fantanele 3 Simnic1
Proba 300
310 320 330 340 350 360 370 380 390 400
De
s
im
e
s
p
ic
e
/
m
p
Figure 5 - Variability number of spikes/m2 at wheat samples analyzed (2010)
Production - kg / ha - is the result of interaction between environmental factors and productivity elements analyzed. Production values recorded ranged from 4029 kg/ha to witness grown in conditions of Şimnic Craiova and 2920 kg/ha at the point Moi 2 test where the limits of variability are very large (Figure 6 and Table 3).
152
Analyzing all the data recorded on single wheat crop in the middle basin of Jiu it can be concluded that wheat crop in this area found less favorable growth and fructification, which results in a limit profitability of that crop productions.
Table 3
Analysis of variance (winter wheat 2010) Marked effects are significant at p < ,05000 GENOTYPE
SS df MS SS df MS F p
Density of spike/s.m. 5881 3 1960,3 558,0 8 69,75 28,10474 0,000134
Production (kg/ha) 1859657 3 619885,7 329601,4 8 41200,18 15,04570 0,001186
Compared with the control, all the characters studied in wheat crop productivity were negatively influenced by stress felt by the culture in the area of low land suitability in use in private farms.
Categ. Box & Whisker Plot: Productia medie (kg/ha)
Mean Mean±SE Mean±1,96*SE Moi 2
Fantanele7 Fantanele 3
Simnic1
Proba 2400
2600 2800 3000 3200 3400 3600 3800 4000 4200 4400
P
ro
d
u
ct
ia
m
e
d
ie
(
k
g
/h
a
)
Figure 5 - Variability number of yieldsat wheat samples analyzed (2010)
CONCLUSIONS
From the presented data we can say that:
In the conditions of industrial activity of Energetic Complexes from Turceni and Rovinari area the variability of cultivate crops are very low, the main crops belongs to the cereals group;
Wheat crop - found in that area less favorable for the expression of the productive potential of cultivated varieties, the main limiting factor is soil less fertile and especially its unevenness caused by human activity.
In the expression of phenotypic characters productivity pursued in this species compared with the control in the cultivated Şimnic Craiova, we can say that most of these characters have values below those obtained in control, with a much higher variability in samples taken from middle basin of the Jiu River.
153
BIBLIOGRAPHY
CIULCĂ SORIN, 2002 – Tehnică experimentală, Editura Mirton, Timişoara;
FEHER ECATERINA, GH. MATEI – 2003, Caiet de lucrări practice de Fitotehnie,
Reprografia Universităţii din Craiova;
MATEI,GH. G. PĂUNESCU, C. PĂUNESCU, F.IMBREA, ELENA ROŞCULETE 2010
- Rotation and fertilization - factors in increasing wheat production and improving the agro productive features of the brown reddish soil from central area of Oltenia. Journal of agricultural science, USAMV Timişoara, Analele USAMVB Timişoara, Facultatea de Agricultură, Vol 42 (1), Editura AGROPRINT, Timişoara
PĂUNESCU, GABRIELA, V.GRIGORIU, LUCA EMILIA, OANĂ MARIA, 1994 –
Relaţia precocitate-producţie la soiurile şi liniile de grâu experimentate la SCA Şimnic în perioada 1987-1991, Lucr.ştiinţifice. IX: 43-49.
PĂUNESCU, GABRIELA, 2000 – Influenţa genelor Rht1 şi Rht2 asupra taliei şi
producţiei la grâul de toamnă, în condiţiile ecologice de la S.C.A. Şimnic. An. I.C.C.P.T. vol. LXVII : 19-25
QUISENBERRY, K.S.,1967 – Wheat and Wheat Improvement. Published by the
American Society of Agronomy madison Wisconsis., U.S.A. Ed.K.S.Qisenberry
SĂULESCU, N.N., 1984 – Ameliorarea grâului. Grâul. Ed. Academiei R.S.R.
Bucureşti, 259-323.