Oviedo University Press 36
Economics and Business Letters
7(1), 36-46, 2018
Age of the entrepreneurial decision:
Differences among developed, developing, and non-developed countries
Alicia Coduras1 • Jorge Velilla2* • Raquel Ortega2 1GEM Global Entrepreneurship Monitor, Spain
2University of Zaragoza, Spain
Received: 4 February 2018 Revised: 17 April 2018 Accepted: 17 April 2018
Abstract
Although entrepreneurship is widely considered an engine of growth, it is not clear whether policies, de facto, promote it, and knowing which individuals are willing to become entrepreneurs could help in the design of those policies. In this paper, we study how individuals become entrepreneurs at different ages, according to the degree of development of the country of residence. We make use of the GEM 2014 Adult Population Survey data, against a background where social norms are controlled, to find that the relationship between entrepreneurship and age follows an inverted U-shape, according to machine learning techniques, and that younger individuals are the most willing to become entrepreneurs.
Keywords: entrepreneurship; age; GEM data
JEL Classification Codes: L26, J10, C21
1. Introduction
Entrepreneurship is not only a labor status for those individuals who do not want or cannot find an employer, but also a complex, national phenomenon and a model of life (Orazem et al., 2015; Coduras et al., 2016; Viinikainen et al., 2017). Many entrepreneurs use their skills to innovate and drive technological change (Schumpeter, 1934; Holmes and Schmitz, 1990; Braunerhjerlm et al., 2010). In this way, entrepreneurship promotes growth and development (Acs, 1992). In fact, entrepreneurial activity is currently a priority for European politicians and policymakers (e.g., the ‘Entrepreneurship 2020 Action Plan’). However, as argued in Naudé (2016), the ef-fectiveness of policies is not clear. Then, it would certainly help to know what are the charac-teristics of those individuals who are the most willing to become entrepreneurs. The literature has pointed to age being one of the most important of these characteristics, with reference to `a golden age` of entrepreneurship (Parker, 2004). In addition, age is correlated with other deter-minants, such as social networks. Against this background, our paper empirically addresses the
* Corresponding author. E-mail: [email protected].
age at which individuals decide to become entrepreneurs in developed, developing, and
non-developed economies, using resampling techniques.
Prior studies have analyzed entrepreneurial activity in a variety of settings. In general, entre-preneurship is derived from the necessity for income, opportunity, the sense of vocation, and a desire to innovate (Minniti, 2005; Terjesen and Szerb, 2008; Dawson et al., 2015; Viinikainen et al., 2017; Molina and Velilla., 2016). Several authors have analyzed the positive effects of formative skills (Kotsova, 1997; Minniti, 2009; Levie and Autio, 2013), oral and intergenera-tional transmissions (Holcomb et al., 2009; Blumberg and Pfann, 2015; Viinikainen et al., 2017), or social capital and living standards (Roskruge et al., 2016). Authors have often found that entrepreneurship is related to youth (Schott and Bagger, 2004; Levesque and Minniti, 2006; Kelley, 2009), although there is no consensus on this (e.g., Blanchflower, 2000; Molina et al., 2016; Artz, 2016). However, that relationship has been usually dealt as a factor of control and, to the authors’ knowledge, there are no studies focusing on how age determines the entrepre-neurial activity of individuals using recent data from the Global Entrepreneurship Monitor.
The Global Entrepreneurship Monitor (GEM) is “the world’s foremost study of entrepreneur-ship”. Making use of the GEM Adult Population Survey (APS) data for the year 2014, we ex-amine the age of entrepreneurs dividing our sample into non-developed, developing and devel-oped countries. We use machine learning techniques based on bootstrapping prediction errors to determine the degree of that relationship, since if it is not adequately estimated, results and conclusions may be inaccurate (Breiman, 2001). Despite the importance of machine learning techniques in other fields of knowledge, such as Biology or Epidemiology, these tools have been under-used in Business and Economics and, in particular, in the study of entrepreneurship. Nonetheless, its application may lead to accurate models to explain complex social problems, as in the case of entrepreneurial activity. We then estimate a logit model to distinguish the role of age from that of gender, education, peer effects, managerial skills, the recognition of oppor-tunities, and risk aversion.
Our contribution to the literature is twofold. We first analyze the relationship between age and entrepreneurial activity in a micro-economic setting using resampling techniques, to deter-mine the degree of the relationship. Second, our results suggest a polynomial “U-inverted” shape, independently of the reason to become an entrepreneur. This finding is robust to different specifications, such as including age as a category. These results may be useful in an academic and research setting, but can also help policy-makers design more effective policies to promote entrepreneurship.
2. Methods
First, we determine at what degree is age related to entrepreneurial activity, since if this rela-tionship is not correctly addressed, results may be unaccurate. We estimate this relarela-tionship using machine learning techniques based on resampling methods and bootstrapped prediction errors (see Gimenez-Nadal et al. (2017) for a discussion about these methods, and a detailed application to entrepreneurship data).
We divide our sample into a training set and a test set, in order to avoid overfitting. We esti-mate the parameters of a logistic regression model of entrepreneurial activity in terms of a first order polynomial on ages over the training set, and then estimate the mean absolute error over the test set. We bootstrap the process to avoid selection biases, and define the averaged mean absolute error of prediction1. The process is then repeated iteratively, but including polynomials
1 The mean absolute prediction errors are defined as 1
2,000∑ ( 1 𝑁𝑗
∑𝑖∈𝑇𝑗|𝑌𝑖− 𝑝̂ |𝑖 ) 2,000
of increasing degree, and estimating the prediction error associated to each polynomial.
Ac-cording to this methodology, and given that the prediction power of models is a powerfull tool to measure its accuracy, independently of the hypotheses of the model (e.g., linearity, multicol-linearity, heteroskedasticity, or normality of residuals), the lower the prediction error, the greater the accuracy of the model (i.e., the “better” the relationship between the dependent variable and the set of explanatory variables). Furthermore, given that prediction errors are estimated over test sets, we avoid overfitting problems (other way, the prediction error would always decrease with the number of explanatory variables)2.
Once the degree of the relationship between entrepreneurship and ages is calculated, we es-timate the following logit model:
ln ( 𝑝𝑖
1 − 𝑝𝑖) = 𝛽0+ 𝛽1P(Ages𝑖) + 𝛽2
′𝑋
𝑖 + 𝜀𝑖, (1)
where 𝑝𝑖 is the probability of being an entrepreneur, P(Ages) represents the polynomial on ages that bests fits in the model, X is a set of additional explanatory variables, and 𝜀𝑖 represents unmeasured factors.
3. Data
We use the GEM APS data for the year 2014 to analyze the relationship between age and en-trepreneurial activity in developed, developing, and non-developed countries. The database is elaborated annually by GEM and contains harmonized cross-sectional micro-data about entre-preneurial-related characteristics (http://www.gemconsortium.org/about/wiki).
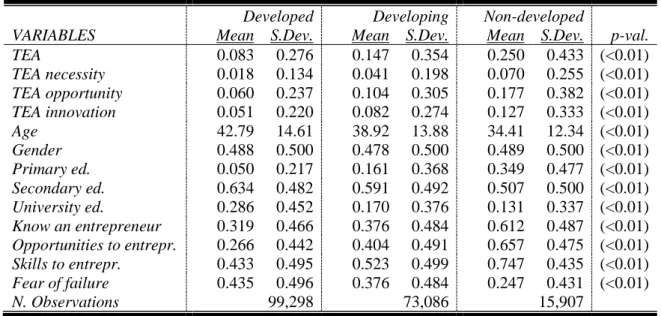
We restrict our sample to those individuals who reported age. This leaves us with 188,291 individuals, of which 22,973 are entrepreneurs. Table 1 shows summary statistics of variables, by degree of development of the country of residence3. The dummy variable TEA identifies
entrepreneurs, i.e., whether individuals are about to start, or have started an entrepreneurial activity in the past 42 months. 8.3% of individuals in developed countries are entrepreneurs, in contrast with 14.7% in developing countries, and 25.0% in non-developed. The average age of respondents (entrepreneurs) is 42.7 (39.4) years in the developed countries, 38.9 (36.6) in the developing, and 34.4 (33.8) in the non-developed, with these differences being signficant at standard levels.
The GEM data contains information about the different motivations for becoming an entre-preneur, a classification that has generated much interest in the literature (Reynolds et al., 2003). This classification often distinguishes between opportunity-driven entrepreneurs, and neces-sity-driven entrepreneurs (i.e., individuals who take adventage of an opportunity to start a busi-ness, and individuals who start a business because do not find an employer). That way, dummy variables TEA necessity and TEA opportunity identify those necessity-driven and opportunity-driven entrepreneurs, respectively. Furthermore, we also define the dummy TEA innovation, that characterizes those entrepreneurs who offer innovative products or use new technologies in their business. Table 1 shows how most of the entrepreneurs are opportunity-driven,
2 See Gimenez-Nadal et al. (2017) for a review of this techniques, against classical measures such as mean squared errors, R2, adjusted-R2, AIC, or BIC.
less of the region analyzed. However, the presence of necessity-driven entrepreneurs is
com-paratively higher in developing and non-developed countries. Finally, innovative entrepreneurs are relevant in all the regions, although have more relative presence in developed countries. We will analyze separately these types of entrepreneurs, to study potential differences between them.
The GEM APS data allows us to defined other variables that may affect the decision of indi-viduals to become entrepreneurs, such as gender, the level of education, the self-perception of entrepreneurial skills, the fear of failure, knowing other entrepreneurs, and considering that there are good opportunities to entrepreneur. The relevance of these explanatory variables, which are among the strongest determinants of entrepreneurship at the individual level, has been widely supported by the literature. Then, its inclussion is important in terms of observed heterogeneity, but also as moderating controls in the relationship between ages and entrepre-neurship.
Table 1. Summary statistics of variables.
Developed Developing Non-developed
VARIABLES Mean S.Dev. Mean S.Dev. Mean S.Dev. p-val.
TEA 0.083 0.276 0.147 0.354 0.250 0.433 (<0.01)
TEA necessity 0.018 0.134 0.041 0.198 0.070 0.255 (<0.01)
TEA opportunity 0.060 0.237 0.104 0.305 0.177 0.382 (<0.01)
TEA innovation 0.051 0.220 0.082 0.274 0.127 0.333 (<0.01)
Age 42.79 14.61 38.92 13.88 34.41 12.34 (<0.01)
Gender 0.488 0.500 0.478 0.500 0.489 0.500 (<0.01)
Primary ed. 0.050 0.217 0.161 0.368 0.349 0.477 (<0.01)
Secondary ed. 0.634 0.482 0.591 0.492 0.507 0.500 (<0.01)
University ed. 0.286 0.452 0.170 0.376 0.131 0.337 (<0.01)
Know an entrepreneur 0.319 0.466 0.376 0.484 0.612 0.487 (<0.01)
Opportunities to entrepr. 0.266 0.442 0.404 0.491 0.657 0.475 (<0.01)
Skills to entrepr. 0.433 0.495 0.523 0.499 0.747 0.435 (<0.01)
Fear of failure 0.435 0.496 0.376 0.484 0.247 0.431 (<0.01)
N. Observations 99,298 73,086 15,907
Note: The sample (GEM 2014 Global Individual) is restricted to individuals who reported age. “Age” is measured in years. TEA indexes are measured in percentage. Reference category for “Gender” is women. Kruskal-Wallis test P-values for the differences in parentheses.
4. Results
Results of the machine learning technique to study the degree of the relationship between ages and entrepreneurship are shown in Table 2. We find that a polynomial of the second order gives us the best results, in terms of accuracy-difficulty trade-offs4 . Adding a third degree would
barely improve the accuracy, but meaningfully increases the difficulty of the model.
Table 3 shows the results of estimating Eq. 1. Estimations are restricted to non-developed countries (Columns 1 and 2), developing countries (Columns 3 and 4), and developed countries (Columns 5 and 6). In Columns (1), (3) and (5) we only include the linear term for ages, while in Columns (2), (4) and (6), we estimate the complete model. In all cases, the relationship be-tween age squared and the probability of being an entrepreneur is negative. This suggests a “U-inverted” relationship between ages and the entrepreneurial activity of individuals, being stronger by a small margin in developing and developed countries5.
4 The variable age squared is defined as the square of age, and then divided by 100 to re-scale it.
Table 2. Mean absolute errors associated with age variables.
Age Age2 Age and Age2
Prediction error 0.211 0.203 0.201
Note: The sample (GEM 2014 Global Individual) is restricted to individuals who reported age. Age and Age2 are measured in years. Mean absolute errors are estimated using 2,000 iterations.
Table 3. Estimates of the coefficients, by degree of development.
(1) (2) (3) (4) (5) (6)
VARIABLES Non-
developed
Non- developed
Developing Developing Developed Developed
Age -0.003* 0.072*** -0.011*** 0.077*** -0.017*** 0.075***
(0.002) (0.010) (0.001) (0.006) (0.001) (0.006)
Age2 - -0.099*** - -0.110*** - -0.109***
(0.013) (0.007) (0.007)
Gender -0.072* -0.069* 0.163*** 0.171*** 0.167*** 0.174***
(0.038) (0.038) (0.022) (0.022) (0.025) (0.025)
Secondary ed. 0.155*** 0.154*** 0.097*** 0.100*** 0.011 0.005
(0.042) (0.042) (0.028) (0.028) (0.051) (0.051)
University ed. 0.135** 0.095 0.253*** 0.230*** 0.024 -0.011
(0.062) (0.062) (0.035) (0.035) (0.053) (0.053)
Know an entrepreneur 0.556*** 0.557*** 0.652*** 0.632*** 1.104*** 1.082***
(0.043) (0.043) (0.023) (0.023) (0.026) (0.026)
Opportunities to entrepr. 0.324*** 0.317*** 0.568*** 0.569*** 0.696*** 0.722***
(0.045) (0.045) (0.023) (0.023) (0.025) (0.025)
Skills to entrepr. 1.048*** 1.024*** 1.214*** 1.180*** 1.553*** 1.505***
(0.059) (0.059) (0.027) (0.027) (0.030) (0.030)
Fear of failure -0.291*** -0.290*** -0.161*** -0.177*** -0.540*** -0.563***
(0.047) (0.047) (0.024) (0.024) (0.027) (0.027)
Constant -2.435*** -3.687*** -2.832*** -4.371*** -3.356*** -5.045***
(0.090) (0.189) (0.051) (0.109) (0.070) (0.130)
Observations 15,907 15,907 73,086 73,086 99,298 99,298
Note: Standard errors in parentheses. The sample (GEM 2014 Global Individual) is restricted to individuals who reported age. Dependent variable is the dummy TEA. Age and Age2 are measured in years. Reference category for “Gender” is women. *Significant at the 90% level. **Significant at the 95% level. ***Significant at the 99% level.
Regarding education, in non-developed countries, individuals who reached only secondary education are the most likely to be entrepreneurs, while in developing countries this happens with individuals who reached University. In the developed economies, education appears not to affect entrepreneurship. There is a positive and significant effect of peer effects (variable “Know an entrepreneur”), entrepreneurial opportunities and managerial skills, while the fear of failure is negatively related to entrepreneurship.
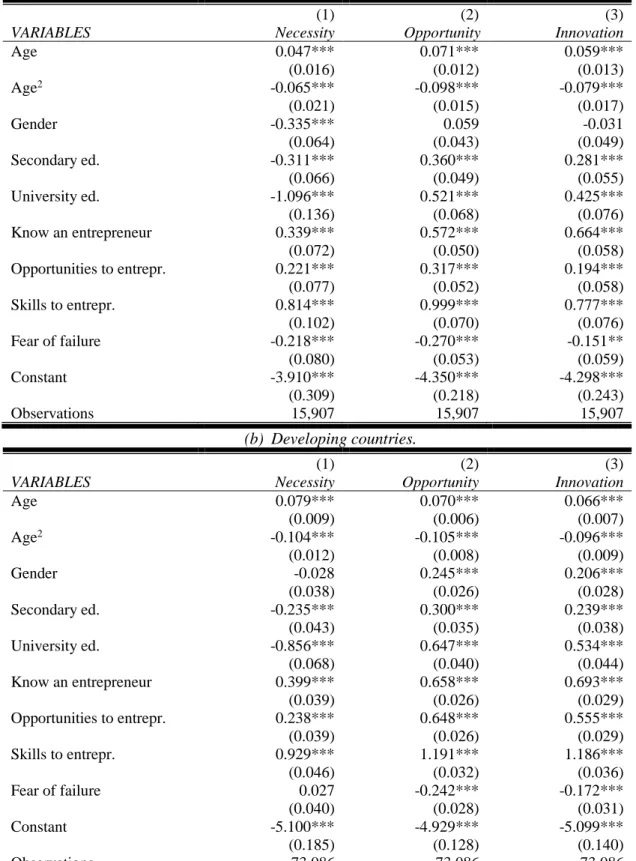
We repeat estimations distinguishing between necessity-driven, opportunity-driven, and in-novative entrepreneurs in Table 4. Columns (1), (2), and (3) contain results for the cases of necessity, opportunity, and innovation in non-developed countries, respectively. Columns (4), (5), and (6) are equivalent for the case of developing countries, and Columns (7), (8), and (9) refer to the developed countries. The estimated relationships between ages and entrepreneurial activity are qualitatively unchanged from the previous estimates in Table 3, and confirm the
“U-inverted” pattern estimated in Table 3. Parameters are in general robus, although the effects
of education varies across types of entrepreneurship and groups of countries, highlighting the role of human capital, especially in individuals who pretend to innovate, or take advantage of a business, against individuals who entrepreneur due to subsistence.
Table 4. Estimates of the coefficients, by kind of entrepreneurship.
(a) Non-developed countries.
(1) (2) (3)
VARIABLES Necessity Opportunity Innovation
Age 0.047*** 0.071*** 0.059***
(0.016) (0.012) (0.013)
Age2 -0.065*** -0.098*** -0.079***
(0.021) (0.015) (0.017)
Gender -0.335*** 0.059 -0.031
(0.064) (0.043) (0.049)
Secondary ed. -0.311*** 0.360*** 0.281***
(0.066) (0.049) (0.055)
University ed. -1.096*** 0.521*** 0.425***
(0.136) (0.068) (0.076)
Know an entrepreneur 0.339*** 0.572*** 0.664***
(0.072) (0.050) (0.058)
Opportunities to entrepr. 0.221*** 0.317*** 0.194***
(0.077) (0.052) (0.058)
Skills to entrepr. 0.814*** 0.999*** 0.777***
(0.102) (0.070) (0.076)
Fear of failure -0.218*** -0.270*** -0.151**
(0.080) (0.053) (0.059)
Constant -3.910*** -4.350*** -4.298***
(0.309) (0.218) (0.243)
Observations 15,907 15,907 15,907
(b) Developing countries.
(1) (2) (3)
VARIABLES Necessity Opportunity Innovation
Age 0.079*** 0.070*** 0.066***
(0.009) (0.006) (0.007)
Age2 -0.104*** -0.105*** -0.096***
(0.012) (0.008) (0.009)
Gender -0.028 0.245*** 0.206***
(0.038) (0.026) (0.028)
Secondary ed. -0.235*** 0.300*** 0.239***
(0.043) (0.035) (0.038)
University ed. -0.856*** 0.647*** 0.534***
(0.068) (0.040) (0.044)
Know an entrepreneur 0.399*** 0.658*** 0.693***
(0.039) (0.026) (0.029)
Opportunities to entrepr. 0.238*** 0.648*** 0.555***
(0.039) (0.026) (0.029)
Skills to entrepr. 0.929*** 1.191*** 1.186***
(0.046) (0.032) (0.036)
Fear of failure 0.027 -0.242*** -0.172***
(0.040) (0.028) (0.031)
Constant -5.100*** -4.929*** -5.099***
(0.185) (0.128) (0.140)
(c) Developed countries.
(1) (2) (3)
VARIABLES Necessity Opportunity Innovation
Age 0.098*** 0.069*** 0.051***
(0.012) (0.007) (0.007)
Age2 -0.128*** -0.104*** -0.080***
(0.014) (0.008) (0.008)
Gender -0.040 0.259*** 0.160***
(0.048) (0.029) (0.031)
Secondary ed. -0.183** 0.182*** 0.041
(0.087) (0.065) (0.065)
University ed. -0.600*** 0.322*** 0.062
(0.095) (0.066) (0.067)
Know an entrepreneur 0.808*** 1.107*** 1.023***
(0.050) (0.030) (0.032)
Opportunities to entrepr. 0.133*** 0.841*** 0.859***
(0.051) (0.029) (0.031)
Skills to entrepr. 1.285*** 1.528*** 1.516***
(0.058) (0.037) (0.039)
Fear of failure -0.219*** -0.647*** -0.553***
(0.051) (0.032) (0.034)
Constant -6.428*** -5.629*** -5.255***
(0.259) (0.154) (0.158)
Observations 99,298 99,298 99,298
Note: Standard errors in parentheses. The sample (GEM 2014 Global Individual) is restricted to individuals who reported age. Dependent variable is the dummy TEA. Age and Age2 are measured in years. Reference category for “Gender” is women. *Significant at the 90% level. **Significant at the 95% level. ***Significant at the 99% level.
These results are in favour of several studies that point towards young workers being the engine of new firm creation, and there is a range of explanations behind this fact. First, it may be a inherit effect of ages, given that younger individuals are more prone to assume risks and tend to show a lower aversion to risk than older workers. This explanation is related to the work of Bönte et al. (2009), who study the relationship between entrepreneurship, regional age struc-ture, and age-specific peer effects in Germany6. Second, age has important implications on
sev-eral aspects, such as health, wealth, individual and family finances, or specific managerial and/or technical skills, which are important determinants of entrepreneurial activity. The dy-namics of these attributes through the life-cycle of individuals may determine that start a busi-ness is preferred at youth. Further, social networks may be more prevalent at specific ages, facilitating access to resources and information, and providing psychological support (Stuart and Sorenson, 2005; Nanda and Sorenson, 2007). Finally, time allocations of individuals are sensitive to age and, then, in a microeconomic setting, individuals maximize their utility allo-cating time differently at youth and at adulthood (Wang and Gimenez-Nadal, 2018). Hence, as argued in Levesque and Minniti (2006), young workers allocate more time to firm creation tasks than do older workers. Further empirical work is needed in this line to provide empirical support to this result.
5. Concluding remarks
This paper analyses age differences in the entrepreneurial activity of individuals, using the GEM 2014 APS data and machine learning techniques, which have been underused in this field. We find that age and the probability of entrepreneur follow an “U-inverted” shape, in its nega-tive slope. This relationship is invariant to the motivation of entrepreneurs, i.e., holds for ne-cessity- and opportunity-drive entrepreneurs, and also for innovative entrepreneurs. Further-more, we find that gender, education, skills, fear of failure, and peer effects are also significantly related to entrepreneurial activity.
The limitations of our study are the complexity of the entrepreneurial phenomenon and, there-fore, the presence of unobserved heterogeneity. Because our data is cross-sectional, our results must deal with reverse causality problems, and then are based on conditional correlations. Fur-thermore, it may be that a single pattern cannot fit every region or even every individual, and further research using non-quantitative analysis is required (e.g., Coduras et al., 2016). In addi-tion, estimation results are based on logistic regression models, which measure linear relation-ships, and then it may be non-linear patterns that cannot be captured through these quantitative techniques. Finally, it is important to note that results rely on the definition of entrepreneurs of the GEM. Although this definition is standard in the literature using GEM data, different defi-nitions of entrepreneurs (e.g., self-employed workers, or business owners) may lead to different results.
Our results shed light on the analysis of entrepreneurial activity, from the point of view of individuals, using machine learning bootstrapping techniques based on prediction errors. Pol-icy-makers should also take our results into account in attempting to promote entrepreneurship and economic growth, since they indicate which individuals are the most likely to become en-trepreneurs in non-developed, developing, and developed countries. First, they may create pol-icies to encourage entrepreneurship specifically at younger ages, as individuals appear to be more likely to become entrepreneurs then. This could help to reduce youth unemployment (es-pecially in economies in the South of Europe, such as Greece, Spain, and Italy), provide expe-rience and specific managerial skills to younger workers, and promote technological change in developing and non-developed countries. Second, entrepreneurship among the third-age cannot be considered a marginal activity, and specific policies aimed at promoting start-ups in later life may be especially important in increasing the wealth and welfare of older workers. In particular, given the significant population ageing in developed economies, third-age entrepreneurship may help to support social security systems. This could help policy makers to devise and im-prove the efficiency of policies designed to encourage individuals to be or become entrepre-neurs.
Acknowledgements
This paper has benefited from funding from the Project 2015-0503 OTRI-University of Zara-goza. We are grateful from comments from José Alberto Molina.
References
Acs, Z. (1992) Small business economics: A global perspective, Challenge, 35(6), 38-44.
Artz, B (2016) Gender and entrepreneurial success: evidence from survey data, Applied
Economics Letters, 24(3), 163-166.
Blanchflower, D. G. (2000) Self-employment in OECD countries, Labour Economics, 7(5), 471-505.
Bönte, W., Falck, O., and Heblich, S. (2009) The impact of regional age structure on
entrepreneurship, Economic Geography, 85(3), 269-287.
Braunerhjelm, P., Acs, Z. J., Audretsch, D. B., and Carlsson, B. (2010) The missing link:
knowledge diffusion and entrepreneurship in endogenous growth, Small Business
Economics, 34(2), 105-125.
Breiman, L. (2001) Statistical modeling: The two cultures, Statistical Science, 16(3), 199-231.
Coduras, A., Clemente, J. A., and Ruiz, J. (2016) A novel application of fuzzy-set qualitative
comparative analysis to GEM data, Journal of Business Research, 69(4), 1265-1270.
Dawson, C., de Meza, D., Henley, A., and Arabsheibani, G. R. (2015) The power of (non) positive thinking: self-employed pessimists earn more than optimists, IZA DP9242.
Gimenez-Nadal, J. I., Lafuente, M., Molina, J. A., and Velilla, J. (2017) Resampling and bootstrap to assess the relevance of variables: Applications to cross-section entrepreneurship data, Empirical Economics, Forthcoming.
Holcomb, T. R., Ireland, R. D., Holmes, R. M., and Hitt, M. A. (2009) Architecture of entrepreneurial learning: exploring the link among heuristics, knowledge, and action,
Entrepreneurship Theory and Practice, 33(1), 167-192.
Holmes, T. J., and Schmitz Jr., J.A. (1990) A theory of entrepreneurship and its application to
the study of business transfers, Journal of political Economy, 98(2), 265-294.
Kelley, D. (2009) Growth aspirations as a function of entrepreneurial motivations and perceptions, Babson Faculty Research Working Paper 49.
Kotsova, T. (1997) Country institutional profiles concept and measurement, Academy of Management Proceedings, 97, 180-184.
Levesque, M., and Minniti, M. (2006) The effect of aging on entrepreneurial behavior, Journal of Business Venturing, 21(2), 177-194.
Levie, J., and Autio, E. (2013) Growth and growth intentions: A meta-analysis of existing evidence, Enterprise Research Centre, ERC White Paper1.
Minniti, M. (2005) Entrepreneurship and network externalities, Journal of Economic Behaviour & Organization, 57(1), 1-27.
Minniti, M. (2009) Gender issues in entrepreneurship, Foundations and Trends in Entrepreneurship, 5(7-8), 497-621.
Molina, J. A., Velilla, J., and Ortega, R. (2016) The decision to become an entrepreneur in Spain: The role of the household finances, International Journal of Entrepreneurship, 20(1), 57.
Molina, J. A., and Velilla, J. (2016) Innovation as a determinant of entrepreneurship, MPRA Paper71471.
Nanda, R., and Sorenson, J. (2007) Peer effects and entrepreneurship, Entrepreneurial Management WP08-051, Harvard Business School.
Naudé, W. (2016) Is European Entrepreneurship in Crisis?, IZA DP 9817.
Orazem, P. F., Jolly, R., and Yu, L. (2015) Once an entrepreneur, always an entrepreneur? The
impact of skills developed before, during and after college on firm start-ups, IZA Journal of
Labor Economics, 4:9.
Parker, S. C. (2004) The economics of self-employment and entrepreneurship, Cambridge, UK:
Cambruidge University Press.
Reynolds, P., Bygrave, W. D., Autio, E., Cox, L. W., and Hay, M. (2003) Global
Entrepreneurship Monitor 2002 exclusive report, Wellesley, MA: Babson College.
Roskruge, M. J., Poot, J., and King, L. (2016) Social capital, entrepreneurship and living
standards: differences between immigrants and the native born, IZA DP9874.
Schumpeter, A. (1934) The Theory of Economic Development, Cambridge, MA: Harvard
University Press.
Stuart, T. E., and Sorenson, O. (2005) Social networks and entrepreneurship. In Alvarez, S., Agarwal, R. and Sorenson, O. (Eds): The handbook of entrepreneurship: Disciplinary perspectives. Berlin: Springer, 211-28.
Terjesen, S., and Szerb, L. (2008) Dice thrown from the beginning? An empirical investigation of firm level growth expectations, Estudios de Economía, 35(2), 157-178.
Viinikainen, J., Heineck, G., Böckerman, P., Hintsanen, M., Raitakari, O., and Pehkonen, J. (2017) Born entrepreneurs? Adolescents’ personality characteristics and entrepreneurship in
adulthood, Journal of Business Venturing Insights, 8, 9-12.
Wang, H., and Gimenez-Nadal, J. I. (2018) Teens and twenties: cultural and preferences
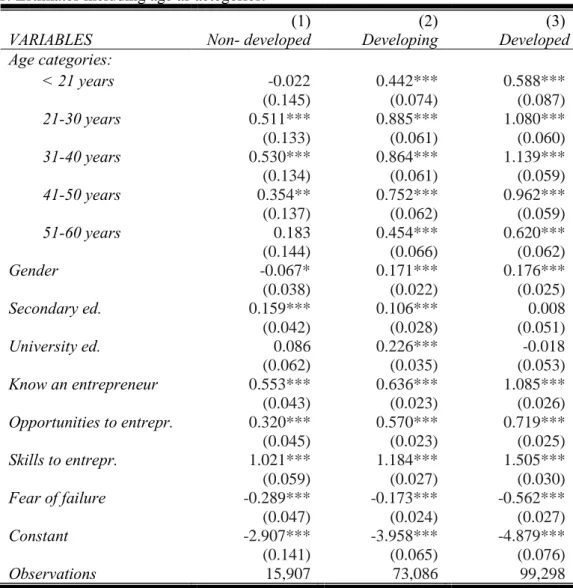
Appendix A
Table A1. Estimates including age as actegories.
(1) (2) (3)
VARIABLES Non- developed Developing Developed
Age categories:
< 21 years -0.022 0.442*** 0.588***
(0.145) (0.074) (0.087)
21-30 years 0.511*** 0.885*** 1.080***
(0.133) (0.061) (0.060)
31-40 years 0.530*** 0.864*** 1.139***
(0.134) (0.061) (0.059)
41-50 years 0.354** 0.752*** 0.962***
(0.137) (0.062) (0.059)
51-60 years 0.183 0.454*** 0.620***
(0.144) (0.066) (0.062)
Gender -0.067* 0.171*** 0.176***
(0.038) (0.022) (0.025)
Secondary ed. 0.159*** 0.106*** 0.008
(0.042) (0.028) (0.051)
University ed. 0.086 0.226*** -0.018
(0.062) (0.035) (0.053)
Know an entrepreneur 0.553*** 0.636*** 1.085***
(0.043) (0.023) (0.026)
Opportunities to entrepr. 0.320*** 0.570*** 0.719***
(0.045) (0.023) (0.025)
Skills to entrepr. 1.021*** 1.184*** 1.505***
(0.059) (0.027) (0.030)
Fear of failure -0.289*** -0.173*** -0.562***
(0.047) (0.024) (0.027)
Constant -2.907*** -3.958*** -4.879***
(0.141) (0.065) (0.076)
Observations 15,907 73,086 99,298

![[−2]proPSA versus ultrasensitive PSA fluctuations over time in the first year from radical prostatectomy, in an high-risk prostate cancer population: A first report](data:image/gif;base64,R0lGODlhAQABAIAAAP///wAAACH5BAEAAAAALAAAAAABAAEAAAICRAEAOw==)