Electrical and Computer Engineering Publications
Electrical and Computer Engineering Department
1-2013
Towards an Early Software Estimation Using
Log-Linear Regression and a Multilayer Perceptron
Model
Ali Bou Nassif
University of Western Ontario
, [email protected]
NFA-Estimation
Luiz Fernando Capretz
University of Western Ontario
, [email protected]
Follow this and additional works at:
https://ir.lib.uwo.ca/electricalpub
Part of the
Software Engineering Commons
Citation of this paper:
Nassif, Ali Bou; NFA-Estimation; and Capretz, Luiz Fernando, "Towards an Early Software Estimation Using Log-Linear Regression
and a Multilayer Perceptron Model" (2013).
Electrical and Computer Engineering Publications
. 4.
Other uses, including reproduction and distribution, or selling or
licensing copies, or posting to personal, institutional or third party
websites are prohibited.
In most cases authors are permitted to post their version of the
article (e.g. in Word or Tex form) to their personal website or
institutional repository. Authors requiring further information
regarding Elsevier’s archiving and manuscript policies are
encouraged to visit:
ContentslistsavailableatSciVerseScienceDirect
The
Journal
of
Systems
and
Software
jo u r n al h om ep a g e :w w w . e l s e v i e r . c o m / l o c a t e / j s s
Towards
an
early
software
estimation
using
log-linear
regression
and
a
multilayer
perceptron
model
Ali
Bou
Nassif
a,∗,
Danny
Ho
b,
Luiz
Fernando
Capretz
aaDepartmentofECE,WesternUniversity,London,Ontario,Canada bNFAEstimationInc.,RichmondHill,Ontario,Canada
a
r
t
i
c
l
e
i
n
f
o
Articlehistory:
Received26October2011
Receivedinrevisedform30June2012 Accepted14July2012
Available online 1 August 2012 Keywords:
Usecasepoints
Log-linearregressionmodel Softwareeffortestimation Multilayerperceptron
a
b
s
t
r
a
c
t
Softwareestimationisatediousanddauntingtaskinprojectmanagementandsoftwaredevelopment. Softwareestimatorsarenotoriousinpredictingsoftwareeffortandtheyhavebeenstrugglinginthepast decadestoprovidenewmodelstoenhancesoftwareestimation.Themostcriticalandcrucialpartof softwareestimationiswhenestimationisrequiredintheearlystagesofthesoftwarelifecyclewhere theproblemtobesolvedhasnotyetbeencompletelyrevealed.Thispaperpresentsanovellog-linear regressionmodelbasedontheusecasepointmodel(UCP)tocalculatethesoftwareeffortbasedonuse casediagrams.Afuzzylogicapproachisusedtocalibratetheproductivityfactorintheregressionmodel. Moreover,amultilayerperceptron(MLP)neuralnetworkmodelwasdevelopedtopredictsoftwareeffort basedonthesoftwaresizeandteamproductivity.Experimentsshowthattheproposedapproach out-performstheoriginalUCPmodel.Furthermore,acomparisonbetweentheMLPandlog-linearregression modelswasconductedbasedonthesizeoftheprojects.ResultsdemonstratethattheMLPmodelcan surpasstheregressionmodelwhensmallprojectsareused,butthelog-linearregressionmodelgives betterresultswhenestimatinglargerprojects.
© 2012 Elsevier Inc. All rights reserved.
1. Introduction
Softwareprojectfailureisoneofthemainchallengesinthe soft-wareindustry.Duringthelastfivedecades,itwasreportedthatthe percentageofprojectfailuresandincompleteprojectssurpassed 30%(Ecketal.,2009;Lynch,2009).AccordingtotheInternational SocietyofParametricAnalysis(ISPA)(Ecketal.,2009)andthe Stan-dishGroupInternational(Lynch,2009),themainreasonsbehind projectfailuresare:
•Lackofestimationofthestaff’sskillsandlevels. •Lackofunderstandingtherequirements. •Impropersoftwaresizeestimation.
•Uncertaintyofsystemandsoftwarerequirements. •Optimisminsoftwareestimation.
In a nutshell, many software projects fail because of the inaccuracyofsoftwareestimationandmisunderstandingor incom-pleteness of the requirements. This motivated researchers to investigatesoftwareestimationtoyieldbettersoftwaresizeand effortassessment.
∗Correspondingauthor.
E-mailaddresses:[email protected](A.B.Nassif),[email protected]
(D.Ho),[email protected](L.F.Capretz).
As softwareestimation became crucial topreventor reduce projectfailures,estimationintheearlystagesofthesoftwarelife cyclebecameimperative.Theearliertheestimationis,thebetter projectmanagementwillbe.Theimportanceoftheearly estima-tionrevealswhenitisrequiredtobidontheprojectorcommit toacontractbetweenthecustomerandthedeveloper.Theearly softwareestimation isconductedatapointwhenthedetailsof theproblemarenotyetdivulged.Thisiscalledthesizeestimation paradox(DemirorsandGencel,2004).Thesoftwaresizeshouldfirst beestimatedintheearlystagesofthesoftwarelifecycle,which is mainlytherequirementsstage. Severalcostestimation tech-niquesexistandtheycanbeclassifiedunderthreemaincategories (Mendesetal.,2002).Thesecategoriesare:
1.Expertjudgment:Inthiscategory,aprojectestimatortendstouse hisorherexpertisewhichisbasedonhistoricaldataandsimilar projectstoestimatesoftware.Thismethodisverysubjectiveand itlacksstandardizationsandthus,cannotbereusable.Another drawbackofthismethodisthelackofanalyticalargumentation becauseofthefrequentuseofphrasessuchas“Ibelievethat...” or“Ifeelthat...”(Jørgensen,2007).
2.Algorithmic models: Thisis still themostpopularcategory in literature(BriandandWieczorek,2002).Thesemodelsinclude COCOMO(Boehm,1981),SLIM(Putnam,1978)andSEER-SEM (GalorathandEvans,2006).Themaincostdriverofthese
mod-0164-1212/$–seefrontmatter© 2012 Elsevier Inc. All rights reserved.
elsisthesoftwaresize,usuallytheSourceLinesofCode(SLOC). Algorithmicmodelseitherusealinearregressionequation,like theoneusedbyKoketal.(1990)ornon-linearregression equa-tions,thosewhichareusedbyBoehm(1981).
3.Machine learning: Recently, machine learning techniques are being used in conjunction or as alternatives to algorithmic models.Thesetechniquesincludeneuralnetworks,fuzzylogic, neuro-fuzzy,GeneticAlgorithmandregressiontrees.Machine learning models can incorporate historical data and can be trainedtobetterpredictsoftwareeffort.
Noneoftheabovetechniquesareperfectandcanfitallsituations (Boehmetal.,2000a).Inthispaper,machinelearningtechniques (fuzzylogic andneuralnetworks)areusedwithanalgorithmic model(usecasepointmodel)forbettersoftwareestimationresults. As UML diagrams have become popular in the last decade, softwaredevelopershavebecomemoreinterestedinconducting softwareestimationbasedonUMLmodels,andespeciallytheuse casediagrams. The usecase diagram representsthe functional requirementsofasystemanditisusuallyincludedintheSoftware RequirementsSpecification(SRS)documents.
The main purposeofthis researchis topropose a modelto predictsoftwareeffortfromusecasediagrams.Ourmodelcanbe usedintheearlystagesofthesoftwarelifecycle.Thisisimportant forprojectmanagerswhowishtoconductearlycostestimation sothattheycan bidonprojects. Theaccuracy ofthe proposed approach can surpass the original UCP model. In this work, a linearregression model witha logarithmic transformation(aka log-linear)iscreatedtocalculatesoftwareeffortfromusecase dia-grams.Inthismodel,softwareeffortisafunctionofsoftwaresize andteamproductivity.Theproposedmodeltakesinto considera-tionthenon-linearrelationshipbetweensoftwaresizeandeffort. Thenon-linearrelationshipisdescribedindetailinSection2.As showninEq.(17),softwareeffortisdirectlyproportionalto soft-waresizeandinverselyproportionaltoteamproductivity(Galorath andEvans,2006).Amultiplelinearregressionequationwas gen-eratedtopredictthevaluesoftheproductivityfactor.Moreover, aMamdanifuzzylogicapproach(Mamdani,1977)hasbeenused toadjusttheproductivityfactor.Furthermore,aMLPmodelwas developedusingthek-foldcrossvalidationtechnique.A compar-isonwasperformedbetweentheproposedlog-linearregression modelagainsttheproposedMLPmodelaswellasothermodelsthat conductsoftwareeffortestimationfromusecasediagrams. Exper-imentsindicatethat,amongtheexistingdatapoints,whensmall projects(<3000person-hours)areusedintheevaluationprocess, theMLPmodelexceedsothermodels.Onthecontrary,the regres-sionmodelgivesbetterresultswhenprojectsofeffortgreaterthan 3000person-hoursarebeingused.
Theremainderofthepaperisorganizedasfollows: Sections
1.1,1.2,1.3and1.4presentanoverviewoftheusecasepoint(UCP) model,evaluationcriteriausedinthispaper,fuzzylogicandneural networks,respectively.Section1.5listssomerelatedwork.Sections
2and3proposethenovelregressionandMLPmodels.Section4
demonstratesanevaluationoftheproposedmodelsandprovides somecomparisonamongthemodels.Section5listssomethreatsto validity.Finally,Section6concludesthepaperandproposesfuture work.
1.1. Usecasepoints
TheusecasepointmodelwasfirstdescribedbyKarner(1993). Thismodelisusedforsoftwarecostestimationbasedontheuse casediagrams.Softwaresizeiscalculatedaccordingtothenumber ofactorsandusecasesinausecasediagrammultipliedbytheir complexityweights.Thecomplexityweightsofusecasesandactors arepresentedinTables1and2,respectively.
Table1
Complexityweightsofusecases(Karner,1993).
Usecase complexity
Numberoftransactions Weight
Simple Lessthan4(shouldberealizedbylessthan 5classes)
5 Average Between4and7(shouldberealized
between5and10classes)
10 Complex Morethan7(shouldberealizedbymore
than10classes)
15
Table2
Complexityweightsofactors(Karner,1993).
Actorcomplexity Description Weight
Simple ThroughanAPI 1
Average Throughatext-baseduserinterface 2
Complex Throughagraphicaluserinterface 3
AsshowninTable1,thecomplexityofausecaseisdetermined bythenumberofitstransactionsasshownintheusecase descrip-tionofeachusecase.Thesoftwaresizeiscalculatedthroughtwo stages.TheseincludetheUnadjustedUseCasePoints(UUCP)and theAdjustedUseCasePoints(UCP).UUCPisachievedthroughthe summationoftheUnadjustedUseCaseWeight(UUCW)and Unad-justedActorWeight(UAW).UUCWisrepresentedinEq.(1).
UUCW=
3
i=1
ni×Wi. (1)
whereniisthenumberofitemsofvarietyioftheusecasesandWi
isthecomplexityweightofthecorrespondingusecase.Similarly, UAWisrepresentedasfollows:
UAW=
3
j=1
mj×Cj. (2)
wheremjisthenumberofitemsofvarietyjoftheactorsandCjis
thecomplexityweightofthecorrespondingactor.Consequently, UUCPcanbedefinedasfollows:
UUCP=UUCW+UAW. (3)
AftercalculatingtheUUCP,theAdjustedUseCasePoints(UCP) iscalculated.UCPisachievedbymultiplyingUUCPbythetechnical factors(TFs)andtheenvironmentalfactors(EFs).TFcontributesto thecomplexityoftheprojectwhileEFcontributestotheteam effi-ciencyandproductivity.Thetechnicalandenvironmentalfactors
Table3
Technicalfactors(Karner,1993).
Ti Complexityfactors Wi
T1 Easyinstallation 0.5
T2 Portability 2
T3 Enduserefficiency 1
T4 Reusability 1
T5 Complexinternalprocessing 1
T6 Specialsecurityfeatures 1
T7 Usability 0.5
T8 Applicationperformanceobjectives 1
T9 Specialusertrainingfacilities 1
T10 Concurrency 1
T11 Distributedsystems 2
T12 Providedirectaccessforthirdparties 1
Table4
Environmentalfactors(Karner,1993).
Ei Efficiencyandproductivityfactors Wi
E1 Familiarwithobjectory 1.5
E2 Objectorientedexperience 1
E3 Analystcapability 0.5
E4 Stablerequirements 2
E5 Applicationexperience 0.5
E6 Motivation 1
E7 Part-timeworkers −1
E8 Difficultprogramminglanguage −1
aredepictedinTables3and4,respectively.Thetechnicalfactoris detailedasfollows: TF=0.6+0.01 13
i=1 Ti i ×Wi. (4)whereTiisafactorthattakesvaluesbetween0and5.Thevalue“0”
indicatesthatthefactorisunrelatedwhilethevalue“5”indicates thatthefactorisindispensable.Thevalue“3”specifiesthat the technicalfactorisnotveryimportant,norirrelevant(average).Wi
representstheweightoftechnicalfactors(Table3).
On the other hand, the environmental factor (EF) can be describedasfollows: EF=1.4−0.03 8
i=1 Ei×Wi. (5)whereEiistheenvironmentalfactor(whichissimilartoTiinEq.
(4),takingvaluesbetween0and5.Finally,theAdjustedUseCase Points(UCP)canbedefinedasfollows:
UCP=UUCP×TF×EF. (6)
ByincorporatingTFandEF,thevalueofUCPwillbemoreorless thanthevalueofUUCPby30%.Foreffortestimation,theUCPmodel proposed20person-hourstodevelopeachUCP.Thisisexpressed inEq.(7):
Effort=Size×20. (7)
whereEffortismeasuredinperson-hoursandSizeismeasuredin UCP.
SchneiderandWinters(2001)mentionedthatwhencalculating softwareeffort,insteadofmultiplyingthesizeby20, environmen-talfactorsshouldbeevaluatedbecausethesefactorscontribute totheefficiencyoftheteamdeveloping theproject. Ifthe effi-ciencyisfair,then20person-hoursperUCPshouldbeused.Ifthe efficiencyislow,then28person-hoursperUCPshouldbeused.If theefficiencyisverylow,thentheprojectteamshouldbe recon-structedbecauseverylowefficiencyindicatesthattheprojectis atsignificantriskoffailurewiththisteam.Anotherapproachcan beconsideredwhentheefficiencyisverylowbytaking36 person-hoursfor1UCP.ThemainlimitationofSchneider’sapproachisthat theeffortrequiredtodeveloponeUCPiseither20,28or36 person-hours.
In this research, the Unadjusted Actor Weight (UAW) is neglectedassuggestedbyOchodeketal.(2011)sincethe estima-tionaccuracywillnotbeaffected.
1.2. Evaluationcriteria
Severalmethodsexisttoevaluatecostestimationmodels.Inthis research,theevaluationcriteriausedinclude theMeanof Mag-nitudeofErrorRelativetotheestimate(MMER),theRootMean SquaredError(RMSE),theMeanAbsoluteError(MAE),thestandard deviation(SD)ofthemeanerrorandpredictionlevel(PRED).
•MMER:MMERisoneofthecriteriausedforcostestimation mod-elsevaluation(Kitchenhametal.,2001).Fossetal.(2003)argued thatMMERcansometimesbemoreaccuratethantheMeanof theMagnitudeofRelativeError(MMRE).MMERisthemeanof MERasshowninEqs.(8)and(9).
MERi= |Actual PredictedEfforti−PredictedEffort Efforti|
i . (8) MMER= 1 N N
1 MERi. (9)•PRED(x):PREDcanbedescribedastheaverageoftheMRE’s(or MER’s)offbynomorethanxasdefinedbyJorgensen(1995):
PRED(x)= 1 N N
i=1 1ifMERi≤x 0 otherwise . (10)TheestimationaccuracyisdirectlyproportionaltoPRED(x)and inverselyproportionaltoMMER.
•MAE:TheMeanAbsoluteError(MAE)istheaverageofthe abso-luteerrorsbetweentheactualandthepredictedeffortasshown inEq.(11). MAE= 1 N N
i=1|ActualEfforti−PredictedEfforti|. (11)
•Standarddeviation:Theequationofthestandarddeviationcan beseenas: SD=
1 N N i=1 (xi−x¯)2. (12)wherexiistheerroroftheobservation“i”suchthat:xi=(Actual
Efforti−PredictedEfforti)and ¯xisthemeanerrorforN
observa-tions.
•RMSE:TheRootMeanSquaredError(RMSE)isthesquarerootof themeanofthesquareofthedifferencesbetweentheactualand thepredictedeffortsasshowninEq.(13).
RMSE=
Ni=1(Eai−EPi)
2
N . (13)
whereEaandEparetheactualandpredictedeffortsrespectively,
Nisthenumberofobservations.
1.3. Fuzzylogic
Fuzzylogicisderivedfromthefuzzysettheorythatwas pro-posedbyZadeh(1965).Asacontrarytotheconventionalbinary (bivalent)logicthatcanonlyhandletwovaluesTrueorFalse(1or 0),fuzzylogiccanhaveatruthvaluewhichisrangingbetween0 and1.Thismeansthatinthebinarylogic,amembercompletely belongstoordoesnotbelongtoacertainset,howeverinthefuzzy logic,amembercanpartiallybelongtoacertainset. Mathemat-ically,afuzzysetAisrepresentedbyamembershipfunctionas follows:
Fz[x∈A]=A(x):R→[0,1]. (14)
whereAisthedegreeofthemembershipofelementxinthefuzzy setA.
Afuzzysetisrepresentedbyamembershipfunction.Each ele-mentwillhaveagradeofmembershipthatrepresentsthedegree towhichaspecificelementbelongstotheset.Membership func-tionsincludeTriangular,TrapezoidalandS-Shaped.Infuzzylogic,
linguisticvariablesare usedtoexpressaruleor fact.For exam-ple,“thetemperatureisthirtydegrees”isexpressedinfuzzylogic by“thetemperatureislow”or“thetemperatureishigh”where thewordslowandhigharelinguisticvariables.Infuzzylogic,the knowledgebaseisrepresentedbyIf–Thenrules.Forexample,if thetemperatureishigh,thenturnonthefan.Thefuzzysystemis mainlycomposedofthreeparts.TheseincludeFuzzification,Fuzzy RuleApplicationandDefuzzification.Fuzzificationmeansapplying fuzzymembershipfunctionstoinputs.FuzzyRuleApplicationis tomakeinferencesandassociationsamongmembersindifferent groups.Thethirdstepinthefuzzysystemistodefuzzifythe infer-encesandassociations,makeadecisionandprovideanoutputthat canbeunderstood.Inthispaper,fuzzylogicisusedtocalibratethe productivityfactoroftheregressionmodel.
1.4. Neuralnetwork
Anartificialneuralnetwork(ANN)isanetworkcomposedof artificialneuronsornodeswhichemulatethebiologicalneurons (Lippman,1987).ANNcanbetrainedtobeusedtoapproximate anon-linearfunction,tomapaninputtoanoutputortoclassify outputs.Thereareseveralalgorithmsavailabletotrainaneural networkbutthisdependsonthetypeandtopologyoftheneural network.ThemostprominenttopologyofANNisthefeed-forward networks.Inafeed-forwardnetwork,theinformationalwaysflows inonedirection(frominputtooutput)andnevergoesbackwards. AnANNiscomposedofnodesorganizedintolayersandconnected throughweightelements.Ateachnode,theweightedinputsare aggregated,thresholdedandinputtedtoanactivationfunctionto generateanoutputofthatnode.Mathematically,thiscanbe rep-resentedby: y(t)=f n
i=1 wixi−w0 . (15)wherexiareneuroninputs,wiaretheweightsandf[.]isthe
acti-vationfunction.
Feed-forwardANNlayersareusuallyrepresentedasinput, hid-denand outputlayers. If the hidden layerdoes not exist, then thistypeoftheANNiscalledperceptron.Theperceptronisa lin-earclassifierthatmapsaninputtoanoutput.Iftherelationship betweentheinputandoutputisnotlinear,oneormorehidden layersshouldexistbetweentheinputandoutputlayersto accom-modatethenon-linear properties.Severaltypesoffeed-forward neuralnetworkswithhiddenlayersexist.TheseincludeMultilayer Perceptron(MLP),RadialBasisFunctionNeuralNetwork(RBFNN) andGeneralRegressionNeuralNetwork(GRNN).AMLPcontains atleastonehiddenlayerandeachinputvectorisrepresentedbya neuron.Thenumberofhiddenneuronsvariesandcanbe deter-minedbytrialand errorsothattheerrorisminimal. MLPsare usuallytrainedusingthebackpropagationalgorithm.Inthispaper, anMLPmodelisusedtopredictsoftwareeffortfromusecase dia-grams.
1.5. Relatedwork
SomeissuesrelatedtotheUCPmodelhavebeenaddressedin previouswork.Authorsin (Diev,2006)and (Anda etal., 2001) workedonadjustmentfactors,whileothersin(Andaetal.,2001) and(ArnoldandPedross,1998)highlightedthediscrepanciesin designingusecasemodels.Researchersin (Robioloand Orosco, 2008),(Robioloetal.,2009)and(OchodekandNawrocki,2008) proposeddifferentsizemetricssuchastransactions,TTPointsand paths,while others (Periyasamy and Ghode,2009; Wangetal., 2009;SchneiderandWinters,2001;BrazandVergilio,2006;Nassif etal.,2011a,b;Mohagheghietal.,2005;Ochodeketal.,2011)went
furthertoextendtheUCP model byprovidingnewcomplexity weightsorbymodifyingthemethodusedtopredicteffort.
Regardingsoftwareeffortpredictionmodelsbasedonmachine leaningtechniques,Azzehetal.(2010)andAzzehetal.(2011) pro-posedtwomodelsforsoftwareeffortestimation.Thefirstoneis anestimation-by-analogymodelbasedontheintegrationoffuzzy settheorywithgreyrelationalanalysisandfuzzynumbers. How-ever,thesecondmodelisbasedonanalogyestimationwithfuzzy numbersandcanbeusedintheearlystagesofthesoftwarelife cycle.Bothmodelswereevaluatedusingfivedifferentdatasetssuch asInternationalSoftwareBenchmarkingStandardsGroup(ISBSG), Desharnais,Kemerer,Albrecht&GaffneyandCOCOMO81.MMRE, MdMRE, MMERand PRED(25) wereusedas evaluation criteria. Resultsproved thattheproposedmodelsarecompetitivewhen comparedwithothermodelssuchascase-basedreasoning, mul-tiple linear regression, stepwiseregression and artificialneural networks.
Pendharkar et al. (2005) developed a Bayesian network to predict software development effort. The proposed model can incorporatedecisionmakingrisks.Themodelwasevaluatedusing 33industrialprojectsandwascompared withotherneural net-workandregressiontreeforecastingmodels.Theauthorsproved thattheirmodelcanbeacompetitivemodelforsoftwareeffort predictionbasedontheabsoluteerrorcriterion.
Papatheocharousetal.(2010)usedfeatureselectiontechnique ontheDesharnais andISBSG datasetstoreduce thenumber of cost drivers that are used as inputs to cost prediction models withoutdeterioratingtheperformanceofthemodel.The exper-imentsshowthat reducingthenumberof cost driversleadsto reducingthecomplexity,learningtimeandeliminatingneedless calculations.
AndreouandPapatheocharous(2008)usedfuzzydecisiontrees topredictsoftwareeffort.Theauthorsusedthedecisiontrees algo-rithmsCHAIDandCARTtoevaluatetheirmodelusingtheISBSG dataset.The evaluation criteriaused include theMean Relative Error(MRE),NormalizedRootMeanSquaredError(NRMSE),and thecorrelationcoefficient(CC).Theexperimentsshowedthatthe proposedapproachcanbeusedforsoftwareeffortestimationat highlyaccuratelevels.
Papatheocharous and Andreou (2007) used artificial neural networks(ANN)withInputSensitivityAnalysis(ISN)todevelop softwarecostpredictionmodel.SeveralANNtopologieswere cre-ated and trained using theDesharnais and ISBSG datasets. The evaluationcriteriausedincludeNRMSE,CC,MSE,RMAE,MAEand PRED.Theresultsshowthatthenumberofinputsofacost predic-tionmodelcanbereducedtoanumberbetween3and5toreduce thecomplexityofusingmanyinputparameters.
HuangandChiu(2006)usedGeneticAlgorithmtodetermine theappropriateweightedsimilaritymeasuresofeffortdriversin analogy-basedsoftwareeffortestimationmodels.Theauthorsused three weighted analogy methods. These include the unequally weighted, the linearly weighted and the nonlinearly weighted methods.TheexperimentswereconductedusingtheISBSGdataset andprovedthattheproposedapproachcanenhancetheaccuracy ofsoftwareeffortestimation.
Kumaretal.(2008)proposedaWaveletNeuralNetwork(WNN) forsoftwarecostpredictionusingMorletandGaussianfunctionsas transferfunctions.Theproposedapproachwasevaluatedusingthe CanadianFinancialandIBMdataprocessingservicesdatasetsusing theMMREcriteria.TheWNNmodeloutperformedothermodels suchasMLP,RBFNN,multiplelinearregression,dynamicevolving neuro-fuzzyinferencesystemandsupportvectormachine.
deBarcelosTrontoetal.(2008)investigatedastepwise regres-sion model and a neural network model for software cost prediction.TheproposedmodelswereevaluatedusingCOCOMO’81 datasetusingtheMMREandR2criteria.Theresultsshowedthatthe
proposedmodelscancompetewithothermodelssuchasCOCOMO andSLIM.
IdriandAbran(2000)appliedfuzzylogicontheCOCOMO’81 model. Fuzzysets with Trapezoidalmembership function were definedforeachcostdriver.Theevaluationwasperformedusing theCOCOMO’81datasetusingtheREandPRED.Theresultsshow that COCOMO’81used withfuzzy logic tacklestheimprecision causedbythecrispinputs(costdrivers)andgeneratesmore grad-uateoutput.
Ahmedetal.(2005)proposedanadaptivefuzzylogicframework forsoftwareeffortprediction.Thisframeworkincorporatesexpert knowledgetoimprovetheaccuracyofsoftwareeffortestimation. Theframeworkwasevaluatedusinganartificialdatasetsaswellas theCOCOMOdatabase.
Jiangetal.(2007)andXiaetal.(2008)builtlinearregression modelswithalogarithmictransformationbasedonfunctionpoints usingISBSGdata.Xiaetal.usedtheregressionmodelasan activa-tionfunctioninaneuralnetworktocalibratetheweightsofthe functionpoint model.However,Jiang etal. usedtheregression modeltostudytheeffectofsoftwaresizeondevelopmenteffort andsoftwarequality. Themainconcernofthesemodelsisthat theyignoretheinfluenceofthenon-functionalrequirementson estimation.
ParkandBaek(2008)proposedaneuralnetworkforsoftware effortestimation.Thismodeltakessixinputsandtheaccuracyof theproposedmodelwascomparedwiththeaccuracyofhuman expertjudgmentsandtwotraditionalregressionmodels.The eval-uationwasconductedon148ITprojectsandresultsprovedthatthe proposedneuralnetworkgivesbetterresultsthanexisting regres-sionmodelsbasedontheMREcriterion.
Huangetal.(2007)usedaneuro-fuzzyapproachtocalibratethe parametersoftheCOCOMOmodel.Theproposedmodelhassome characteristicssuchaslearningabilityandgoodinterpretability, whilemaintainingthemeritsoftheCOCOMOmodel.Themodel dealseffectivelywithimpreciseanduncertaininputandenhances thereliabilityofsoftwarecostestimates.Inaddition,itallowsinput tohavecontinuousratingvaluesandlinguisticvalues,thus avoid-ingtheproblemofsimilarprojectshavinglargedifferentestimated costs.Theresults showedthat PRED(20%)and PRED(30%) were improvedbymorethan15%and11%,respectivelyincomparison withthatofCOCOMO81.
AttarzadehandOw(2011)proposedaneuralnetworkmodel thatincorporatesCOCOMOforsoftwaredevelopmentcostandtime forecasting.TheCOCOMOandNASAdatasetswereusedfor evalu-ationbasedontheMMREandPREDcriteria.
Idri et al. (2010) proposed two Radial Based Function Neu-ralNetwork(RBFNN) modelfor softwareeffortestimation.One modelusestheCalgorithmwheretheothermodelusesthe Apc-IIIalgorithm.EachoftheRBFNNmodelsusesdifferentformulato calculatethewidthoftheRBFfunctions.Themodelwastrained usingCOCOMO81andTukutukudatasetsandevaluatedbasedon MMREandPREDcriteria.Theresultsshowthattheaccuracyofthe estimationgeneratedbytheRBFNNmodelisaffectedbythetype ofthewidthformulausedinthemodel.
Idrietal.(2008)investigatedtheuseoftheRBFNNmodelsin softwareestimationandespeciallytheroleofthehiddenlayer.In theirpaper,theauthorsusetwoclusteringtechniques;theC-means andtheAPC-III.Acomparisonbetweenthesetechniqueswas con-ductedusingCOCOMO81andTukutukudatasets.Theresultsshow thattheC-meansalgorithmperformsbetterthantheAPC-III algo-rithm.
Reddyetal.(2008)proposedaRBFNNmodelforsoftwareeffort estimation.Themodelwastrainedbasedonthek-meanclustering algorithmandwasevaluatedusingtheCOCOMO81dataset.
ShinandGoel(2000)presentedanobjectivemodeling method-ologytodeterminetheRBFNNmodelparametersusingtheirSG
algorithm.Themodelwasthenusedtopredictsoftwareeffortusing theNASAdataset.
Heiat(2002)comparedaneuralnetworkmodelwithregression models.Theevaluationwasconductedon67projectsfromthree differentsources.Theauthorconcludedthattheneuralnetwork modelwascompetitivetoregressionmodelswhenthird gener-ationlanguagewasused.However,regressionmodelsgavebetter resultswhencombinationsofthirdandfourthgenerationlanguage projectswereused.Theevaluationcriterionusedwasthemean absolutepercentageerror(MAPE).
Tan et al. (2009) proposed a new LOC estimation method for informationsystemsbasedontheirconceptualdatamodels throughamultiplelinearregressionmodel.Theauthorsevaluated theirworkusingopensourceandindustrialprojects.
AnvikandMurphy(2011)usedmachinelearningtechniquesto createrecommenderstotriagebugreportsthatcanbeusefulto streamlinethedevelopmentprocess.
Lopez-Martín(2011a,b)and Lopez-Martínetal.(2008, 2011)
createdregression models fromshortscale programsand from ISBSGrepository.Theauthorsalsodevelopedfuzzylogicand neu-ralnetworkmodelssuchasFeed-ForwardandGeneralRegression NeuralNetworks.Theauthorsprovedthatthesemodelscanbeused asalternativestoregressionmodelstopredictsoftwareeffort.The evaluationcriteriausedwereMMREandMMER.
Lietal.(2010)proposedaholisticproblem-solvingapproach which uses a ridge regression technique and multi-objective optimization.Theexperiments showedthatadaptiveregression modelsoutperformmachinelearningmodelswhenmulti-collinear datasetsareused.Inthisresearch,AlbrechtandDesharnaisdatasets wereusedandtheevaluationwasbasedontheMMRE,MdMREand PRED(0.25).
References in the first paragraph of Section 1.5 focused on enhancingtheUCPmodel;however,theydidnottacklethemain problemsthatexistinsoftwareestimationsuchasthenon-linear relationshipbetweensoftwaresizeandeffort.Additionally,none ofthepreviousworkusedneuralnetworkmodelstopredict soft-wareeffortfromusecasediagrams.Ontheotherhand,References (Pendharkar et al., 2005; Papatheocharous and Andreou, 2007; Kumaretal.,2008;deBarcelosTrontoetal.,2008;ParkandBaek, 2008; Attarzadeh and Ow,2011; Idri etal., 2008,2010; Reddy et al.,2008; Shin andGoel, 2000)usedneuralnetwork models suchas MLP and RBFNNto predictsoftware estimation. Refer-ences(Azzehetal.,2010,2011;HuangandChiu,2006)usedsoft computing techniques with analogybased estimation, whereas References(IdriandAbran,2000;Huangetal.,2007)usedsoft com-putingwithalgorithmicmodels.References(Ahmedetal.,2005; Papatheocharousetal.,2010)usedfuzzylogicandfuzzydecision tree,respectivelyforsoftwareeffortestimation.Otherworkssuch as(Heiat,2002;Lopez-Martín,2011a,b;Lopez-Martínetal.,2008, 2011)developedneuralnetworkmodelsandcomparedtheirworks withregression models.Regressionmodelssuchas linear, non-linear,stepwiseandridgehavebeenusedtopredictsoftwareeffort asshownin(Jiangetal.,2007;Xiaetal.,2008;Tanetal.,2009;Li etal.,2010).Otherworksuchas(Papatheocharouset al.,2010) was tomake software estimation easier by reducingthe num-berofthemodel’sinputswithoutdeterioratingtheperformance ofthemodel.
Themaindistinguishingaspectofthisworkfromtheexisting ones is that we propose a novel log-linear regression model to estimate software effortfrom usecase diagrams that takes into consideration the non-linearity in the software size-effort relationship.Furthermore,noneoftheexistingworkproposeda MLPmodeltopredictsoftwareeffortfromusecasediagrams.In thispaper,notonlynewregressionandMLPmodelsareproposed for software effort prediction, but also a thorough comparison betweentheproposedlog-linearregressionandMLPmodelwas
conductedbasedonhowlargethesoftwaresizeisbeingusedas aninputtothemodels.
2. Regressionmodel
Thissectionpresentstheproposedregressionmodel,theinputs tothemodelaswellasthecalibrationoftheproductivityfactor usingfuzzylogicapproach.Thisworkisanextensiontothework proposedin(Nassifetal.,2011a).
Instatistics,regressionanalysisfocusesongeneratinga relation-shipbetweenadependentvariable(akaresponse)andoneormore independentvariables(akapredictors)(Allison,1984).Regression analysisstudiesshowhowthedependentvariablerespondstoa changeintheindependentvariablesanditidentifieswhich inde-pendentvariableis relatedtothedependentvariable.Legendre (1805)andGauss(1809)wereamongthefirstpeoplewhoworked withregressionmodels200yearsago.Therearemanytypesof regressionanalysis.Theseincludesimplelinearregression, multi-plelinearregressionandnon-linearregression.Regressionanalysis hasbeenwidelyusedinsoftwareestimation.Softwaredevelopers andprojectmanagersusehistoricaldatatobuildregressionmodels. Theregressionmodelsarethenevaluatedandcomparedwith alter-nativemodelssuchassoftcomputingmodelsasshownin(Heiat, 2002).
Eq.(7)showshowsoftwareeffortiscalculatedfromsoftware sizebasedontheUCPmodel.Asshownintheequation,the relation-shipbetweensoftwareeffortandsizeislinearandthisassumption doesnotreflect theactualsituationin thesoftwareindustryas explainedbyMcConnell(2006).McConnellstatesthat“People nat-urallyassumethatasystemthatis10timesaslargeasanother systemwillrequiresomethinglike10timesasmuchefforttobuild. Buttheeffortfora1,000,000LOCsystemismorethan10timesas largeastheeffortfora100,000LOCsystem.Usingsoftware indus-tryproductivityaverages,the10,000LOCsystemwouldrequire 13.5staffmonths.Ifeffortincreasedlinearly,a100,000LOCsystem wouldrequire135staffmonths.Butitactuallyrequires170staff months”.Secondly,Longstreet(2008)reportedthatwhen estima-tionisbasedontheFunctionPointsmethod,theeffortrequired todevelop oneFunction Pointis between0.5and 5hforsmall projects(lessthan100functionpoints)andbetween20and60h forlargeprojects(greaterthan7000functionpoints).Thirdly,the equationusedbyBoehmetal.(2000b)forsoftwareeffort estima-tionisEffort=a(SLOC)b.SLOCisthesizeinSourceLinesofCode.
Boehm’sequationshowsthattherelationshipbetweensoftware size and effort in non-linear. Fourthly, Pendharkar and Rodger (2009)mentionedthatthelargertheprojectis,thelargertheteam isrequired.Whenthenumberoftheteammembersincreases,the numberofthecommunicationpathsamong thisteamwill dra-maticallyincrease asshown in Eq. (16), and consequently,this requires more effort for the team communication and project management.
Communication Paths= N(N−1)
2 . (16)
where“N”isthenumberofpeople.Basedontheabovereferences, weconcludethat when softwaresize increases,software effort wouldincreasebutwithanon-linearrelationship.Inthisresearch investigation,anovelregressionanalysisisappliedtogeneratea newequationtocalculatesoftware effort.Theproposed regres-sionmodeltakesintoaccountthenon-linearrelationshipbetween softwareeffortandsizeaswellastheproductivityfactorofthe team.Furthermore, the valueof the productivityfactor is pro-posedusingamultiplelinearregressionmodeloftwoindependent variables.
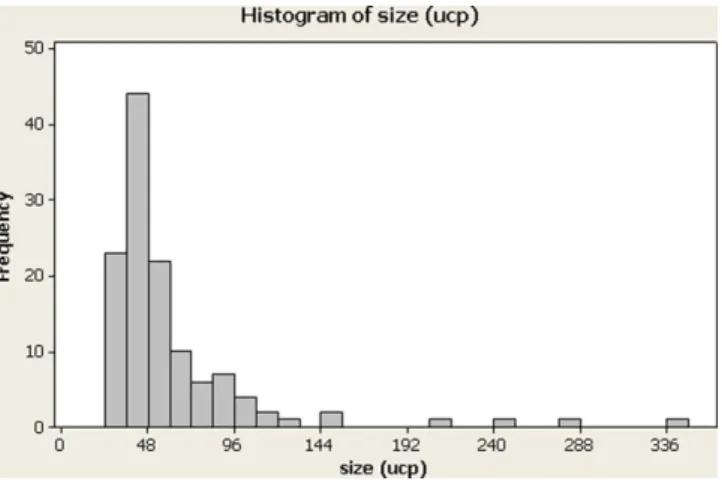
Fig.1.Histogramofsize.
Thegeneralequationofsoftwareeffortcanberepresentedas (GalorathandEvans,2006):
Effort= Complexity
Productivity×Size. (17)
whereComplexityisthecomplexityfactorofaprojectand Produc-tivityistheproductivityfactoroftheteamthatisdevelopingthis project.Tofindthenon-linearrelationshipbetweensoftwaresize and softwareeffort,regression analysiswasappliedonprojects usedinpreviouswork(Nassifetal.,2011a)thathavesimilar com-plexityandteamproductivity.Thus,atthispoint,complexityand productivityfactorsareignoredandsoftwareeffortisafunctionof softwaresizeonly.Toobtainaccurateresultsinregressionanalysis, datashouldbenormallydistributed(CameronandTrivedi,1998). Ifdatawerenormallydistributed,theregressionequationwould be:
Effort=a×Size+b. (18)
whereaandbareconstants.
The histograms of softwaresize (Fig.1)and software effort (Fig.2)showthat dataarenotnormallydistributed.Generating regressionmodelsfromdatabasedonFigs.1and2ispossiblebut thiswillleadtopoorresults.Forthisreason,datawerenormalized usinglogarithmictransformation.Afternormalization,data(lnSize andlnEffort)becamemorenormallydistributed(Figs.3and4).In thiscase,thelinearregressionisappliedonln(Size)andln(Effort) insteadasshowninEq.(19).Thisisalsocalledalog-linear regres-sion.
ln(Effort)=c×ln(Size)+d. (19)
Fig.3. Histogramofln(size).
wherecanddareconstants.Eq.(19)canberewrittenas:
Effort=A×SizeB. (20)
UsingMinitab,thevaluesofAandBare8.16and1.17 respec-tively.ThevaluesofAandBweredeterminedbasedonthedataset usedfortrainingtheregressionmodel.Whennewdatasetsbecome available,themodelcanbecalibrated.Themethodusedfor cal-ibrationsvariesbased onthesourceand theimportanceof the newdataset.Forinstance,moreweightcanbegivenforthenew datasets.Furthermore,olderprojects(e.g.morethan5years)can bedeletedorgivenlessweight.TheEffort-Sizerelationshipis rep-resentedasfollows:
Effort=8.16×Size1.17. (21)
whereSizeisthesoftwaresizeinUCPandEffortisthesoftware effortinperson-hours.Forinstance,Eq.(21)showsthenon-linear relationshipbetween Effortand Size and ignoresthe Complex-ityandProductivityfactors.Themainequationoftheproposed regressionmodelisexpressedinEq.(23).
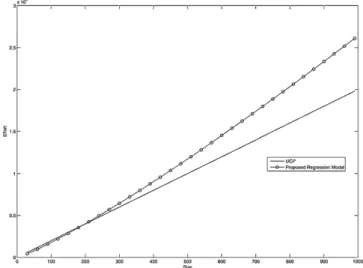
Fig.5showstherelationshipbetweensoftwaresizeandeffort basedontheUCPmodelasexpressedinEq.(7)(solidline)and theproposedlog-linearregressionmodelasexpressedinEq.(21)
(markedby circles).Thiscomparisonshows thatthenon-linear relationshipisnotsignificantforsmallprojects(lessthan200UCP). Ontheotherhand,thenon-linearrelationshipstandsoutfor mid-sizeandlargeprojects.Theproposedregressionmodelalsoshows thatwhensoftwaresizebecomeslargerandlarger,softwareeffort is exponentiallyincreasing.For instance, when softwaresize is 1000UCP,softwareeffortbasedonthelog-linearregressionmodel
Fig.4.Histogramofln(effort).
Fig.5.Comparisonbetweensoftwaresizeandsoftwareeffort.
islargerthanthesoftwareeffortbasedontheoriginalUCPmodel by30%.
Itisveryimportanttotestandvalidatetheproposed regres-sionequation(Eq.(21))becausethisequationwillbethecoreof theregressionmodel.Tothoroughlyvalidatethisequation,several techniqueswereused.Theseincludethecoefficientof determi-nation R2,Spearman and Pearson coefficients and theAnalysis
of Variance(ANOVA).R2 isthepercentageofvariation inEffort
explained by thevariable Size. An acceptable value of R2≥0.5
(Humphrey, 1995).Thevalue R2 reported for Eq. (21) is 0.972.
Approximately97%ofthevariationinEffortcanbeexplainedby thevariableSize.Thisshowsa strongrelationshipbetweenSize and Effort. Tothoroughly test the regression model, Spearman (Lehmann,1998)andPearson(Edwards,1976)coefficientswere determinedtomeasurethecorrelationstrengthbetweentheEffort andSize.ThecoefficientsrangeofbothSpearmanandPearsonis between[−1,1].Thevalue0meansthatthesetwovariablesare notcorrelated.Apositivevaluerepresentsapositivecorrelation. Largercoefficientvaluescorrespondtostrongercorrelations. On thecontrast,negativevaluesmean negativecorrelations.Inour experiments,theSpearmanandPearsoncoefficientsare0.98and 0.97, respectively. Thisshows thatthetwo variables Effort and Sizehaveastrongpositiverelationship.TheAnalysisofVariance (ANOVA)ofEq.(21)showsthatthe“P”valueofthemodelaswell asthepredictorsis0.000.ThePvalueisaprobabilitywithavalue rangingbetween0and1.Instatistics,aPvalueoflessthan0.05 indi-catesthattheresultsarestatisticallysignificantat95%confidence level.Sincethepvaluesofthemodelandthepredictorsareless than0.05,wededucethatallindependentvariables(predictors) aresignificantatthe95%confidencelevel.
Based on theabove experiments and results, theregression equationrepresentsthenon-linearrelationshipbetweensoftware sizeand effortwithhighpercentageofaccuracy.Bytakinginto considerationEq.(21)andEq.(17),themainequationforsoftware effortintheproposedmodelcanbeexpressedasfollows:
Effort=8.16× Complexity
Productivity×(Size)
1.17
. (22)
The second step of the proposed model is to calculate the values ofprojectComplexityand Productivity. Table3presents sometechnicalfactorsthatrepresentthecomplexityofaproject. We will assume that the UCP model’s technical factor TF can representtheprojectcomplexityfactorduringtheestimationof UCP andconsequently,theComplexityfactorin Eq.(22)canbe
ignored.Themaineffortequationoftheproposedregressionmodel becomes: Effort= 8.16 Productivity×(Size) 1.17 . (23)
Withrespecttoproductivity,Table4lists someproductivity attributesrepresentedbytheenvironmentalfactors.Intheoriginal UCPmodel,productivityfactorisonlyincludedwhenestimating theUCPsize.SchneiderandWinters(2001)includedthe produc-tivityfactorwhilecalculatingsoftwareeffortasdiscussedinSection
1.5.Webelievethattheproductivityfactorshouldbeincludedin thesoftwareeffortequation.Based onTable4,thehighest pro-ductivityfactorisachievedwhenthevalueofthefactorsE1–E6is
5andthevalueofthefactorsE7 andE8 is0.Ifweassumethat
prod sum=(
8i=1Ei×Wi),thisimpliesthatthevalueofprodsumis32.5.Ontheotherhand,thelowestproductivityfactorisachieved whenthevalueofF1–F6issetto0andthevalueofF7andF8isset to5.Thisimpliesthatthevalueofprodsumis−10.Intheproposed model,theproductivityfactorinEq.(23)isdeterminedbasedon thevalueofprodsum.Todiscovertheinfluenceofprodsumon soft-wareeffort,amultiplelinearregressionequationwasgenerated withtwopredictors(Sizeandprodsum)asshowninEq.(24).
Effort=409+(24.9×Size)−(52.8×prodsum). (24) Thisequationshowsthatwhensoftwaresizeincreases, soft-wareeffortincreases.However,whentheproductivityoftheteam (prodsum)increases,softwareeffortdecreases.Thisinterpretation iscompatiblewithEq.(23).
ThevalueofthecoefficientofdeterminationR2ofEq.(24)is
0.861.This indicatesthat 86% of thevariation in Effort canbe explained bythe independentvariables size and prodsum. The ANOVAofEq.(24)showsthatthe“P”valueofthemodelis0.000 andthe“P”valueofeachofthepredictorsis0.000.Thisindicates thatallindependentvariablesaresignificantatthe95%confidence level.
Fromtheaboveresults,wededucethattheproposedmultiple linearregressionequationisvalidanditwillbeusedtodetermine theproductivityfactorinEq.(23)basedonthevalueofthevariable
prod sum.Sincethevalueofprodsumvariesbetween[−10,32.5], itisdifficulttopredictthevalueofproductivityinEq.(23)based oneachvalueofprodsum.Forthisreason,theproductivityvariable willbedepictedbasedonfourmainrangesofprodsum.Sincethe
prodsumvariablefallsbetween[−10,32.5],themainfourregions ofthisvariablewillbeselectedasbetween[−10,0],between[1,10], between[11,20]andbetween[21,32.5].Tofindtheinfluenceof
prodsumonthedependentvariableEffortinEq.(24),fourvaluesof
prodsumwillbeselectedsuchthateachvaluebelongstoeachof theaforementionedmainregions.Tominimizetheinfluenceofthe
sizevariableonEffortandonlyfocusontheinfluenceofprodsum, thevalueofthesizevariablewillbethesameforeachvalueof
¬prodsum.Theselectedvalueofsizeis80UCPbecausethevalue
“80”isconsideredasamedium-sizeprojectwithrespecttothepool oftheprojectsusedtogeneratetheregressionequation.Basedon thisinformationandaccordingtoEq.(24),thefollowingrulescan bededuced:
•Ifsizeis80andprodsumis−7thenEffortis2770(−7fallsbetween [−10,0]).
•Ifsizeis80andprodsumis5thenEffortis2137(5fallsbetween [1,10]).
•Ifsizeis80andprodsumis16thenEffortis1556(16fallsbetween [11,20]).
•Ifsizeis80andprodsumis26thenEffortis1028(26fallsbetween [21,32.5]).
Table5
Productivityfactor.
prod sum=(
8i=1Ei×Wi) Productivitydescription Productivityfactor
Lessthan0 Verylow 0.4
Between1and10 Low 0.7
Between11and20 Average 1
Greaterthan20 High 1.3
IfwesubstitutethevaluesofsizeandEffortofthe aforemen-tionedfourrulesinEq.(23),thevalueoftheproductivityvariable willbe0.4,0.7,1and1.3,respectivelyasshowninTable5.
2.1. Productivityfactorcalibration
Usuallyin anyproject,theproductivity factoris determined priortothedevelopmentoftheproject.Forexample,inCOCOMO cost drivers, a productivity factor can be described as Very Low,Low,NominalandHigh.SchneiderandWinters(2001)also assignedvaluestoproductivitysuchas1fornormalproductivity (Effort=size×20),1.4forlowproductivity(Effort=size×28)and 1.8for verylowproductivity(Effort=size×36).Inthis research wefollowedthesameapproachasCOCOMOandSchneiderandwe propose4levelsofproductivityasshowninTable5.Thismakesthe useoftheproductivityfactorsimpler.However,themaindrawback ofthisapproachistheabruptchangeinproductivitylevelswhere previousworksuchas(Idriand Abran,2000)and(Huangetal., 2007)tackledthisissueinCOCOMO.Inthiswork,toresolvethe drawbackoftheabruptchangeinproductivitylevelsandprovide moreaccurateresults,afuzzylogicapproachhasbeenused.
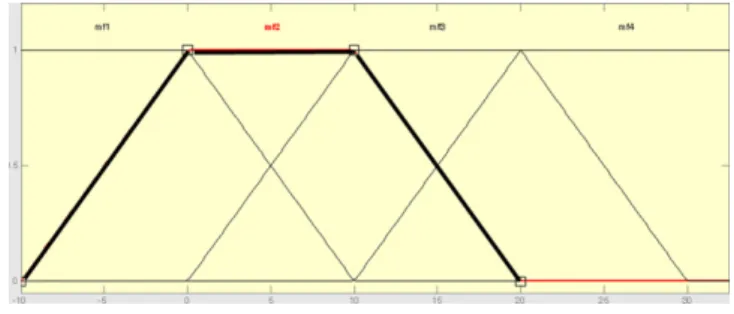
Afuzzylogicapproachisappliedontheproposedregression modeltoadjustthevaluesoftheproductivityfactor.Inthe pro-posedapproach, thefuzzysystemtype is Mamdani(1977),the inputmembershipofthefuzzylogicsystemusedisTrapezoidal becausetheinputisrepresentedbyarange(e.g.between1and10) andTrapezoidalmembershipscanhandlethatbyrepresentinga rangethroughtheupperbaseoftheTrapezoid.Ontheotherhand, theoutputmembershipisTriangularbecausetheoutputisa num-berandnotarangeanditcanberepresentedasthetriangle’svertex. Themethodusedinthedefuzzificationstageisthecentroidbecause thisisthedefaultandmostusedmethod.Matlabversion2010b wasusedtoconducttheexperimentsofthefuzzylogicapproach.
Figs.6and7showtheinputandtheoutputmemberships, respec-tively.InFig.6,therearefourmembershipfunctionswhichinclude mf1,mf2,mf3andmf4.Eachfunctionrepresentsthe“If”partof the“If–Then”rule(akatheantecedentorpremise).Forinstance, inputmembershipmf2representsthe“If”partofthesecondrule whichis“Ifprodsumisbetween0and10”.Ontheotherhand,the fouroutputmembershipfunctions(mf1,mf2,mf3andmf4) repre-sentthe“Then”partofthe“If–Then”rule(akatheconsequentor conclusion).Forinstance,theoutputmembershipmf2represents “thenproductivityfactor=0.7)whichcorrespondstothevertexof thesecondtrianglemf2.
Fig.7.Outputmembership.
Thereare twomainapproachestoelicitfuzzyrules (Xuand Khoshgoftaar,2004).Theseinclude:
1. TheIf–Thenrulesareknown.Astructuredmodelcanbeusedto incorporatetheserules.Membershipfunctionsandweightsof rulescanbecalibratedusinginputandoutputdata.
2.Nopriorknowledgeaboutthesystemisinitiallyused.Afuzzy modelisconstructedbasedonacertainalgorithm.Fuzzyrules andmembershipfunctionsareexpectedtodescribethesystem behavior.Anexpertcanmodifytherulesandthemembership functions.
Inthispaper,thefirstapproachisused.
Thereare four fuzzy rules in the proposedapproach. These include:
1-Ifprodsumislessthan0,thenproductivityfactor=0.4. 2-Ifprodsumisbetween0and10,thenproductivityfactor=0.7. 3-Ifprodsumisbetween10and20,thenproductivityfactor=1. 4-Ifprodsumisgreaterthan20,thenproductivityfactor=1.3.
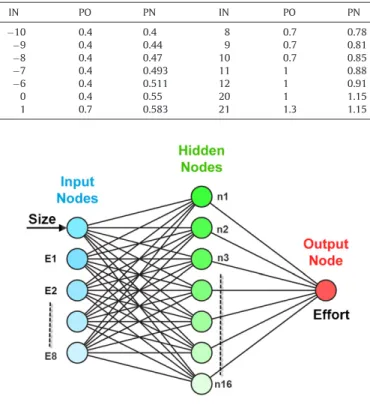
ThefuzzyinferencesystemshowninFig.8cantakeanyinput withintheinputboundary(from−10to32.5).Basedontheinput value,twoormoreinputmembershipfunctionwillbeinterpolated. Theoutputvalueisdeterminedbasedonthecenterofgravityof theoutputsurface.Forinstance,Fig.8showsthatwhentheinput (productivity)is9,theoutputis0.817.Afterapplyingthefuzzy logicapproach,theproductivityfactorhasaspecificvalueforeach valueofprodsum.Table6showssomesamplesofthenewvalues oftheproductivityfactors.ThelabelsIN,POandPNcorrespond toprodsum,oldproductivityfactorandnewproductivityfactor, respectively.
AsseeninTable6,thevaluesofthenewproductivityfactor (PN)arenotascrispasthevalues oftheoldproductivityfactor (PO).Thisleadstomoreaccurateestimationvalues.Forinstance, acompletelistoftheproductivityfactorvaluescanbeobtained usingtheproposedfuzzylogicinferencesystem.
Fig.8.Fuzzyinferencesystem.
Table6
Newproductivyfactor.
IN PO PN IN PO PN −10 0.4 0.4 8 0.7 0.78 −9 0.4 0.44 9 0.7 0.81 −8 0.4 0.47 10 0.7 0.85 −7 0.4 0.493 11 1 0.88 −6 0.4 0.511 12 1 0.91 0 0.4 0.55 20 1 1.15 1 0.7 0.583 21 1.3 1.15 Fig.9. MLPmodel.
3. Multilayerperceptron(MLP)model
ThissectionpresentstheMLPneuralnetworkmodel.Themain inputstotheproposedMLPmodelaresoftwaresizeandteam pro-ductivityrepresentedbytheeightenvironmentalfactors(E1–E8as showninTable4).Theoutputofthemodelissoftwareeffort.The structureoftheproposedneuralnetworkisdepictedinFig.9.The MLPtrainingparameters arelistedinTable7.Thenetworkwill stoptrainingwhenthenumberofepochsreaches250orwhenthe MeanSquaredError(MSE)becomeszeroorwhenthemuvalue exceeds 1e+10. The time was setto “infinity” which indicates thatthetrainingtimedoesnothaveacontrolonwhenthe train-ingshouldstop.ThealgorithmusedtotraintheMLPmodelwas Levenberg–Marquardtbackpropagation.Ninetydatapointswere usedindevelopingtheMLPmodel(datasetsareexplainedin Sec-tion4.1).Amongthe90datapoints,60%wererandomlyusedfor training,20%wereusedforvalidationand20%wereusedfor test-ing.Thetrainingdatapointswereusedinthetrainingprocessand themodelwasadjustedaccordingtotheirerror.Thevalidationdata pointswereusedtomeasurethenetworkgeneralizationandthis causethetrainingtostopwhengeneralizationstopsimprovingto preventoverfitting.Overfittingoccurswhenthemodelgivesgood resultsintrainingbutbadresultsinthevalidationprocess.The testingdatapointshavenoeffectonthetrainingprocessandthey
Table7
MLPtrainingparameters.
Parameter Defaultvalue Description
Epochs 250 Maximumnumberofepochstotrain
Goal 0 PerformancegoalbasedonMSE
Mingrad 1e−10 Minimumperformancegradient
mu 0.001 Initiallearningrate(mu)
mudec 0.1 mudecreasefactor
mu inc 10 muincreasefactor
mumax 1e+10 Maximummu
wereusedtomeasurethemodelperformanceduringthe train-ing.Pleasenotethattheterm“testing”usedhereisdifferentfrom themodel’sevaluationconductedinSection4.Testinginthis con-textisusedduringthedevelopment(training)ofthemodel.When theprocessofdevelopingthemodelhasfinished,themodelwill beevaluatedusing70datapointsthatwerenotincludedinthe trainingprocess.
OneoftheimportantstepsindevelopingtheMLPmodelisto determinethenumberofnodesinthehiddenlayer.Thisproblem ishighlycontroversialandthereisnostraightforwardanswerto it.Ifthenumberofhiddennodesis toofew, therewillbehigh trainingerrorandhighgeneralizationerrorduetounderfitting.On theotherhand,ifthenumberofhiddennodesistoohigh,wemay getlowtrainingerrorbutstillhavehighgeneralizationerrordue tooverfitting.Blum(1992)andLinoffandBerry(2011)arguedthat thenumberofnodesinthehiddenlayershouldbebetweenthe numberofnodesintheinputlayeranddoublethatnumber.Inour case,thenumberofhiddennodesfallsbetween10and18since thenumberofinputsis9.Withinthedatapointsusedtodevelop themodel,thesize,environmentalfactors(E1–E8)andtheactual
effortofeachprojectareknown.Inthetrainingprocess,thek-fold (k=10)cross-validationtechniqueisused.Thismeansthatthe90 datapointswillbedividedinto10equalsets.Theprocesswillbe repeated10times.Ineachtime,9setswillbeusedfortraining andvalidation,and1setfortesting.Afterthecompleteprocesshas finished,allthesetswillhavebeenusedinthetraining,validation andtestingprocesses.Theroundwithminimaltestingerrorwill beselected.AftertheMLPhasbeendeveloped,itwillbeevaluated on70datapointsthatwerenotincludedinthetrainingstage.To demystifytheprocessoftrainingtheneuralnetworkmodel,the followingalgorithmisused:
1-Assignthedata(90projects)tobeusedindevelopingtheMLP model.
2-Theremaining70projectswillbeusedtoevaluatetheMLP model(Section4).
3-Randomlydividethe90datapointsinto10equalsets(S1to S10).
4-Setthenumberofnodesinthehiddenlayerto10(“nh”=10). 5-Setthenumberoftrainingrounds(i)to1(“i”=1)
6-InRound“i”(“i”isanumberbetween1and10),use9sets fortrainingandvalidationand1setfortesting(foreachvalue of“i”,9differentsetsareusedfortraining/validationandthe remainingsetfortesting)
7-RecordthetestingerrorVi-nh(“i”representsthenumberof theround,and“nh”thenumberofnodesinthehiddenlayer. Forinstance,thefirsttestingerrorwillbeV1-10).
8-Incrementthevalueof“i”by1.
9-Ifthevalueof“i”is11,thenincrementthevalueof“nh”by1 andsetthevalueof“i”to1.
10-Ifthevalueof“nh”=19,thenstoptrainingprocessandexit. 11-Gotostep“6”
Tenroundsoftraining/validationandtestingwereperformed foreachvalueofthenumberofhiddennodes“nh”.Thevaluesof “nh”werechosenbetween10and18.Thevalue10representsthe numberoftheinputnodesplus1.Thevalue18representsthe num-berofhiddennodesmultipliedby2.Experimentsshowedthatthe minimalvalueofthetestingerroroccurredwhenthenumberof thehiddennodesis16.
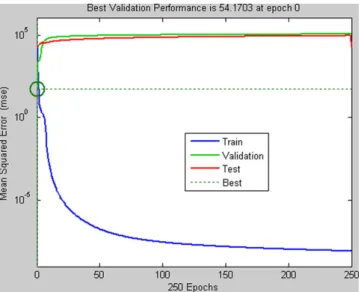
Fig.10showstheperformancegraphofthetrainingprocess.The trainingcurveisrepresentedinblue(lowercurve)anditshows thatthetrainingerror(basedonMSE)decreaseswhenthenumber ofepochsincreases.Nonetheless,thebestperformanceisnotset whenthenumberofepochsis250becausethevalidationerror (greencurve) starts toincrease afterepoch0. This meansthat
Fig.10.Performancegraph.
generalizationstoppedimprovingafterepoch0andthetraining processwasstoppedatthisstagetopreventoverfitting.Thetesting curve(redcolor)alsoindicatesthattheerrorincreasesafterepoch 0andthusstoppingthetraining atepoch0isa validapproach.
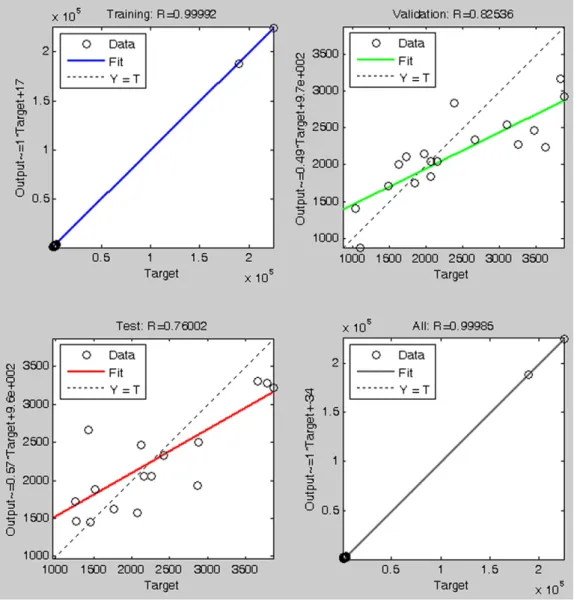
Fig. 11 shows that regression graph of training, validation and testing.Thebestresultsareachievedwheneachofthetraining, validationandtestingpointsrepresentsastraightline.Thismeans thatthevalueofthecorrelationcoefficientRis1.Thecorrelation coefficientmeasuresthestrengthandthedirectionbetweentwo variableswhichareinthiscasetheactualeffort(xaxis)andthe estimatedeffortfromthemodel(yaxis).ThevaluesofRintraining, validationandtestingare0.99,0.82and0.76,respectively.These valuesshowthatthereisapositiveandstrongrelationshipbetween theactualandestimatedeffortsineachofthetraining,validation andtesting.
3.1. TestingtherobustnessoftheMLPmodel
Afterthemodelhasbeendeveloped,itwastestedtoseehow stableandrobustthemodelis.Thisistostudyhowtheoutputofthe MLPmodelvarieswhenachangeintheinputoccurs.Theoutputof themodelisafunctionofsoftwaresizeandteamproductivity.Ifwe ignoretheteamproductivityatthismoment,theoutput(software effort)willbeafunctionofsoftwaresize.Forthemodeltobe sta-bleandrobust,wehavetwoconstraints.First,ifthesoftwaresize increases,softwareeffortshouldincrease.Second,theaverage out-puterrorofthemodelshouldfallwithinanacceptableerrorrange. Twelveprojectsofsizebetween30and40UCP(incrementedby 10)wereusedtotesttherobustness.Wefoundthatoutputofthe MLPmodelincreaseswhenthesizeincreasesandtheerrorbased onthelog-linearregressionmodelisacceptable.
4. Models’evaluationandcomparisonamongmodels
This section presents the evaluation of the proposed MLP and log-linearregression models.A comparison wasconducted betweentheproposedmodelsandtwoothermodelsthatpredict softwareeffortfromusecaseswhicharetheUCPandSchneider’s models.Ninetydatapointswereusedintrainingthemodelsand70 datapointswereusedforevaluation.Theevaluationprocesswas basedontheMMER,PRED,RMSE,MAEandthestandarddeviation (SD)ofthemeanerror(differencebetweenactualandestimated effort).
Fig.11. Regressiongraph.
4.1. Projectdatasets
Thisresearchisbasedonsoftwareeffortpredictionfromuse casediagrams.Wehaveencounteredmanydifficultiesin acquir-ingindustrialprojectsbecauserevealingUMLdiagramsofprojects isconsideredconfidential tomanycompanies.Public published datasetssuchasDesharnais,COCOMO,AlbrechtandNASAcannot beusedinourworkbecausetheunitofsizeinthesedatasetsis eitherSLOCorfunctionpoints.Forthisreason,wehaveprepared aquestionnairethatcouldhelpusobtainindustrialdatawithout actuallyhavingUMLdiagrams.Inthisquestionnaire,weaskedfor example,thequantityofusecasesineachproject,thenumberof transactionsintheMainSuccessScenarioandintheExtension Sce-nario,actualsoftwaresizeandeffortaswellassomenon-functional requirements such as factors contributing to productivity and
complexity. One hundred and sixty industrial and educational projectswerecollectedfromthreemainsources.Astatistical pro-file of thesedatasets isdepicted inTable 8.The three datasets include:
•ISBSG:ThedefaultISBSG repositorydoesnotcontainprojects thathaverequiredinformationaboutUMLdiagrams.Wehave requestedspecialprojectsfromISBSGthatcontaininformation abouttheusecasediagrams.Asforourrequest,wehavereceived 223projectspreparedspecificallyforus.Theseprojectswere fil-teredsincemanyofthemdonotcontaintheinformationrequired inourresearch.Outofthe223projects,50projectswereselected tobeusedintheevaluationprocessthatsatisfyourrequirements. FPsizewasconvertedtoUCPusingtherulesproposedbyKoirala (2009).
Table8
Statisticalprofileofdatasets.
Dataset Mean StDev Minimum Median Maximum Skewness Kurtosis
Western 1672.4 414.3 696 1653 2444 −0.05 −0.82
CompuTop 20,573 47,327 570 3248 224,890 3.26 10.69
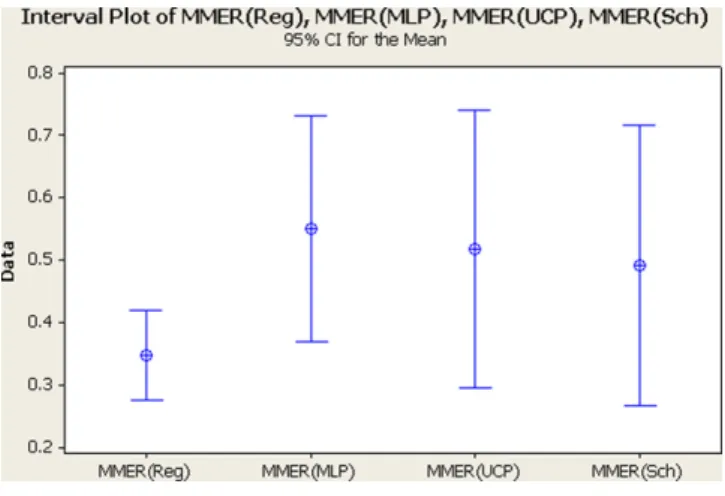
Fig.12.MMERmaindataset.
•WesternUniversity,Canada:Sixtyfiveprojectswerecollected from thefourthyearsoftwareengineering students andfrom Master’s students in the Computer Science department. The projectsweredevelopedandimplementedusingUMLandobject orientedlanguages.IBMRationalsoftwarewasusedasaCASE tool.Amongthese65projects,55projectswereusedin devel-opingthemodelsand10projectswereusedintheevaluation process.
•CompuTop: This is a medium-sized company overseas that employs14peopletodevelopseveralprojectssuchas informa-tionsystemsforchainsofhotels,multi-branchuniversitiesand multi-warehousesbookstores.Thearchitecturesusedtodevelop theseprojectsare2-tierdesktopapplicationand3-tierweb archi-tecture.TheCASEtoolusedisSybasePowerDesigner12.5and15. Fortyfiveprojectswerecollected.Amongthese45projects,35 projectswereusedindevelopingthemodelsand10projectswere usedintheevaluationprocess.
4.2. EvaluationofMLPandlog-linearregressionmodels
Amongthe160projectsinthethreedatasets,90projectswere usedtotraintheMLPmodeland70projectswereusedto eval-uate(test)themodel. Threemainexperimentswereconducted toevaluatetheMLPand Regressionmodels.First,theproposed modelswereevaluatedusingthemaindatasetthatcontainsthe wholeevaluatingdatapoints(70projects).These70projectsare differentfromthe90projectsusedtotrainthemodel.Inthe sec-ondexperiment,themodelswereevaluatedusingadataset,named “small”,thatcontains38projectsofeffortslessthan3000 person-hours.Inthethirdexperiment,themodelswereevaluatedusinga dataset,named“large”,thatcontains32projectsofeffortslarger than3000person-hours.The main purposeofconducting three experiments is to study the performance of the MLP and log-linearregressionmodelsbased onthesize oftheprojectsused in the evaluation (small versus large projects). Table 9 shows theevaluationresultsforthemain,smallandlargedatasets.The columns Reg, MLP, UCP and Sch correspond to the log-linear regressionmodel,MLPmodel,UCPmodelandSchneider’smodel, respectively.Figs.12–14showtheMMERIntervalplotsat95% con-fidencelevelofthemain,smalland largedatasets,respectively.
Figs.15–17showtheMAEIntervalplotsat95%confidencelevel ofthemain,smallandlargedatasets,respectively.Additionally,
Figs. 18–29 depict the actualversus predicteffort relationship of the regression model, MLP model, UCP model and Schnei-der’smodelbasedonthemain,smallandlargedatasets.Section
4.3 demonstrates a detailed explanation of Table 9 as well as
Figs.12–29.
Fig.13.MMERsmalldataset.
Fig.14.MMERlargedataset. 4.3. Comparisonamongmodels
Table9showstheevaluationresultsoftheproposedlog-linear regression andMLPmodels,aswellastheUCPandSchneider’s models.Theevaluationwasconductedonfivedifferentcriteria. TheseincludetheMMER,PRED,RMSE,MAEandSDofthemean error. Low values of MMER, RMSE, MAE and SD indicategood results.Onthecontrary,highPREDvaluesindicategoodresults. Basedonthemaindataset(whenallevaluationprojectswereused), thelog-linearregressionmodelandtheMLPmodelhavesimilar MMERandPREDvalues.However,RMSE,MAEandSDvaluesshow
Table9
Modelsevaluation.
Criteria Maindataset Smalldataset Largedataset
Reg MLP UCP Sch Reg MLP UCP Sch Reg MLP UCP Sch
MMER 39.2 40 46.7 45 43.2 27.2 42.4 41.6 34.7 55 51.7 49.1 PRED(25) 37.1 45.7 34.2 40 36.8 60.5 36.8 39.4 37.5 28.1 31.2 40.6 PRED(50) 75.7 72.8 71.4 72.8 78.9 86.8 71 73.6 71.8 56.2 71.8 71.8 PRED(75) 94.2 90 90 90 89.4 94.7 89.4 89.4 100 84.3 90.6 90.6 PRED(100) 97.1 92.8 92.8 92.8 94.7 97.3 94.7 94.7 100 87.5 90.6 90.6 RMSE 14,922 24,136 29,322 29,317 872 747 1120 1204 22,126 35,689 43,351 43,341 MAE 6338 8940 8852 8830 690 484 882 942 13,181 18,981 18,317 18,196 SD 13,607 22,581 28,155 28,158 540 576 700 759 18,055 30,706 39,919 39,966
Fig.16.MAEsmalldataset.
Fig.17.MAElargedataset.
Fig.18.Regressionmaindataset.
Fig.19.Regressionsmalldataset.
Fig.20.Regressionlargedataset.
Fig.22.MLPsmalldataset.
Fig.23.MLPlargedataset.
thatthelog-linearregressionmodelsurpassestheMLPmodelas wellastheothermodels.Whenthesmalldatasetwasused,itis clearthat theMLPmodeloutperformsthelog-linearregression modelaswellastheothermodels.Thelargedatasetresultsshow thatthelog-linearregressionmodelisthebestmodelandthe per-formancesofallothermodelsdeterioratewhenlargeprojectsare usedforeffortestimation.
Figs. 12–14 depicttheintervalplots at 95%confidence level oftheMMERcriterion oftheregression, MLP,UCP and Schnei-der’smodelsforthethreeexperiments(main,smallandlarge).The centersoftheintervalscorrespondtotheMMERvalueofthe corre-spondingmodels.Modelswithlargerintervalplotswidthindicate
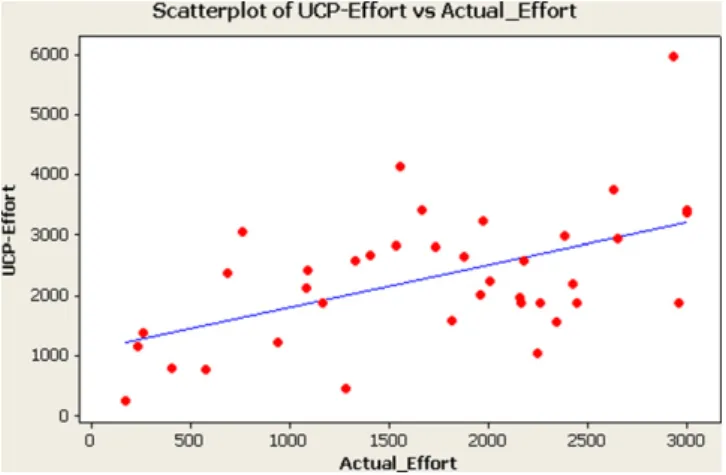
Fig.24.UCPmaindataset.
Fig.25.UCPsmalldataset.
Fig.26.UCPlargedataset.
thatthereisalargedifferencebetweentheminimumand maxi-mumvaluesoftheMMER.Thispointsoutthatmodelswithshorter intervalswidthandlowcenters(MMER)performbetter.Basedon thisanalysis,Figs.12and14showthatthelog-linearregression modeloutperformstheothermodels.Ontheotherhand,Fig.13
showsthattheMLPmodelexceedstheothermodels.
Similarly,based onFigs. 15and17,thelog-linearregression modelhasthebestresultsbasedontheMAEcriterion.However,
Fig.16showsthattheMLPmodeloutperformstheothermodels.
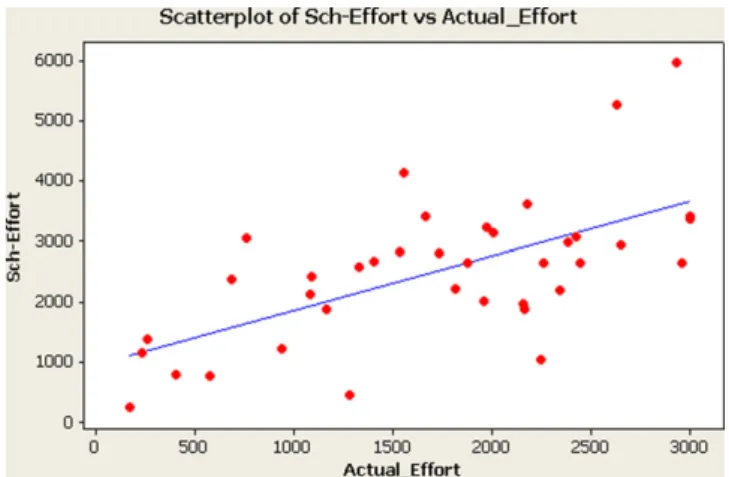
Figs.18–29showtherelationshipbetweentheactualeffort(x -axis)andthepredictedeffort(y-axis)ofeachofthefourmodels (regression,MLP,UCP andSchneider)ineach experiment(main
Fig.28.Schneidersmalldataset.
Fig.29.Schneiderlargedataset.
dataset,smalldatasetandlargedataset).Thestraightline repre-sentstheregressionlinewhich isthebeststraight linepassing through the points. In the ideal situation, when all points fall on the straight line, this indicates that the predicted effort is equaltotheactualeffortwhichisnotthecaseinreallife.Based on the main dataset (Figs. 18, 21, 24 and 27), the log-linear regression model shows that it hasthe best performance with respecttotheothermodels.However,basedonthesmalldataset (Figs. 19,22,25and 28),theMLPmodeloutperformstheother modelssincethepointsareclosertotheregressionline.Similarly, basedonthelargedataset(Figs.20,23,26and29),thelog-linear regressionmodelsurpassestheothermodels.
Asaconclusionfromtheevaluationresults,theMLPmodelgives promisingresultsforestimatingprojectsintheSmallDataset(less than3000person-hours).However,theMLPmodel didnot per-formwellwithlargeandalldatasets.Toconfirmtheseconclusions, astatisticaltestwasused.TheAnderson–Darling normalitytest wasappliedontheabsoluteresidualsandwefoundthatabsolute residualsofallmodelsarenotnormallydistributed.Forthisreason, weusedthenon-parametricMann–Whitneytestandtheresults arereportedin Table10.Results showthat,basedontheSmall
Table10
Mann–Whitneytestforabsoluteresiduals.
p-Value(small dataset) p-Value(large dataset) p-Value(all dataset) MLPvsUCP 0.0015 0.3172 0.1858 MLPvsSchneider 0.010 0.2738 0.1942 MLPvsregression 0.0373 0.5682 0.3826
Dataset,theMLPmodelis statisticallysignificantin comparison withtheregression,UCPandSchneider’smodelsatthe95% con-fidencelevel.TheMann–Whitneytestresultssupporttheresults obtainedinTable9.
Ontheotherhand,thelog-linearregressionmodelshouldbe usedforestimatingprojectsofsizelargerthan200UCP.Moreover, theoriginalUCPmodelbecomesinappropriatetoestimateprojects ofeffortsmorethan10,000person-hours.
5. Threatstovalidity
Threatstovaliditycanbesummarizedasfollows:
•The largest project used in the evaluation has an effort of 218,900person-hours. Theproposedlog-linear regression and MLPmodelsmightbeappropriatetoestimateprojectsthatare largerthan 218,900person-hours.Nevertheless,thelimitation oftheproposedmodelsissettotheestimationof projectsof maximumeffortof218,900person-hours.
•OneofthereasonsthattheMLPmodeldidnotperformwellwith largeprojectsisbecauseofthelackofmoreprojects.Thismodel wastrainedusing90projectsandtheperformanceofthismodel wouldbebetterifmoretrainingprojectswereused.
•Itwasdifficulttoelicittheenvironmentalfactors(Table4)from theteamthatisdevelopingsoftwareprojects.Forinstance, devel-opersmightbeoptimisticwhenansweringquestionsabouttheir experiences and motivations. Moreover, the motivation of a developer/programmermightdifferwhenplacedinadifferent team,eveninthesameproject.Furthermore,thereisno straight-forwardruletocalculatetheproductivityoftheteambasedon theproductivityofeachteammember.Inthiswork,theaverage ofallteammemberswasperformedtocalculatetheproductivity oftheteam.
•Because of the lack of industrial projects, some educational projectswereused.Educationalprojectsaremainlydeveloped bystudents whoworkwiththeseprojectsparttime.Projects developedbyinexperiencedstudentsmightincurerrorswhen theactualsoftwareeffortisestimated.
6. Conclusions
Thispaperfocusedonsoftwareeffortestimationfromtheuse casediagramsusingtheusecasepoint(UCP)model.IntheUCP model,theunadjustedsoftwaresize(UUCP)iscalculatedbasedon thenumberandcomplexityoftheusecasesaswellastheactors. Theadjustedusecasepointsize(UCP)isthencalculatedby mul-tiplyingtheUUCPbythetechnicalandenvironmentalfactors.The technicalfactorsrepresenttheprojectcomplexitywherethe envi-ronmentalfactorsrepresenttheteamproductivity.AftertheUCP sizeiscalculated, softwareeffortcanbeestimatedby multiply-ingtheUCPsizeby20.Therearetwomainshortcomingsinthe originalUCPmodel.ThefirstoneisthattheUCP model consid-erstherelationshipbetweensoftwaresizeandeffortislinear.This isincorrectbecausewhensoftwaresizeincreases,thenumberof teammembersrequiredtodevelopthissoftwareincreases.When theteambecomeslarger,communicationoverheadwillincurand thisrequiresadditionaleffort.Thisconcludesthatwhensoftware sizeincreases,softwareeffortwillincreaseexponentially.Another shortcomingisthattheinfluenceoftheteamproductivityisnot takenintoconsiderationwhile estimatingeffort.In thiswork,a novellog-linearregression modelwasproposedtotacklethese limitations.Amultiplelinearregressionmodelwasdevelopedto predictthevaluesoftheproductivityfactorusedintheproposed regressionmodel.Additionally,a Mamdanifuzzylogicapproach wasusedtoadjustthevaluesoftheproductivityfactor.
Anothercontributioninthispaperwastodevelopamultilayer perceptron(MLP)neuralnetworkmodel.Thismodeltakesthe soft-waresizeandtheteamproductivityrepresentedbyeightfactorsas inputs.Theoutputofthismodelisthesoftwareeffort.Theproposed log-linearregression and MLPmodelswere evaluatedusing 70 industrialandeducationalprojectsbasedonfivedifferentcriteria suchastheMMER,PRED,RMSE,MAEandSD.Acomparisonamong thelog-linearregressionmodel,theMLPmodelandtwoother mod-els(theUCPandSchneider’smodels)thatpredictsoftwareeffort fromusecasediagramswasconductedaccordingtothreedifferent experiments.Inthefirstexperiment,allavailabledatapoints(70 projects)thatwerenotpartofthetrainingdatapointswereusedfor evaluation.Inthesecondexperiment,38datapointsofeffortsless than3000person-hourswereusedforevaluation,whileinthethird experiment,32 datapointsof effortsgreater than3000 person-hourswereused toevaluatethemodels.Theresultsshowthat theproposedlog-linearregressionmodelsurpassesallthe mod-elsinthefirstand third experiments(all datapointsand large datapoints).Ontheotherhand,theMLPmodeloutperformsall othermodelsinthesecondexperiment(smalldatapoints)andthis hasbeenconfirmedusingthenon-parametricMann-WhitneyTest. ThishadledtotheconclusionthatanMLPmodelcanbeusedas analternativetorelevantregressionmodelstoestimateprojects ofeffortlessthan3000person-hours.Furthermore,theproposed log-linearregressionmodelcanbeusedwithpromisingresultsto estimatesoftwareeffortespeciallywithprojectsofeffortmorethan 3000person-hours.
The nextstep in this investigation will focus on improving theregressionandtheMLPmodelswhennewprojectsare avail-able. The environmental and the technical factors of the UCP modelshouldbe updated.Moreover,the UCP modelshouldbe reconstructedtohandle usecasesof more than7 transactions. Furthermore,theweightsoftheusecasesshouldbecalibrated.
References
Ahmed,M.A.,OmoladeSaliu,M.,AlGhamdi,J.,2005.Adaptivefuzzylogic-based frameworkforsoftwaredevelopmenteffortprediction.Informationand Soft-wareTechnology47,31–48.
Allison,P.D.,1984.EventHistoryAnalysis:RegressionforLongitudinalEventData. SagePublications.
Anda,B.,Dreiem,H.,Sjoberg,D.I.K.,Jorgensen,M.,2001.Estimatingsoftware devel-opmenteffortbasedonusecases-experiencesfromindustry.In:Proceedingsof the4thInternationalConferenceontheUnifiedModelingLanguage,Modeling Languages,Concepts,andTools,pp.487–502.
Andreou,A.S.,Papatheocharous,E.,2008.Softwarecostestimationusingfuzzy deci-siontrees.In:23rdIEEE/ACMInternationalConferenceonAutomatedSoftware Engineering(ASE2008),pp.371–374.
Anvik,J.,Murphy,G.C.,2011.Reducingtheeffortofbugreporttriage:recommenders fordevelopment-orienteddecisions.ACMTransactionsonSoftwareEngineering andMethodology20(August),10:1–10:35.
Arnold,M.,Pedross,P.,1998.Softwaresizemeasurementandproductivityrating inalarge-scalesoftwaredevelopmentdepartment.In:Proceedingsofthe20th InternationalConferenceonSoftwareEngineering,pp.490–493.
Attarzadeh,I.,Ow,S.H.,2011.Softwaredevelopmentcostandtimeforecastingusing ahighperformanceartificialneuralnetworkmodel.IntelligentComputingand InformationScience134,18–26.
Azzeh,M.,Neagu,D.,Cowling,P.,2010.Fuzzygreyrelationalanalysisforsoftware effortestimation.EmpiricalSoftwareEngineering15,60–90.
Azzeh,M.,Neagu,D.,Cowling,P.I.,2011.Analogy-basedsoftwareeffortestimation usingfuzzynumbers.JournalofSystemsandSoftware84,270–284. Blum,A.,1992.NeuralNetworksinC++:AnObject-OrientedFrameworkforBuilding
ConnectionistSystems.Wiley,NY.
Boehm,B.W.,1981.SoftwareEngineeringEconomics.Prentice-Hall.
Boehm,B.,Abts,C.,Chulani, S.,2000a.Software developmentcostestimation approaches:asurvey.AnnalsofSoftwareEngineering10,177–205.
Boehm,B.,Abts,C.,Brown,W.,Chulani,S.,2000b.SoftwareCostEstimationwith COCOMOII.AddisonWesley,UpperSaddleRiver,NJ.
Braz,M.R.,Vergilio,S.R.,2006.Softwareeffortestimationbasedonusecases.In: COMPSAC’06,pp.221–228.
Briand,L.C.,Wieczorek,I.,2002.Resourceestimationinsoftwareengineering. Ency-clopediaofSoftwareEngineering2,1160–1196.
Cameron,A.C.,Trivedi,P.K.,1998.RegressionAnalysisofCountData.Cambridge UniversityPress,Cambridge,UK.
deBarcelosTronto,I.F.,daSilva,J.D.S.,Sant’Anna,N.,2008.Aninvestigationof artifi-cialneuralnetworksbasedpredictionsystemsinsoftwareprojectmanagement. JournalofSystemsandSoftware81,356–367.
Demirors,O.,Gencel,C.,2004.Acomparisonofsizeestimationtechniquesapplied earlyinthelifecycle.SoftwareProcessImprovement3281,184–194. Diev,S.,2006.Usecasesmodelingandsoftwareestimation:applyingusecasepoints.
SIGSOFTSoftwareEngineeringNotes31,1–4.
D.Eck,B.Brundick,T.Fettig,J.Dechoretz,J.Ugljesa,ParametricEstimating Hand-book,TheInternationalSocietyofParametricAnalysis(ISPA),4thedn.,2009. Edwards,A.,1976.AnIntroductiontoLinearRegressionandCorrelation.W.H.
Free-manandCompany.
Foss,T.,Stensrud,E.,Kitchenham,B.,Myrtveit,I.,2003.Asimulationstudyofthe modelevaluationcriterionMMRE.IEEETransactionsonSoftwareEngineering 29(11),985–995.
Galorath,D.D.,Evans,M.W.,2006.SoftwareSizing,EstimationandRisk Manage-ment.AuerbachPublications,Boston,MA,USA.
Gauss,C.F.,TheoryoftheMotionoftheHeavenlyBodiesMovingabouttheSun inConicSections(Theoriamotuscorporumcoelestiuminsectionibusconicis solemambientum)(Firstpublishedin1809,TranslationbyC.H.Davis),Dover, NewYork,1963.
Heiat,A.,2002.Comparisonofartificialneuralnetworkandregressionmodelsfor estimatingsoftwaredevelopmenteffort.InformationandSoftwareTechnology 44,911–922.
Huang, S., Chiu, N., 2006. Optimizationof analogy weights by genetic algo-rithmforsoftwareeffortestimation.InformationandSoftwareTechnology48, 1034–1045.
Huang,X.,Ho,D.,Ren,J.,Capretz,L.F.,2007.ImprovingtheCOCOMOmodelusinga neuro-fuzzyapproach.AppliedSoftComputing7(1),29–40.
Humphrey,W.,1995.ADisciplineforSoftwareEngineering.AddisonWesley. Idri,A.,Abran,A.,2000.COCOMOcostmodelusingfuzzylogic.In:7thInternational
ConferenceonFuzzyTheoryandTechnology,pp.1–4.
Idri,A.,Zahi,A.,Mendes,E.,Zakrani,A.,2008.Softwarecostestimationmodelsusing radialbasisfunctionneuralnetworks.SoftwareProcessandProduct Measure-ment4895,21–31.
Idri,A.,Zakrani,A.,Zahi,A.,2010.Designofradialbasisfunctionneuralnetworks forsoftwareeffortestimation.InternationalJournalofComputerScienceIssues 7,11–17.
Jiang,Z.,Naudé,P.,Jiang,B.,2007.Theeffectsofsoftwaresizeondevelopmenteffort andsoftwarequality.InternationalJournalofComputerandInformationScience andEngineering1,230–234.
Jorgensen, M., 1995. Experience with the accuracy of software maintenance taskeffortpredictionmodels.IEEETransactionsonSoftwareEngineering21, 674–681.
Jørgensen,M.,2007.Forecastingofsoftwaredevelopmentworkeffort:evidenceon expertjudgementandformalmodels.InternationalJournalofForecasting23, 449–462.
Karner,G.,1993.Resourceestimationforobjectoryprojects.ObjectiveSystems. Kitchenham, B.A., Pickard, L.M., MacDonell, S.G., Shepperd, M.J., 2001. What
accuracystatisticsreallymeasure.IEEEProceedings-Software148(3(June)), 81–85.
Koirala,S.,2009.HowtoPrepareSoftwareQuotation.bpbpublications.
Kok,P.,Kitchenham,B.A.,Kirakowski,J.,1990.TheMERMAIDapproachtosoftware costestimation.EspritTechnicalWeek.
Kumar,K.,Ravi,V., Carr,M.,Kiran,N.,2008.Softwaredevelopmentcost esti-mationusingwaveletneuralnetworks.JournalofSystemsandSoftware81, 1853–1867.
Legendre,A.,1805.Nouvellesméthodespourladéterminationdesorbitesdes comètes.SurLaMéthodeDesMoindresQuarrés.
Lehmann,E.L.,1998.Nonparametrics:StatisticalMethodsBasedonRanks.Prentice Hall.
Li,Y.,Xie,M.,Goh,T.,2010.Adaptiveridgeregressionsystemforsoftwarecost estimatingonmulti-collineardatasets.JournalofSystemsandSoftware83, 2332–2343.
Linoff,G.S.,Berry,M.J.,2011.DataMiningTechniques:ForMarketing,Salesand CustomerRelationshipManagement.Wiley,NY.
Lippman,R.P.,1987.Anintroductiontocomputingwithneuralnets.IEEEASSP Magazine3(2),4–22.
Longstreet,D.,2008.Estimatingsoftwareeffort.SoftwareMetrics.
Lopez-Martín,C.,2011a.Afuzzylogicmodelforpredictingthedevelopmenteffort ofshortscaleprogramsbasedupontwoindependentvariables.AppliedSoft Computing11(1),724–732.
Lopez-Martín,C.,2011b.Applyingageneralregressionneuralnetworkforpredicting developmenteffortofshort-scaleprograms.NeuralComputing&Applications 20,389–401.
Lopez-Martín,C.,Isaza,C.,Chavoya,A.,2011.Softwaredevelopmenteffortprediction ofindustrialprojectsapplyingageneralregressionneuralnetwork.Empirical SoftwareEngineering17,1–19.
Lopez-Martín,C.,Yanez-Marquez,C.,Gutierrez-Tornes,A.,2008.Predictiveaccuracy comparisonoffuzzymodelsforsoftwaredevelopmenteffortofsmallprograms. JournalofSystemsandSoftware81,949–960.
J.Lynch.Chaosmanifesto.TheStandishGroup.Boston,2009[Online].Available from:http://www.standishgroup.com/newsroom/chaos2009.php.
Mamdani,E.H.,1977.Applicationoffuzzylogictoapproximatereasoningusing linguisticsynthesis.IEEETransactionsonComputersC-26,1182–1191. McConnell,S.,2006.SoftwareEstimation:DemystifyingtheBlackArt.Microsoft,