November 12, 2014
Small & Mid Cap coverage
Poland
Our Polish Small- & Mid-Caps coverage includes an overview of 58 names.
With this report we are initiating coverage of 30 stocks and maintaining
coverage of 28. Of the 30 newly covered stocks we are rating 21 as BUYs, 7
as HOLDs and 2 as SELLs. As for the already covered companies, we are
making changes to price targets/recommendations for three names only. We
are upgrading our target price and recommendation for Netia (Hold from
SELL, TP raised to PLN 5.71), reducing target price for ABC Data (down 2% to
PLN4, HOLD maintained) and re-initiating coverage of Work Service (Hold
rating, Target Price set at PLN19.5).
Companies covered in the note are significantly diversified in terms of sectors,
valuations and growth prospects. To make the research more user-friendly, pages
5-6 include a comparison of the stocks by valuation metrics (P/Es and
EV/EBITDAs), estimated mid-term EPS/revenue growth and finally past share
price performance.
Below we are listing the most expensive/cheap stocks as well as the names
offering the strongest/weakest growth prospects.
2015E P/E (x) 2015E EV/EBITDA (x) 10 Highest 10 Lowest 10 Highest 10 Lowest
BPH 108.2 BOS 9.8 MW Trade 38.8 Farmacol 5.9
Voxel 97.0 MW Trade 9.0 Medicalalgorithmics 24.9 Open Finance 5.4 Medicalalgorithmics 31.0 Action 8.9 Work Service 11.1 Tesgas 5.2
Netia 29.2 Ovostar 8.4 CD Projekt 11.0 ZAP 5.2
Atrem 26.5 Pozbud 8.3 DOM Development 10.2 Ovostar 5.1
Emperia 23.9 Paged 8.2 PRESCO 10.1 Hawe 4.6
Budimex 19.5 AB 7.7 Apator 9.9 Asseco SEE 4.5
Pekaes 18.3 ZEPAK 7.7 Synektik 9.9 Emperia 4.5
Synektik 18.0 ABC Data 6.7 Ronson 9.8 Netia 4.4
Work Service 17.5 Hawe 5.4 Forte 9.6 ZEPAK 4.3
Source: DM BZ WBK estimates
2014-2017 EPS CAGR (%) 2014-2017E EBITDA CAGR (%) 10 Highest 10 Lowest 10 Highest 10 Lowest
Bytom 64% Budimex -5.4% CD Projekt 41% Unibep 2.2%
Ciech 48% Hawe -5.8% Medicalalg. 40% Pozbud 0.6%
CD Projekt 44% Wielton -6.4% Bytom 32% ZAP 0.4%
Atrem 40% Wojas -6.9% Elemental 28% Budimex -3.5%
PCE 33% Farmacol -7.5% Work Service 25% PRESCO -3.7% Medicalalg. 33% Open Finance -7.5% PCE 22% Ovostar -3.7% Work Service 31% Monnari -12% Ronson 22% Open Finance -5.4%
ACE 29% Ovostar -13% Atrem 21% Netia -5.9%
Gino Rossi 24% Echo -15% Tesgas 21% Monnari -5.9%
Alumetal 21% PHN -29% Pekaes 20% Hawe -6.7%
Source: DM BZ WBK estimates
Research analysts:
Pawel Puchalski, CFA
+48 22 586 8095; [email protected] Dariusz Gorski +48 22 586 8100; [email protected] Tomasz Kasowicz +48 22 586 8155; [email protected] Adrian Kyrcz +48 22 586 8159; [email protected] Tomasz Sokolowski +48 22 586 8236; [email protected] Lukasz Kosiarski +48 22 586 8225; [email protected] Andrzej Bieniek
Securities broker, Investment advisor +48 22 586 8225; [email protected]
Michal Sopiel
+48 22 586 8233; [email protected]
Tomasz Kucinski
Contents
SMC Radar: A stock – picking tool ... 5
AB ... 7 ABC DATA ... 9 ACE ...11 ACTION ...15 ALUMETAL ...17 AMBRA ...21 AMICA ...25 APATOR ...29 ASSECO SEE ...33
ASSECO BUSINESS SOLUTIONS ...37
ATREM ...41 BANK BPH ...43 BENEFIT SYSTEMS ...47 BOS BANK ...49 BUDIMEX ...53 BYTOM ...55 CD PROJEKT ...59 CIECH ...61 DOM DEVELOPMENT ...63 ECHO INVESTMENT ...65 ELEMENTAL HOLDING...67 EMPERIA ...71 ERBUD ...73 EUCO ...77 FARMACOL ...79 FORTE ...81 GINO ROSSI ...85 GRAJEWO ...89 HAWE ...93 GRUPA KETY ...97 MEDICALGORITHMICS ...99 MIDAS ... 103 MONNARI ... 105 MW TRADE ... 109 NETIA ... 113 NEUCA ... 115 OPEN FINANCE ... 117 OVOSTAR UNION ... 119 PAGED ... 121
PRIME CAR MANAGMENT... 125
PEKAES ... 129 PELION ... 133 PHN ... 135 POZBUD ... 137 PRESCO ... 139 RONSON ... 143 SYNEKTIK ... 147 TESGAS ... 149 TRAKCJA ... 151 UNIBEP ... 153 VOTUM ... 157 VOXEL ... 161 WIELTON... 165 WOJAS ... 169 WORK SERVICE ... 173 ZA PULAWY ... 175 ZCH POLICE ... 177 ZE PAK ... 179
Fig. 1. BZ WBK coverage: Initiations of coverage
Company Recomemndation 12M Target Price
current previous change current previous chng. % upside %
ACE Buy n.a. - 16.50 n.a. n.a. 54%
Alumetal Buy n.a. - 52.40 n.a. n.a. 19%
Ambra Buy n.a. - 12.00 n.a. n.a. 36%
Amica Buy n.a. - 149.00 n.a. n.a. 37%
Apator Hold n.a. - 42.40 n.a. n.a. 12%
Asseco BS Buy n.a. - 10.30 n.a. n.a. 37%
Asseco SEE Buy n.a. - 16.40 n.a. n.a. 33%
Bank BPH Buy n.a. - 59.75 n.a. n.a. 15%
BOS Bank Buy n.a. - 49.10 n.a. n.a. 18%
Bytom Buy n.a. - 2.00 n.a. n.a. 43%
Elemental Holding Buy n.a. - 3.90 n.a. n.a. 35%
Erbud Hold n.a. - 29.60 n.a. n.a. 12%
Forte Buy n.a. - 67.60 n.a. n.a. 19%
Gino Rossi Buy n.a. - 4.00 n.a. n.a. 29%
Grajewo Buy n.a. - 35.50 n.a. n.a. 16%
HAWE Buy n.a. - 4.40 n.a. n.a. 75%
Medicalgorythmics Hold n.a. - 230.00 n.a. n.a. 13%
Monnari Buy n.a. - 13.50 n.a. n.a. 42%
MW Trade Buy n.a. - 21.60 n.a. n.a. 16%
Paged Buy n.a. - 67.00 n.a. n.a. 62%
PCM Buy n.a. - 59.70 n.a. n.a. 18%
Pekaes Buy n.a. - 10.57 n.a. n.a. 17%
Presco Sell n.a. - 3.10 n.a. n.a. -18%
Ronson Sell n.a. - 1.53 n.a. n.a. -10%
Unibep Buy n.a. - 9.20 n.a. n.a. 16%
Votum Buy n.a. - 9.90 n.a. n.a. 32%
Voxel Hold n.a. - 12.50 n.a. n.a. 11%
Wielton Hold n.a. - 6.00 n.a. n.a. 7%
Wojas Hold n.a. - 8.40 n.a. n.a. 5%
ZE PAK Hold n.a. - 31.90 n.a. n.a. 7%
Source: DM BZ WBK estimates
Fig. 2. BZ WBK coverage: Changes to valuations & recommendations
Company
Recomemndation
12M Target Price
current
previous
change
current previous
chng. % upside %
AB Buy Buy ► 43.00 43.00 0% 33%
ABC Data Hold Hold ► 4.00 4.10 -2% 4%
Action Buy Buy ► 69.70 69.70 0% 50%
Atrem Buy Buy ► 7.10 7.10 0% 45%
Benefit Systems Buy Buy ► 391.00 391.00 0% 30%
Budimex Hold Hold ► 153.00 153.00 0% 13%
CD Projekt Buy Buy ► 18.00 18.00 0% 8%
Ciech Buy Buy ► 51.40 51.40 0% 22%
Dom Development Hold Hold ► 45.10 45.10 0% 0%
Echo Investment Buy Buy ► 7.65 7.65 0% 18%
Emperia Buy Buy ► 81.00 81.00 0% 65%
EuCO Buy Buy ► 31.70 31.70 0% 20%
Farmacol Buy Buy ► 66.00 66.00 0% 31%
Kety Buy Buy ► 311.00 311.00 0% 12%
Midas Buy Buy ► 1.39 1.39 0% 132%
Netia Hold Sell ▲ 5.71 4.95 15% 3%
Neuca Buy Buy ► 376.00 376.00 0% 63%
Open Finance Buy Buy ► 7.00 7.00 0% 23%
Ovostar Hold Hold ► 75.00 75.00 0% 7%
Pelion Hold Hold ► 79.00 79.00 0% 5%
PHN Buy Buy ► 29.10 29.10 0% 15%
Pozbud Buy Buy ► 7.70 7.70 0% 71%
Synektik Buy Buy ► 32.50 32.50 0% 38%
Tesgas Buy Buy ► 7.40 7.40 0% 64%
Trakcja Buy Buy ► 1.22 1.22 0% 6%
Work Service Hold Restricted - 19.50 Restricted - 3%
ZA Pulawy Buy Buy ► 170.40 170.40 0% 17%
ZCH Police Sell Sell ► 11.60 11.60 0% -46%
SMC Radar: A stock – picking tool
Fig. 3. Small& Mid caps – Value Radar
2015E P/E (x) 2015E Net debt to Equity (x) 10 Highest 10 Lowest 10 Highest 10 Lowest
BPH 108.2 BOS 9.8 MW Trade 8.6 Asseco BS -0.2
Voxel 97.0 MW Trade 9.0 Midas 5.0 Bytom -0.2
Medicalalgorithmics 31.0 Action 8.9 PCM 1.4 Tesgas -0.3
Netia 29.2 Ovostar 8.4 Ciech 1.3 Benefit -0.3
Atrem 26.5 Pozbud 8.3 Echo 0.7 Votum -0.3
Emperia 23.9 Paged 8.2 Pelion 0.7 Medicalalgorithmics -0.3
Budimex 19.5 AB 7.7 ABC Data 0.6 Synektik -0.4
Pekaes 18.3 ZE Pak 7.7 Presco 0.6 CD Projekt -0.4
Synektik 18.0 ABC Data 6.7 Voxel 0.5 Monnari -0.5
Work Service 17.5 HAWE 5.4 Paged 0.5 Budimex -2.1
Source: DM BZ WBK estimates
2015E ROE (%) 2015E EV/EBITDA (x)
10 Highest 10 Lowest 10 Highest 10 Lowest
CD Projekt 45.3% ZE PAK 5.1% MW Trade 38.8 Farmacol 5.9
EuCO 36.1% Pekaes 4.9% Medicalalgorithmics 24.9 Open Finance 5.4
Budimex 33.2% Tesgas 4.4% Work Service 11.1 Tesgas 5.2
Bytom 32.0% Trakcja 4.4% CD Projekt 11.0 ZAP 5.2
Votum 31.8% Emperia 4.0% Dom Development 10.2 Ovostar 5.1
Benefit 29.2% Atrem 2.6% Presco 10.1 Hawe 4.6
Action 23.5% Netia 2.1% Apator 9.9 Asseco SEE 4.5
MW Trade 23.1% PHN 1.4% Synektik 9.9 Emperia 4.5
Medicalalgorithmics 22.9% Voxel 1.1% Ronson 9.8 Netia 4.4
Forte 22.0% BPH 0.7% Forte 9.6 ZE PAK 4.3
Source: DM BZ WBK estimates
2014-2017E EPS CAGR (%) 2015E Net margin (%)
10 Highest 10 Lowest 10 Highest 10 Lowest
Bytom 64.1% Budimex -5.4% Medicalalgorithmics 54.0% Erbud 1.7%
Ciech 47.6% Hawe -5.8% Echo 39.9% Neuca 1.7%
CD Projekt 44.3% Wielton -6.4% CD Projekt 30.7% Atrem 1.5%
Atrem 39.6% Wojas -6.9% Euco 24.2% Action 1.4%
Police 33.1% Farmacol -7.5% MW Trade 22.0% Emperia 1.4%
Medicalalgorithmics 32.7% Open Finance -7.5% Hawe 20.7% ABC Data 1.2%
Work Service 31.3% Monnari -11.6% Asseco BS 18.4% Voxel 1.1%
ACE 29.1% Ovostar -12.5% PHN 17.0% Pelion 1.1%
Gino Rossi 24.2% Echo -14.5% Ovostar 15.1% AB 1.0%
Alumetal 20.5% PHN -28.7% Apator 14.4% Midas 1.0%
Source: DM BZ WBK estimates
2014-2017E EBIT CAGR (%) 2014-2017E EBITDA CAGR (%)
10 Highest 10 Lowest 10 Highest 10 Lowest
Bytom 62.2% Pelion 0.4% CD Projekt 40.9% Unibep 2.2%
Ciech 47.6% Pozbud 0.2% Medicalalgorithmics 39.7% Pozbud 0.6%
CD Projekt 45.2% Wojas 0.1% Bytom 32.0% ZAP 0.4%
Tesgas 44.2% Presco -2.5% Elemental 28.1% Budimex -3.5%
Police 39.7% Budimex -4.1% Work Service 25.0% PRESCO -3.7%
Medicalalgorithmics 39.6% Echo -5.8% PCE 22.0% Ovostar -3.7%
Atrem 33.1% Monnari -8.3% Ronson 21.5% Open Finance -5.4%
Work Service 25.6% Ovostar -9.1% Atrem 20.8% Netia -5.9%
Alumetal 22.7% Hawe -10.0% Tesgas 20.8% Monnari -5.9%
Votum 22.3% Open Finance -12.4% Pekaes 20.1% Hawe -6.7%
2015E EBITDA Margin (%) 2014-2017E Revenues CAGR (%)
10 Highest 10 Lowest 10 Highest 10 Lowest
Echo 71.4% Atrem 4.0% Medicalalgorithmics 41.3% ACE 1.2%
Medicalalgorithmics 59.9% Erbud 3.3% Midas 40.0% ZAP 1.1%
CD Projekt 37.3% Unibep 3.2% Work Service 26.7% ZEPAK 0.6%
Hawe 31.3% Emperia 3.2% CD Projekt 22.0% Phn 0.5%
Asseco BS 29.4% Neuca 2.3% Tesgas 16.3% Ciech -1.5%
MW Trade 27.5% Action 2.0% Action 13.7% Hawe -2.4%
Netia 27.3% Pelion 2.0% Forte 13.2% Pozbud -2.6%
Euco 27.1% AB 1.6% MW Trade 11.6% PRESCO -3.1%
Presco 27.0% ABC Data 1.6% Bytom 11.4% Open Finance -3.1%
Ovostar 26.7% Midas -4.6% Votum 11.2% Netia -4.2%
Source: DM BZ WBK estimates
Fig. 4. Small& Mid caps – Momentum Radar
1M Market Performance (%) 3M Market Performance (%)
10 Highest 10 Lowest 10 Highest 10 Lowest
Voxel 24.3 ACE -1.9 Bank BPH 36.7 Voxel -3.9
Bank BPH 21.5 Police -2.7 Work Service 35.4 Ambra -4.2
Medicalgorithmics 13.0 Netia -2.8 PCM 34.1 ABC Data -4.8
Midas 11.3 Budimex -3.4 Grupa Kety 33.7 BOS Bank -4.9
Paged 11.0 Farmacol -4.3 Forte 28.3 ACE -6.2
Votum SA 11.0 ZE PAK -4.9 Elemental Holding 26.1 Wojas -6.4
Prime Car Management 10.0 Ambra -5.3 Alumetal 25.3 Wielton -6.5
Benefit Systems 8.2 Presco Group -11.9 PHN 24.5 Emperia Holding -13.4
Alumetal 8.1 Open Finance -12.5 Paged 24.3 Hawe -17.4
Ovostar 8.0 Wielton -12.6 Amica Wronki 23.5 Open Finance -17.7
Source: DM BZ WBK estimates
1Y Market Performance (%) YTD Market Performance (%)
10 Highest 10 Lowest 10 Highest 10 Lowest
Forte 69.1 Ambra -25.5 Euco 79.9 Farmacol -26.6
Medicalgorithmics 66.4 Ovostar -27.5 Work Service 49.6 Pelion -27.3
Work Service 58.7 Farmacol -27.6 Monnari Trade 48.9 Ovostar -27.5
Euco 57.6 Pelion -28.9 Forte 44.9 Hawe -30.1
Kety 50.9 Emperia -30.7 Paged 35.9 Atrem -31.1
Paged 46.9 Atrem -30.9 Ciech 34.6 ACE -32.5
Votum 42.3 Voxel -34.5 Kety 33.4 Voxel -32.5
Ciech 41.2 Hawe -40.5 Wojas 26.1 Emperia -35.4
Monnari Trade 33.2 Presco -49.0 Votum 25.8 Presco -42.3
Synektik 30.5 Open Finance -71.1 Tesgas 24.3 Open Finance -69.4
Poland
IT Distribution
N
OVEMBER12,
2014
AB
B
UY
(M
R
ECOMMENDATION
AINTAINED
)
Negative earnings dynamics
T
ARGETP
RICEC
URRENT:
PLN43.0
P
RICE(M
AINTAINED:
PLN32.4
)
1Q14/15 Results Preview.
We expect that AB continued
its top-line improvement in 1Q14/15, although its earning
may prove to be a small disappointment. We expect that in
the Czech Republic and Slovakia AB kept its strong
dynamics, driven by the distribution agreement with Apple.
In Poland, we expect a 4% y/y sales expansion. We expect
the gross margin at 3.95% vs. 3.90% in 1Q13/14. We also
forecast a visible increase in SG&A costs - PLN40.1mn vs.
PLN29.5mn in 1Q13/14 (SG&A/sales ratio at 2.81%). We
assume revenues of PLN1.43bn (+13.7% y/y), an EBITDA
of PLN19.4mn. The net profit should settle at PLN10.7mn
(net margin at 0.75%).
Outcome: NEGATIVE.
Recent developments.
The company mulls paying a
dividend and a launch of a buyback tender offer. The
company has recently completed a PLN100mn 2019 bond
issue priced Wibor6M + 1.6%.
Outlook.
During its last results’ presentation, AB said that
it saw signs of market improvement in the Czech Republic,
mainly in the enterprise sector but also in the public sector.
Change in Forecasts.
We apply no changes to our model.
Change in Valuation & Recommendation.
We keep our
12-month Target Price for AB at PLN43.0 and maintain our
Buy rating for the stock. The comparative valuation points
to PLN29.2 per share
STOCK PERFORMANCE ABE TP WIG Relative 10 15 20 25 30 35 40 45 Oc t-1 1 Ja n -1 2 A p r-1 2 Ju l-1 2 Oc t-1 2 Ja n -1 3 A p r-1 3 Ju l-1 3 Oc t-1 3 Ja n -1 4 A p r-1 4 Ju l-1 4 Oc t-1 4Buy Hold Sell Under Review / Suspended
The chart measures performance against the WIG index. On 11/05/2014, the WIG index closed at 53,591.
LAST RECOMMENDATIONS
Rec. Date Price Price performance on issue
date 12 month target absolute relative (p.p)
Buy 10-23-2014 31.2 43.0 3.7% 3.2 Buy 7-9-2014 29.9 39.0 4.5% -0.6 Hold 4-28-2014 29.1 35.0 2.7% 4.4 Hold 1-30-2014 33.7 35.0 -13.6% -15.9 MAIN SHAREHOLDERS % of votes Mr. Andrzej Przybylo 15.0%
ING pension fund 13.1%
Mrs. Iwona Przybylo 10.0%
Allianz pension fund 9.1%
Aviva mutual fund 5.7%
COMPANY DESCRIPTION
One of the largest IT distribution company in Poland and Czech Republic. ANALYST Lukasz Kosiarski (+48) 22 586 82 25 [email protected] Company Data
PLNm 2013/14E 2014/15E 2015/16E 2016/17E Reuters/Bloomberg codes ABEP.WA / ABE PW
Sales 5,758 6,092 6,339 6,596 Market capitalisation (PLNm) 524
EBITDA 96.0 100.0 104.1 108.4 Number of shares (m) 16.2
EBIT 85.3 87.4 90.7 94.6 Free float (%) 79.1%
Net income 57.3 60.6 62.0 64.1 Avg. daily turnover 3M (PLNm) 0.2
P/E (x) 8.4 7.9 7.7 7.5
Price performance 1M 3M YTD
EV/EBITDA (x) 8.6 8.3 8.0 7.6 5.5% 22.3% -0.3%
Source: Company data, DM BZ WBK estimates
PLN in millions, unless otherwise stated 1Q11/12 2Q11/12 3Q11/12 4Q11/12 1Q12/13 2Q12/13 3Q12/13 4Q12/13 1Q13/14 2Q13/14 3Q13/14 4Q13/14 1Q14/15E y/y q/q Sales 944 1,429 1,001 963 1,123 1,730 1,355 1,306 1,256 1,637 1,348 1,517 1,428 13.7% -5.9% EBITDA 24.2 36.7 13.8 16.9 14.3 28.4 15.2 16.2 20.6 33.5 18.8 23.1 19.4 -5.8% -15.7% EBITDA margin 2.6% 2.6% 1.4% 1.8% 1.3% 1.6% 1.1% 1.2% 1.6% 2.0% 1.4% 1.5% 1.4% -0.3 -0.2 EBIT 21.8 34.0 11.6 14.1 11.9 25.8 12.6 13.8 18.2 31.0 16.3 19.9 16.2 -10.7% -18.4% EBIT margin 2.3% 2.4% 1.2% 1.5% 1.1% 1.5% 0.9% 1.1% 1.4% 1.9% 1.2% 1.3% 1.1% -0.3 -0.2 Net profit 10.1 21.6 8.3 7.9 9.3 16.8 6.2 9.5 13.1 21.2 10.6 12.4 10.7 -17.8% -13.6% Net margin 1.1% 1.5% 0.8% 0.8% 0.8% 1.0% 0.5% 0.7% 1.0% 1.3% 0.8% 0.8% 0.8% -0.3 -0.1 Source: Company data, DM BZ WBK estimates
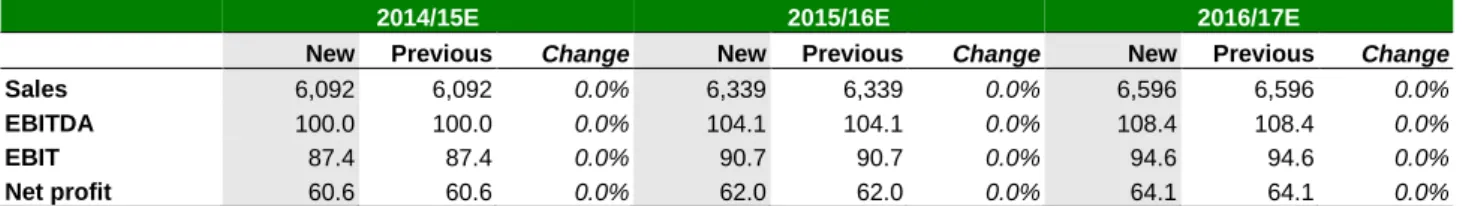
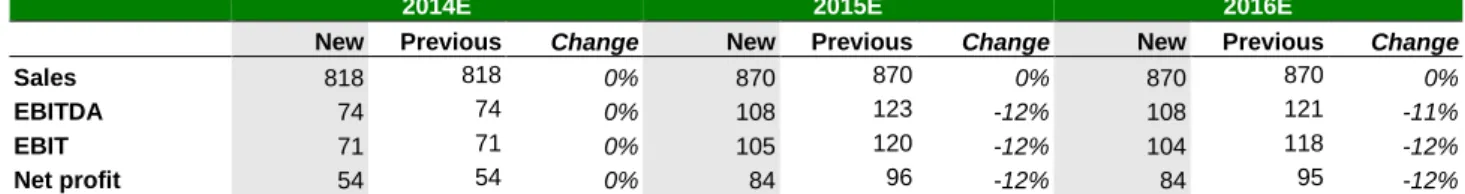
Fig. 2. AB: Forecasts changes
PLN in millions, unless otherwise stated
2014/15E 2015/16E 2016/17E
New Previous Change New Previous Change New Previous Change
Sales 6,092 6,092 0.0% 6,339 6,339 0.0% 6,596 6,596 0.0%
EBITDA 100.0 100.0 0.0% 104.1 104.1 0.0% 108.4 108.4 0.0%
EBIT 87.4 87.4 0.0% 90.7 90.7 0.0% 94.6 94.6 0.0%
Net profit 60.6 60.6 0.0% 62.0 62.0 0.0% 64.1 64.1 0.0%
Source: Company data, DM BZ WBK estimates
Fig. 3. AB: Valuation changes
In PLN per share, unless otherwise stated
New Previous Change
DCF valuation 43.0 43.0 0.0%
Comparable valuation (based on 2013/14-2015/16E) 29.2 29.2 0.0%
Source: Company data, DM BZ WBK estimates
Fig. 4. AB: Income statement forecast
PLN in millions, unless otherwise stated
2012/13 2013/14 2014/15E 2015/16E 2016/17E
Net sales 5,430 5,758 6,092 6,339 6,596
COGS 5,220 5,484 5,839 6,075 6,322
Gross profit 210.0 273.7 252.9 263.5 274.5
SG&A 139.3 161.2 165.5 172.8 179.9
Other operating income, net -6.6 -27.2 0.0 0.0 0.0
EBITDA 74.2 96.0 100.0 104.1 108.4
Operating profit 64.2 85.3 87.4 90.7 94.6
Net financial income (costs) -12.2 -11.7 -12.7 -14.2 -15.5
Profit before tax 52.0 73.7 74.8 76.5 79.1
Income tax 10.3 16.4 14.2 14.5 15.0 Net profit 41.7 57.3 60.6 62.0 64.1 Gross margin 3.9% 4.8% 4.2% 4.2% 4.2% EBITDA margin 1.4% 1.7% 1.6% 1.6% 1.6% Operating margin 1.2% 1.5% 1.4% 1.4% 1.4% Net profit margin 0.8% 1.0% 1.0% 1.0% 1.0% Source: Company data, DM BZ WBK estimates
Fig. 5. AB: Balance sheet forecast
PLN in millions, unless otherwise stated
2012/13 2013/14 2014/15E 2015/16E 2016/17E
Current assets 1,002 1,091 1,213 1,306 1,393 Fixed assets 166 168 185 179 173 Total assets 1,167 1,260 1,398 1,485 1,565 Current liabilities 741 791 868 893 921 bank debt 211 195 195 195 195 Long-term liabilities 5 5 5 6 6 bank debt 0 0 0 0 0 Equity 421 464 524 586 638 share capital 16 16 16 16 16 Minority Interest 0 0 0 0 0 Total liabilities 1,167 1,260 1,398 1,485 1,565 Net debt 199 149 161 160 125
Source: Company data, DM BZ WBK estimates
Fig. 6. AB: Cash flow forecast
PLN in millions, unless otherwise stated
2012/13 2013/14 2014/15E 2015/16E 2016/17E
CF from operations 0.9 77.8 16.3 8.5 54.9
CF from investment -4.9 -13.4 -29.3 -7.4 -7.2
CF from financing 0.0 26.4 0.0 0.0 -12.4
Net change in cash -4.0 90.8 -13.0 1.1 35.3
Poland
IT Distribution
N
OVEMBER12,
2014
ABC
D
ATA
H
OLD
(M
R
ECOMMENDATION
AINTAINED
)
Least preferred IT distributor
T
ARGETP
RICE:
PLN4.00
C
URRENT(P
P
RICEREV.
:
PLN4.10)
PLN3.83
3Q14 Results Review.
ABC Data reported 3Q14 results
way below expectations due to PLN10mn impairment on
receivables;
adjusted
results
came
in
line
with
expectations. Revenues expended 13% y/y to PLN1.37bn,
matched expectations (PLN1.35-1.40bn); revenues from
Polish market increased by 15% y/y to PLN703mn (we
expected a 5% growth), sales in EU countries came flat y/y
at PLN506mn (huge disappointment, we expected +20%
y/y), while export sales outside EU increased by 69% y/y to
PLN166mn. Gross margin stood at 4.79% vs. 4.46% in
3Q13 and 5.11% in 2Q14. Our assumption was 4.70%.
SG&A came at PLN56.8mn vs. PLN36.4mn in 3Q13. Sales
costs include PLN10mn one-off costs of impairment on
receivables. SG&A to sales ratio stood at 4.13% vs. 3.01%
in 3Q13. EBIT came at PLN7.5mn (-59% y/y), adjusted
EBIT came at PLN17.5mn vs. expectations of PLN19.2mn
(market) and PLN18.2mn (BZ WBK). Net earnings came at
PLN2.0mn, tax rate in 3Q14 at 54.7%. Operating CF in
3Q14 stood at PLN30.8mn.
2014 guidance.
Company slashed its FY14 official
guidance: new forecast is sales at PLN5.54bn (vs.
PLN5.76bn), EBITDA at PLN74.8mn (vs. PLN92.1mn).
New FY14 guidance implies 4Q14 sales at PLN1.61bn and
EBITDA at PLN31.6mn.
Recent developments.
Mrs. Ilona Weiss, deputy CEO, will
replace Mr. Norbert Biedrzycki as CEO on 1 January,
2015.
Change in Forecasts.
We have applied some changes to
our model following 3Q14 results release.
Change in Valuation & Recommendation.
We cut our
12-month Target Price for ABC Data at PLN4.00 and
maintain our Hold rating for the stock. The comparative
valuation points to PLN3.76 per share
STOCK PERFORMANCE ABC TP WIG Relative 0 1 1 2 2 3 3 4 4 5 5 Oc t-1 1 Ja n -1 2 A p r-1 2 Ju l-1 2 Oc t-1 2 Ja n -1 3 A p r-1 3 Ju l-1 3 O c t-1 3 Ja n -1 4 A p r-1 4 Ju l-1 4 O c t-1 4
Buy Hold Sell Under Review / Suspended
The chart measures performance against the WIG index. On 11/05/2014, the WIG index closed at 53,591.
LAST RECOMMENDATIONS
Rec. Date Price Price performance on issue
date 12 month target absolute relative (p.p)
Hold 10-23-2014 3.6 4.1 5.2% 4.7 Sell 7-9-2014 4.3 4.0 -14.4% -19.5 Sell 4-28-2014 3.9 3.9 8.1% 9.8 Sell 1-30-2014 4.1 3.9 -5.1% -7.4 MAIN SHAREHOLDERS % of votes ABCD Management 41.0%
MCI Venture Projects 20.5%
PZU pension fund 9.3%
Aviva pension fund 7.0%
BZ WBK Asset Management 5.0%
COMPANY DESCRIPTION
One of the largest IT distribution company in Poland.
ANALYST Lukasz Kosiarski
(+48) 22 586 82 25
Company Data
PLNm 2013 2014E 2015E 2016E Reuters/Bloomberg codes ABCP.WA / ABC PW
Sales 4,822 5,623 5,924 6,267 Market capitalisation (PLNm) 480
EBITDA 79.6 72.4 96.5 101.6 Number of shares (m) 125.3
EBIT 77.2 70.2 93.8 98.8 Free float (%) 37.2%
Net income 59.2 39.3 67.5 71.1 Avg. daily turnover 3M (PLNm) 0.2
P/E (x) 7.7 11.6 6.7 6.4
Price performance 1M 3M YTD
EV/EBITDA (x) 9.2 11.4 8.5 8.1 -1.8% -4.5% -10.9%
Source: Company data, DM BZ WBK estimates
PLN in millions, unless otherwise stated 3Q11 4Q11 1Q12 2Q12 3Q12 4Q12 1Q13 2Q13 3Q13 4Q13 1Q14 2Q14 3Q14 y/y q/q Sales 752 1,304 760 742 892 1,300 1,089 1,096 1,212 1,425 1,169 1,391 1,375 13.4% -1.1% EBITDA 11.7 19.3 13.2 8.0 9.5 28.1 16.9 14.9 19.5 28.3 12.7 22.5 8.0 -58.9% -64.3% EBITDA margin 1.6% 1.5% 1.7% 1.1% 1.1% 2.2% 1.5% 1.4% 1.6% 2.0% 1.1% 1.6% 0.6% -1.0 -1.0 EBIT 10.4 18.3 12.3 7.3 8.7 27.3 16.3 14.4 18.9 27.6 12.2 21.9 7.5 -60.5% -65.9% EBIT margin 1.4% 1.4% 1.6% 1.0% 1.0% 2.1% 1.5% 1.3% 1.6% 1.9% 1.0% 1.6% 0.5% -1.0 -1.0 Net profit 6.4 29.5 6.4 0.2 5.0 19.5 11.0 14.3 14.2 19.7 6.8 11.2 2.0 -86.0% -82.2% Net margin 0.9% 2.3% 0.8% 0.0% 0.6% 1.5% 1.0% 1.3% 1.2% 1.4% 0.6% 0.8% 0.1% -1.0 -0.7 Source: Company data, DM BZ WBK estimates
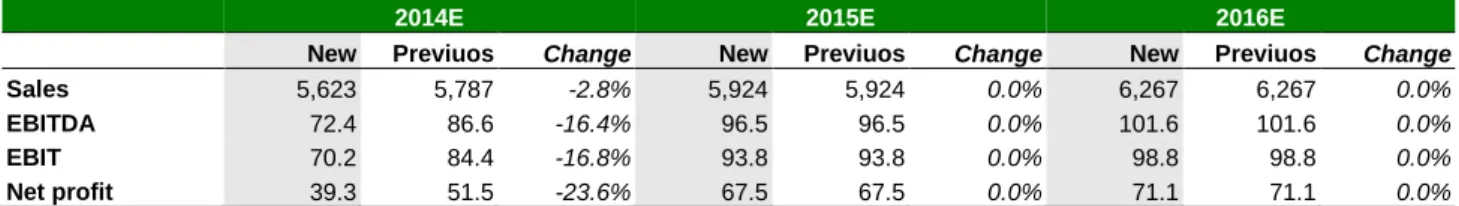
Fig. 2. ABC Data: Forecasts changes
PLN in millions, unless otherwise stated
2014E 2015E 2016E
New Previuos Change New Previuos Change New Previuos Change
Sales 5,623 5,787 -2.8% 5,924 5,924 0.0% 6,267 6,267 0.0%
EBITDA 72.4 86.6 -16.4% 96.5 96.5 0.0% 101.6 101.6 0.0%
EBIT 70.2 84.4 -16.8% 93.8 93.8 0.0% 98.8 98.8 0.0%
Net profit 39.3 51.5 -23.6% 67.5 67.5 0.0% 71.1 71.1 0.0%
Source: Company data, DM BZ WBK estimates
Fig. 3. ABC Data: Valuation changes
In PLN per share, unless otherwise stated
New Previous Change
DCF valuation 4.00 4.10 -2.4%
Comparable valuation (based on 2014-2016E) 3.76 3.76 0.0%
Source: Company data, DM BZ WBK estimates
Fig. 4. ABC Data: Income statement forecast
PLN in millions, unless otherwise stated
2012 2013 2014E 2015E 2016E
Net sales 3,693 4,822 5,623 5,924 6,267
COGS 3,509 4,596 5,358 5,650 5,977
Gross profit 183.8 226.5 265.9 273.9 289.5
SG&A 132.8 151.0 198.2 180.1 190.7
Other operating income, net 4.6 1.7 2.4 0.0 0.0
EBITDA 58.8 79.6 72.4 96.5 101.6
Operating profit 55.6 77.2 70.2 93.8 98.8
Net financial income (costs) -11.4 -9.1 -11.6 -10.5 -11.2
Profit before tax 44.2 68.0 58.6 83.3 87.6
Income tax 9.0 8.9 19.3 15.8 16.6 Net profit 31.1 59.2 39.3 67.5 71.1 Gross margin 5.0% 4.7% 4.7% 4.6% 4.6% EBITDA margin 1.6% 1.6% 1.3% 1.6% 1.6% Operating margin 1.5% 1.6% 1.2% 1.6% 1.6% Net profit margin 0.8% 1.2% 0.7% 1.1% 1.1% Source: Company data, DM BZ WBK estimates
Fig. 5. ABC Data: Balance sheet forecast
PLN in millions, unless otherwise stated
2012 2013 2014E 2015E 2016E
Current assets 824 842 995 1,065 1,152 Fixed assets 73 75 81 85 87 Total assets 896 917 1,076 1,151 1,239 Current liabilities 587 600 765 817 875 bank debt 112 141 230 253 278 Long-term liabilities 21 1 1 1 1 bank debt 20 0 0 0 0 Equity 288 316 310 332 363 share capital 125 125 125 125 125 Minority Interest 0 0 0 0 0 Total liabilities 896 917 1,076 1,151 1,239 Net debt 118 124 220 228 231
Source: Company data, DM BZ WBK estimates
Fig. 6. ABC Data: Cash flow forecast
PLN in millions, unless otherwise stated
2012 2013 2014E 2015E 2016E
CF from operations 73.7 30.1 -42.4 43.8 43.1
CF from investment -1.8 -4.0 -8.3 -7.3 -4.8
CF from financing -67.6 -22.7 44.1 -22.1 -15.2
Net change in cash 4.3 3.3 -6.7 14.4 23.1
Poland
Automotive
N
OVEMBER12,
2014
ACE
B
UY
R
(I
ECOMMENDATION
NITIATION
)
A highly probable rise in earnings
C
URRENTP
RICE:
PLN10.7
T
ARGETP
RICE:
PLN16.5
Equity Story. We are initiating our coverage of ACE, a leadingsupplier of disc brake system components in Europe, with a Buy recommendation and a target price of PLN16.5 per share (54% upside!). We expect the company to improve its profitability in the coming years due to efficiency improvements in Fuchosa (Spain), implementation and utilisation of nodular iron technology in Feramo (Czech Rep.) and new aluminium projects in EBCC (Poland). That said, we expect the gross margin to rise on improving sales in 2015E and 2016E, by 1.5pp and by 0.5pp to 23.5% and 24%, respectively. We thus expect company to show substantial net profit dynamics in years ahead. Given ACE’s strong cash generation nature we see the company as attractive from dividend pay-outs point of view.
Automotive market outlook. According to PWC, Autofactspassenger and light-commercial vehicle production (key driver for ACE volumes) should grow y/y by 5.4% in EU in 2014, though fall by 0.3% in the CEE region. For 2015 and beyond, PWC expects the European automotive market to continue to grow, albeit at a slower pace (2013-2018 CAGR at 3.4%).
Financials. We forecast ACE revenues in 2014E at EUR98.1mn(-3% y/y), while in 2015E company’s sales should go up to EUR101.1mn (+3% y/y). For 2016E We expect ACE revenues to grow 5% y/y (above the market CAGR for 2013-2018), when the company should be fully utilising its new capacities and projects. EBIT is expected to rise to EUR4.9mn (+10% y/y) in 2014E, to EUR5.8mn (+19% y/y) in 2015E and to EUR7.1mn (+21% y/y) in 2016E. That said, the net profit margin should rise to 4.1% (2015E) and 4.9% (2016E) from 2.8% in 2014E.
Risks/triggers. The deepening slowdown in the European economycould hit sales of passenger cars and LCV sales and this is the key risk that we see for ACE’s business. Among other risks, the delay in obtaining homologation for its products could also harm the pace of the company’s earnings growth in the future years.
Valuation & recommendation. Based on our DCF model, we arrivedat a 12 month TP of PLN16.5 per share, which implies a 54% upside potential. We thus initiate our coverage of ACE with a Buy recommendation.
STOCK PERFORMANCE
The chart measures performance against the WIG index. On 11/05/2014, the WIG index closed at 53,591.
LAST RECOMMENDATIONS
Rec. Date Price Price performance on issue
date 12 month target absolute relative (p.p)
n/a n/a n/a n/a n/a n/a
COMPANY DESCRIPTION
The ACE group (casting company) is a leading supplier of disc brake system components to the production-focused European automotive industry (Tier 2). The company’s main products are: iron anchors and aluminum calipers. The company’s production is based in three plants in Spain (Fuchosa), Poland (EBCC) and the Czech Republic (Feramo).
Main shareholders % of votes
Casting brake (Spain) 11.45%
PZU pension fund 15.91%
Aviva pension fund 14.70%
ING pension fund 14.13%
ANALYST Tomasz Kasowicz
(+48) 22 586 81 55
Company Data
EURmn 2013 2014E 2015E 2016E Reuters/Bloomberg codes ACEP.WA / ACE PW
Sales 100.8 98.1 101.2 106.5 Market capitalisation (PLNm) 230.1
EBITDA 10.4 10.4 11.3 12.6 Number of shares (m) 21.2
EBIT 4.5 4.9 5.8 7.1 Free float (%) 82.7%
Net income 1.9 2.7 4.1 5.2 Avg. daily turnover 3M (PLNm) 0.1
P/E (x) 28.1 20.1 13.2 10.4
Price performance 1M 3M YTD
EV/EBITDA (x) 6.6 6.6 6.1 5.5 -4.5% -9.7% -33.9%
Fig. 1. ACE: DCF valuation
EUR in millions, unless otherwise stated
DCF valuation 2015E 2016E 2017E 2018E 2019E 2020E 2021E 2022E 2023E 2024E beyond
EBIT 5.8 7.1 7.1 7.1 7.1 7.1 7.1 7.1 7.1 7.1 7.1 Tax rate 19% 19% 19% 19% 19% 19% 19% 19% 19% 19% 19% Taxes on EBIT -1.1 -1.3 -1.3 -1.3 -1.3 -1.3 -1.3 -1.3 -1.3 -1.3 -1.3 NOPLAT 4.7 5.7 5.7 5.7 5.7 5.7 5.7 5.7 5.7 5.7 5.7 Depreciation 5.5 5.5 5.5 5.5 5.5 5.5 5.5 5.5 5.5 5.5 5.5 Capital expenditures 4.5 4.5 4.5 4.5 4.5 4.5 4.5 4.5 4.5 4.5 5.5
Change in working capital 0.4 0.5 0.0 0.0 0.0 0.0 0.0 0.0 0.0 0.0 0.0
Free cash flow 5.4 6.2 6.7 6.7 6.7 6.7 6.7 6.7 6.7 6.7 5.7
Terminal growth rate 1.0%
Terminal value 93.7
Discount factor 0.93 0.87 0.81 0.76 0.71 0.66 0.62 0.58 0.54 0.50 0.47 Discounted free cash flow at 31.12.2014 5.0 5.4 5.5 5.1 4.8 4.4 4.1 3.9 3.6 3.4 47.1
Enterprise value 92.3
Net debt at 31.12.2014 14.3
Minorities 0.0
Proceeds from non-core assets 0.0
Fair value at 31.12.2014 78.0
Number of shares 21.2
Fair value per share at 31.12.2014 3.7
Cost of equity 9.0%
12M Target Price in EUR 4.0
EUR/PLN rate 4.2
12M Target Price in PLN 16.5
Curren value per share 10.7
Up/downside 54.3%
PV FCF/PV TV 49%
2015E P/E @ TP (x) 20.4
2015E EV/EBITDA @ TP (x) 8.7
Source: Company data, BZ WBK Brokerage
Fig. 2. ACE: Comparable valuation
P/E EV/EBITDA
2014E 2015E 2016E 2014E 2015E 2016E
BREMBO SPA 14.5 12.9 11.7 6.6 5.9 5.4 ELRINGKLINGER AG 15.0 13.2 11.7 6.7 6.1 5.6 FISCHER (GEORG)-REG 11.9 10.2 9.5 5.6 5.1 4.8 SOGEFI 15.3 8.5 6.9 2.1 1.7 1.5 VALEO SA 12.7 10.9 9.6 5.0 4.4 4.0 LE BELIER 8.8 7.7 6.8 4.4 3.8 3.4
TRW AUTOMOTIVE HOLDINGS CORP 13.2 12.0 11.0 6.2 5.7 5.2
POLYTEC HOLDING AG 9.8 7.9 6.9 4.0 3.2 2.9
AKEBONO BRAKE INDUSTRY CO 22.6 15.7 9.8 n/a 2.8 2.3
CIE AUTOMOTIVE SA 18.2 12.4 10.6 4.9 4.1 3.7
NISSIN KOGYO CO LTD 10.2 10.0 8.8 4.3 4.0 3.6
Median international peers 13.2 10.9 9.6 4.9 4.1 3.7
ACE 20.1 13.2 10.4 6.6 6.1 5.5
Premium/discount 53% 21% 8% 34% 49% 48%
Implied value (in PLN per share) 7.0 8.8 9.9 10.0 9.1 9.1
Fig. 3. ACE: 3Q14 results preview
EUR in millions, unless otherwise stated
3Q11 4Q11 1Q12 2Q12 3Q12 4Q12 1Q13 2Q13 3Q13 4Q13 1Q14 2Q14 3Q14E y/y q/q Sales 22.8 25.3 27.2 26.0 23.1 22.3 26.1 26.7 24.1 24.0 26.6 25.5 22.8 -5.3% -10.5% EBITDA 2.5 2.7 2.1 2.5 1.7 1.9 2.0 2.8 2.2 3.4 3.1 2.7 2.3 3.7% -15.5% EBITDA margin 11% 11% 8% 10% 7% 9% 8% 11% 9% 14% 11% 10% 10% 0.9 -0.6 EBIT 1.1 1.1 0.8 1.3 0.6 0.4 0.8 1.6 0.9 1.2 1.7 1.3 0.9 -2.3% -35.0% EBIT margin 5% 4% 3% 5% 3% 2% 3% 6% 4% 5% 7% 5% 4% 0.1 -1.4 Net profit -0.1 0.5 0.8 0.3 0.7 0.6 0.2 0.7 0.6 0.5 1.0 0.6 0.5 -8.1% -6.7% Net margin -1% 2% 3% 1% 3% 3% 1% 2% 2% 2% 4% 2% 2% -0.1 0.1 Source: Company data, BZ WBK Brokerage
Fig. 4. ACE: Forecast changes
EUR in millions, unless otherwise stated
2014E 2015E 2016E
New Previous Change New Previous Change New Previous Change
Sales 98.1 n/a n/a 101.2 n/a n/a 106.5 n/a n/a
EBITDA 10.4 n/a n/a 11.3 n/a n/a 12.6 n/a n/a
EBIT 4.9 n/a n/a 5.8 n/a n/a 7.1 n/a n/a
Net profit 2.7 n/a n/a 4.1 n/a n/a 5.2 n/a n/a
Source: Company data, BZ WBK Brokerage
Fig. 5. ACE: Valuation changes
In PLN per share, unless otherwise stated
New Previous Change Weight
DCF valuation 16.5 n/a n/a 100%
Comparable valuation (based on 2014-2016E) 9.0 n/a n/a 0%
Source: Company data, BZ WBK Brokerage
Fig. 6. ACE: Income statement forecast
EUR in millions, unless otherwise stated
2012 2013 2014E 2015E 2016E
Net sales 98.6 100.8 98.1 101.2 106.5
COGS -81.6 -81.4 -76.1 -77.4 -81.2
Gross profit 17.0 19.5 22.0 23.8 25.3
SG&A -15.4 -15.8 -17.7 -18.0 -18.2
Other operating income, net 1.5 0.8 0.6 0.0 0.0
EBITDA 8.3 10.4 10.4 11.3 12.6
Operating profit 3.1 4.5 4.9 5.8 7.1
Net financial income (costs) -0.4 -1.1 -0.8 -0.8 -0.6
Profit before tax 2.7 3.3 4.1 5.1 6.5
Income tax -0.3 -1.4 -1.4 -1.0 -1.2 Net profit 2.4 1.9 2.7 4.1 5.2 Gross margin 17.2% 19.3% 22.4% 23.5% 23.8% EBITDA margin 8.4% 10.3% 10.6% 11.2% 11.8% Operating margin 3.1% 4.4% 5.0% 5.8% 6.6% Net profit margin 2.4% 1.9% 2.8% 4.1% 4.9% Source: Company data, BZ WBK Brokerage
Fig. 7. ACE: Balance Sheet forecast
EUR in millions, unless otherwise stated
2012 2013 2014E 2015E 2016E
Current assets 36.0 31.2 30.0 30.9 32.4 Fixed assets 47.1 45.6 45.8 44.9 44.0 Total assets 83.1 76.8 75.9 75.8 76.4 Current liabilities 20.4 21.9 22.6 21.9 22.3 bank debt 3.5 5.2 7.0 6.1 4.7 Long-term liabilities 22.1 17.2 18.0 16.1 13.3 bank debt 18.5 14.0 14.8 12.9 10.0 Equity 40.7 37.7 35.2 37.7 40.9 share capital 3.2 3.2 3.2 3.2 3.2 Minority Interest 0.0 0.0 0.0 0.0 0.0 Total liabilities 83.1 76.8 75.9 75.8 76.4 Net debt 9.5 11.5 14.3 11.2 6.6
Source: Company data, BZ WBK Brokerage
Fig. 8. ACE: Cash flow forecast
EUR in millions, unless otherwise stated
2012 2013 2014E 2015E 2016E
CF from operations 3.8 8.2 9.0 9.4 11.4
CF from investment -11.5 -5.1 -5.8 -4.5 -4.5
CF from financing -1.0 -7.8 -3.5 -4.7 -6.5
Net change in cash -8.7 -4.8 -0.2 0.2 0.4
Poland
IT Distribution
N
OVEMBER12,
2014
A
CTION
B
UY
(M
R
ECOMMENDATION
AINTAINED
)
In line with official guidance
T
ARGETP
RICEC
URRENT:
PLN69.7
P
RICE(M
:
AINTAINEDPLN46.62
)
3Q14 Results Preview.
Most of the growth in 3Q14 sales
at Action, as was the case in the previous quarter, should
come from operations abroad. For 3Q14, we expect export
sales to expand by 42% y/y and the domestic sales, in line
with the market, by 3% y/y. Overall, we expect the
company’s sales at PLN1.33bn (+17% y/y). We see the
gross margin at 6.10% vs. 6.02% in 3Q13 and estimate the
SG&A costs at PLN59.0mn (SG&A/sales ratio at 4.43%).
The EBIT should reach PLN21.3mn and the net profit
PLN15.7m (+12% y/y, net margin at 1.17%).
Outcome:
POSITIVE.
Recent developments.
The company has recently signed
two large contracts for hardware shipments with science
universities in Krakow and Gdynia worth PLN41.0mn and
PLN30.6mn, respectively. CEO Mr. Piotr Bielinski recently
sold 150k shares at PLN47/share. According to his
statement, the cash will be used to capitalise game
developer Action Game Labs (Action 40% subsidiary).
2014 guidance.
The company sees its 2014 revenues at
PLN5.45bn and the net profit at PLN70.9mn. 1H14 results
account for 46% of the forecasted FY14 sales and 47% on
the net level. Our forecasts for 2014 are higher than the
guidance by 3% both on the top-line and the net level.
Change in Forecasts.
We apply no changes to our model.
Change in Valuation & Recommendation.
We keep our
12-month Target Price for Action at PLN69.7 and maintain
our Buy rating for the stock. The comparative valuation
points to PLN39.40 per share.
STOCK PERFORMANCE ACT TP WIG Relative 0 10 20 30 40 50 60 70 80 Oc t-1 1 Ja n -1 2 A p r-1 2 Ju l-1 2 Oc t-1 2 Ja n -1 3 A p r-1 3 Ju l-1 3 Oc t-1 3 Ja n -1 4 A p r-1 4 Ju l-1 4 Oc t-1 4
Buy Hold Sell Under Review / Suspended
The chart measures performance against the WIG index. On 11/05/2014, the WIG index closed at 53,591.
LAST RECOMMENDATIONS
Rec. Date Price Price performance on issue
date 12 month target absolute relative (p.p)
Buy 10-23-2014 46.0 69.7 1.3% 0.9 Buy 7-9-2014 43.0 69.7 7.0% 1.8 Buy 4-28-2014 46.9 65.0 -8.3% -6.6 Buy 1-30-2014 49.0 69.0 -4.3% -6.6 MAIN SHAREHOLDERS % of votes Mr. Piotr Bielinski 20.9% Mrs. Aleksandra Matyka 18.6%
Generali pension fund 10.8%
Mr. Wojciech Wietrzykowski 7.2%
Aviva pension fund 5.9%
COMPANY DESCRIPTION
One of the largest IT distribution company in Poland.
ANALYST Lukasz Kosiarski
(+48) 22 586 82 25
Company Data
PLNm 2013 2014E 2015E 2016E Reuters/Bloomberg codes ACT.WA / ACT PW
Sales 4,749 5,640 6,619 7,396 Market capitalisation (PLNm) 774
EBITDA 91 110 135 143 Number of shares (m) 16.6
EBIT 82 98 118 127 Free float (%) 53.2%
Net income 62 73 90 97 Avg. daily turnover 3M (PLNm) 0.6
P/E (x) 12.9 10.9 8.9 8.2
Price performance 1M 3M YTD
EV/EBITDA (x) 9.5 7.9 6.4 6.1 -0.8% 12.7% -2.9%
Fig. 1. Action: 3Q14 results preview
PLN in millions, unless otherwise stated
3Q11 4Q11 1Q12 2Q12 3Q12 4Q12 1Q13 2Q13 3Q13 4Q13 1Q14 2Q14 3Q14E y/y q/q Sales 669 1,023 788 752 827 1,148 1,132 989 1,140 1,488 1,324 1,197 1,333 16.9% 11.3% EBITDA 16.5 24.0 18.0 16.9 18.8 25.9 22.6 21.1 21.1 26.6 25.8 24.1 23.8 12.6% -1.3% EBITDA margin 2.5% 2.3% 2.3% 2.2% 2.3% 2.3% 2.0% 2.1% 1.8% 1.8% 1.9% 2.0% 1.8% -0.1 -0.2 EBIT 13.7 21.0 15.1 14.0 16.0 23.1 20.3 18.8 18.7 24.2 23.5 21.6 21.3 13.8% -1.4% EBIT margin 2.1% 2.1% 1.9% 1.9% 1.9% 2.0% 1.8% 1.9% 1.6% 1.6% 1.8% 1.8% 1.6% 0.0 -0.2 Net profit 10.1 15.0 11.1 9.3 11.0 16.8 15.0 13.3 14.0 19.3 17.3 15.9 15.7 12.0% -1.5% Net margin 1.5% 1.5% 1.4% 1.2% 1.3% 1.5% 1.3% 1.3% 1.2% 1.3% 1.3% 1.3% 1.2% -0.1 -0.2 Source: Company data, DM BZ WBK estimates
Fig. 2. Action: Forecasts changes
PLN in millions, unless otherwise stated
2014E 2015E 2016E
New Previous Change New Previous Change New Previous Change
Sales 5,640 5,640 0.0% 6,619 6,619 0.0% 7,396 7,396 0.0%
EBITDA 109.7 109.7 0.0% 134.9 134.9 0.0% 143.4 143.4 0.0%
EBIT 98.2 98.2 0.0% 118.2 118.2 0.0% 126.8 126.8 0.0%
Net profit 72.5 72.5 0.0% 89.6 89.6 0.0% 97.2 97.2 0.0%
Source: Company data, DM BZ WBK estimates
Fig. 3. Action: Valuation changes
In PLN per share, unless otherwise stated
New Previous Change
DCF valuation 69.7 69.7 0.0%
Comparable valuation (based on 2014-2016E) 39.4 39.4 0.0%
Source: Company data, DM BZ WBK estimates
Fig. 4. Action: Income statement forecast
PLN in millions, unless otherwise stated
2012 2013 2014E 2015E 2016E
Net sales 3,515 4,749 5,640 6,619 7,396
COGS 3,288 4,452 5,293 6,220 6,957
Gross profit 226.8 297.1 347.8 399.2 439.1
SG&A 158.5 210.5 247.9 279.3 310.7
Other operating income, net 0.0 -4.6 -1.7 -1.7 -1.7
EBITDA 79.6 91.4 109.7 134.9 143.4
Operating profit 68.3 82.1 98.2 118.2 126.8
Net financial income (costs) -7.3 -5.2 -7.2 -7.7 -6.7
Profit before tax 60.9 76.9 91.0 110.6 120.0
Income tax 12.7 16.1 18.5 21.0 22.8 Net profit 48.3 61.6 72.5 89.6 97.2 Gross margin 6.5% 6.3% 6.2% 6.0% 5.9% EBITDA margin 2.3% 1.9% 1.9% 2.0% 1.9% Operating margin 1.9% 1.7% 1.7% 1.8% 1.7% Net profit margin 1.4% 1.3% 1.3% 1.4% 1.3% Source: Company data, DM BZ WBK estimates
Fig. 5. Action: Balance sheet forecast
PLN in millions, unless otherwise stated
2012 2013 2014E 2015E 2016E
Current assets 763 1,021 1,090 1,157 1,229 Fixed assets 138 151 182 171 159 Total assets 901 1,172 1,273 1,328 1,389 Current liabilities 636 854 902 952 1,011 bank debt 107 107 107 107 107 Long-term liabilities 5 23 55 55 56 bank debt 0 20 50 50 50 Equity 260 295 316 320 322 share capital 2 2 2 2 2 Minority Interest 0 0 0 0 0 Total liabilities 901 1,172 1,273 1,328 1,389 Net debt 99 44 143 160 178
Source: Company data, DM BZ WBK estimates
Fig. 6. Action: Cash flow forecast
PLN in millions, unless otherwise stated
2012 2013 2014E 2015E 2016E
CF from operations 14.7 102.4 -24.4 13.2 2.0
CF from investment -5.9 -21.9 -43.3 -5.3 -4.8
CF from financing -9.3 -6.0 -0.7 -25.6 -15.1
Net change in cash -0.5 74.5 -68.4 -17.6 -17.9
Poland
Industrials
N
OVEMBER12,
2014
A
LUMETAL
B
UY
R
(I
ECOMMENDATION
NITIATION
)
Automotive shift to CEE
C
T
URRENT ARGETP
P
RICERICE:
:
PLN44.0
PLN52.4
Equity Story. Alumetal is the fourth biggest secondary aluminium(aluminium casting alloys) producer in Europe, enjoying superior profitability over its competitors thanks to an advanced metal management system, its modern facilities and lower staff costs. The company is capitalising on the shift of the automotive industry production to the CEE region from Western Europe. According to OICA data, the share of the CEE5 countries (Poland, Hungary, Czech Republic, Slovakia and Slovenia) in EU engine and gearbox production (main use for aluminium casting alloys) rose to 13% in 2012 from 1% in 2005 and this trend continues. Following the second stage of the Nowa Sol project, which expanded capacities by additional 33kt, we expect Alumetal to reach a nearly 93% utilisation this year. The company decided to launch a greenfield investment in Hungary, which will expand its capacities by another 60kt (to 225kt), starting from 4Q16. We believe that this a good move for Alumetal as it has a dominant position on the domestic market (with a 50% market share) and has already established a base of clients in Southern Europe (Hungary is, for instance, its third biggest export market so far). The Hungarian project should allow Alumetal to grow by leaps and bounds once more. The strong balance sheet and cash generation will enable it to finance this project (CAPEX of PLN120mn) and to simultaneously maintain its 50% dividend payout and safe indebtedness levels (net debt/EBITDA’16 at 1.2x)
Financials. We assumed the alloy-to-scrap spread at PLN1,365/t for theforecasted period, in line with the historical average. Having said that, the company should be able to maintain its 8.5% gross profit margin. We also expect the new capacities in Hungary to be utilised in 65% in the first full year of their running (though this will cannibalise the previous Hungarian sales).
Triggers/Risks. The company is heavily exposed to the automotivesegment (90% of sales), so any worsening environment in this industry will have a negative impact on the company’s financials. The company has a good track record of utilising new capacities but the Hungarian project is Alumetal’s first greenfield investment.
Valuation & recommendation. Our DCF model points to a TP ofPLN52.4 per share. The comparative valuation points to PLN41.8 but since the peer group is flawed (no listed close peers), we have set our TP at PLN52.4, implying a 19% upside potential.
STOCK PERFORMANCE AML WIG Relative 30 32 34 36 38 40 42 44 46 Ju l-1 4 Ju l-1 4 A u g -1 4 A u g -1 4 A u g -1 4 S e p -1 4 S e p -1 4 S e p -1 4 Oc t-1 4 Oc t-1 4 Oc t-1 4 No v-1 4
Buy Hold Sell Under Review / Suspended
The chart measures performance against the WIG index. On 11/05/2014, the WIG index closed at 53,591.
COMPANY DESCRIPTION
Company is a biggest polish and 4th
biggest in Europe manufacturer of secondary aluminium casting alloys used primarily in automotive sector.
Main shareholders % of votes
Ipopema 30 FIZAN 40.0%
Aviva pension fund 10.0%
ING pension fund 5.5%
ANALYST
Tomasz Kucinski
+48 22 534 16 10 [email protected]
Company Data
PLNm 2013 2014E 2015E 2016E Reuters/Bloomberg codes AMT.WA / AML PW
Sales 1015.3 1197.3 1263.3 1322.7 Market capitalisation (PLNmn) 663.3
EBITDA 54.0 75.4 90.1 93.7 Number of shares (mn) 15.1
EBIT 37.1 56.2 69.0 68.2 Free float (%) 42.5%
Net income 35.8 55.8 62.1 60.5 Avg. daily turnover 3M (PLNm) 0.7
P/E (x) 18.5 11.9 10.7 11.0
Price performance 1M 3M YTD
EV/EBITDA (x) 13.6 9.8 8.5 8.3 7.6% 25.8% n.a.
Fig. 1. Alumetal: DCF valuation
PLN in millions, unless otherwise stated
2014E 2015E 2016E 2017E 2018E 2019E 2020E 2021E 2022E 2023E
Revenues 1,197.3 1,263.3 1,322.7 1,547.7 1,578.7 1,610.3 1,642.5 1,667.1 1,692.1 1,717.5
EBIT 56.2 67.0 66.2 82.1 83.7 85.4 87.1 88.4 89.8 91.1
Cash taxes on EBIT 0.0 2.7 2.6 2.6 2.7 2.7 13.2 13.4 14.3 17.3
NOPAT 56.2 64.3 63.5 79.5 81.1 82.7 73.9 75.0 75.4 73.8
Depreciation 19.2 21.1 25.5 26.3 26.3 26.3 26.3 26.3 26.3 26.3
Change in operating WC 31.8 11.6 10.5 39.6 5.5 5.6 5.7 4.3 4.4 4.5
Capital expenditures 10.0 70.0 52.0 26.3 26.3 26.3 26.3 26.3 26.3 26.3
Net investment 22.6 60.6 37.0 39.6 5.5 5.6 5.7 4.3 4.4 4.5
Free cash flow 78.7 3.8 26.6 39.8 75.6 77.1 68.2 70.7 71.0 69.3
WACC 8.2% PV FCF 2014-2023 320.5 Terminal growth 1.0% Terminal value (TV) 976.7 PV TV 481.8 Total EV 802.3 Net debt 74.8 Equity value 727.5 Number of shares (mn) 15.1
Value per share (PLN, 31 Dec 2014) 48.3
Month 11.0
Curent value per share (PLN) 47.9
12M target price 52.4
Source: Company data, DM BZ WBK estimates
Fig. 2. Alumetal: Comparable valuation
Price (EURmn) Mkt cap
P/E EV/EBITDA
2014E 2015E 2016E 2014E 2015E 2016E
Alumetal SA 43.6 155 11.9 10.7 11.0 9.8 8.5 8.3
AMAG Austria Metall AG 26.99 951.8 20 16.1 13.1 9.1 7.6 6.7
Hindalco Industries Ltd 156.1 4,224 11.3 9.1 7.3 8.3 7.0 6.3 Alcoa Inc 16.33 15,483 20.0 15.3 13.5 8.4 6.7 6.1 United Co RUSAL PLC 4.25 6,699 14.8 6.9 6.5 14.4 10.3 9.5 Grupa Kety SA 288.05 639 14.0 13.1 12.7 8.7 8.4 8.1 Impexmetal SA 2.75 130 9.2 9.2 9.2 7.4 6.8 6.5 Median 14.4 11.1 10.9 8.5 7.3 6.6 Premium/discount vs. median -15.0% 16.7% -17.4% -3.9% 0.6% 14.9%
Fig. 3. Alumetal: 3Q14 results review
PLN in millions, unless otherwise stated
3Q11 4Q11 1Q12 2Q12 3Q12 4Q12 1Q13 2Q13 3Q13 4Q13 1Q14 2Q14 3Q14 y/y q/q Sales n.a. n.a. n.a. n.a. n.a. n.a. 244.1 225.4 274.2 271.6 311.4 305.2 292.3 6.6% -4.2% EBITDA n.a. n.a. n.a. n.a. n.a. n.a. 9.2 9.4 16.4 18.4 22.8 13.3 19.7 20.1% 48.1% EBITDA margin n.a. n.a. n.a. n.a. n.a. n.a. 3.8% 4.2% 6.0% 6.8% 7.3% 4.4% 6.7% 0.8 2.4 EBIT n.a. n.a. n.a. n.a. n.a. n.a. 5.2 5.4 12.4 14.1 18.0 8.5 14.9 20.2% 75.3% EBIT margin n.a. n.a. n.a. n.a. n.a. n.a. 2.1% 2.4% 4.5% 5.2% 5.8% 2.8% 5.1% 0.6 2.3 Net profit n.a. n.a. n.a. n.a. n.a. n.a. 5.7 4.8 12.4 12.9 17.2 10.7 14.0 12.9% 30.8% Net margin n.a. n.a. n.a. n.a. n.a. n.a. 2.3% 2.1% 4.5% 4.8% 5.5% 3.5% 4.8% 0.3 1.3 Source: Company data, DM BZ WBK estimates
Fig. 4. Alumetal: Forecast changes
PLN in millions, unless otherwise stated
2014E 2015E 2016E
New Previous Change New Previous Change New Previous Change
Sales 1197.3 n.a. n.a. 1263.3 n.a. n.a. 1322.7 n.a. n.a.
EBITDA 75.4 n.a. n.a. 90.1 n.a. n.a. 93.7 n.a. n.a.
EBIT 56.2 n.a. n.a. 69.0 n.a. n.a. 68.2 n.a. n.a.
Net profit 55.8 n.a. n.a. 62.1 n.a. n.a. 60.5 n.a. n.a.
Source: Company data, DM BZ WBK estimates
Fig. 5. Alumetal: Valuation changes
In PLN per share, unless otherwise stated
New Previous Change
DCF valuation 52.4 n.a. n.a.
Comparable valuation (based on 2014-2016E) 41.8 n.a. n.a.
Source: Company data, DM BZ WBK estimates
Fig. 6. Alumetal: Income statement forecast
PLN in millions, unless otherwise stated
2012 2013 2014E 2015E 2016E
Net sales 845 1015 1197 1263 1323
COGS 784 953 1096 1156 1210
Gross profit 61 62 101 107 112
SG&A 25 28 38 40 46
Other operating income, net 4 3 -4 2 2
EBITDA 53 54 75 90 94
Operating profit 39 37 56 69 68
Net financial income (costs) 4 2 2 4 5
Profit before tax 37 36 55 65 63
Income tax 3 1 0 3 3 Net profit 34 36 56 62 61 Gross margin 7.2% 6.2% 8.5% 8.5% 8.5% EBITDA margin 6.3% 5.3% 6.3% 7.1% 7.1% Operating margin 4.7% 3.6% 4.7% 5.5% 5.2% Net profit margin 4.1% 3.5% 4.7% 4.9% 4.6% Source: Company data, DM BZ WBK estimates
Fig. 7. Alumetal: Balance Sheet forecast
PLN in millions, unless otherwise stated
2012 2013 2014E 2015E 2016E
Current assets 237 272 345 340 351 Fixed assets 196 210 201 250 296 Total assets 432 483 547 591 647 Current liabilities 140 165 210 195 199 bank debt 56 60 92 72 70 Long-term liabilities 43 33 33 57 80 bank debt 18 11 11 37 44 Equity 249 285 304 338 368 share capital 248 284 302 336 366 Minority Interest 0 0 0 0 0 Total liabilities 433 483 547 591 647 Net debt 72 70 75 103 114
Source: Company data, DM BZ WBK estimates
Fig. 8. Ambra:: Cash flow forecast
PLN in millions, unless otherwise stated
2012 2013 2014E 2015E 2016E
CF from operations 52 36 43 72 76
CF from investment -13 -35 -10 -72 -55
CF from financing -39 -2 -5 -22 -25
Net change in cash 0 -1 28 -22 -4