University of Denver University of Denver
Digital Commons @ DU
Digital Commons @ DU
Electronic Theses and Dissertations Graduate Studies
1-1-2014
Validation of the Item-Attribute Matrix in TIMSS-Mathematics
Validation of the Item-Attribute Matrix in TIMSS-Mathematics
Using Multiple Regression and the LSDM
Using Multiple Regression and the LSDM
Lin Ma
University of Denver
Follow this and additional works at: https://digitalcommons.du.edu/etd
Part of the Educational Assessment, Evaluation, and Research Commons, and the Quantitative Psychology Commons
Recommended Citation Recommended Citation
Ma, Lin, "Validation of the Item-Attribute Matrix in TIMSS-Mathematics Using Multiple Regression and the LSDM" (2014). Electronic Theses and Dissertations. 987.
https://digitalcommons.du.edu/etd/987
This Dissertation is brought to you for free and open access by the Graduate Studies at Digital Commons @ DU. It has been accepted for inclusion in Electronic Theses and Dissertations by an authorized administrator of Digital Commons @ DU. For more information, please contact [email protected],[email protected].
Validation of the Item-Attribute Matrix in TIMSS–Mathematics Using Multiple Regression and the LSDM
__________
A Dissertation Presented to
the Faculty of the Morgridge College of Education University of Denver
__________
In Partial Fulfillment
of the Requirements for the Degree Doctor of Philosophy
__________
by Lin Ma March 2014
©Copyright by Lin Ma 2014 All Rights Reserved
ii Author: Lin Ma
Title: Validation of the Item-Attribute Matrix in TIMSS–Mathematics Using Multiple Regression and the LSDM
Advisor: Dr. Kathy E. Green Degree Date: March 2014
Abstract
For many cognitive diagnostic models, the item-attribute matrix (or Q-matrix) is an essential component which displays the relationship between items and their latent attributes or skills in knowledge and cognitive processes. However, it is a challenge to develop an effective Q-matrix. The purposes of the present study were (1) to validate of the item-attribute matrix using two levels of attributes (Level 1 attributes and Level 2 sub-attributes), and (2) through retrofitting the diagnostic models to the mathematics test of the Trends in International Mathematics and Science Study (TIMSS), to evaluate the construct validity of TIMSS mathematics assessment by comparing the results of two assessment booklets.
Item data were extracted from Booklets 2 and 3 for the 8th grade in TIMSS 2007, which included a total of 49 mathematics items and every student’s response to every item (15,654 students and 15,935 students took Booklets 2 and 3, respectively). The study developed three categories of attributes at two levels: content, cognitive process (TIMSS or new), and comprehensive cognitive process (or IT) based on the TIMSS assessment framework, cognitive procedures, and item type. At level one, there were 4 content attributes (number, algebra, geometry, and data and chance), 3 TIMSS process attributes (knowing, applying, and reasoning), and 4 new process attributes (identifying,
computing, judging, and reasoning). At level two, the level 1 attributes were further divided into 8 content attributes (b1 ~ b8), 12 TIMSS process attributes (know_a1 ~
iii
reas_a4), 11 new process attributes (d1 ~ d11). There was only one level of IT attributes (multiple steps/responses, complexity, and constructed-response). Twelve Q-matrices (4 originally specified, 4 random, and 4 revised) were investigated with eleven Q-matrix models (QM1 ~ QM11) using multiple regression based on the linear logistic test model (LLTM) and the least squares distance method (LSDM).
Comprehensive analyses indicated that the proposed Q-matrices explained most of the variance in item difficulty (i.e., 64% to 81%). The cognitive process attributes contributed to the item difficulties more than the content attributes, and the IT attributes contributed much more than both the content and process attributes. The new retrofitted process attributes explained the items better than the TIMSS process attributes. Results generated from the level 1 attributes and the level 2 attributes were consistent. Most attributes could be used to recover students’ performance, but some attributes’
probabilities showed unreasonable patterns. The items were adequately explained by the Q-matrices of QM5 and QM5-2 with the new process attributes. However, the analysis approaches could not demonstrate if the same construct validity was supported across booklets. The proposed attributes and Q-matrices explained the items of Booklet 2 better than the items of Booklet 3. The specified Q-matrices explained the items better than the random Q-matrices.
iv
Acknowledgements
I have many great people to thank for helping me successfully complete my doctoral study and this project. I sincerely thank my advisor, Dr. Kathy E. Green, for her invaluable guidance and support. Her intelligence, kindness, and overwhelming patience made the difference in my academic career. My special thanks to Dr. Duan Zhang, for her inspiration and generous support. During my graduate life, Dr. Zhang provided insight, advice, and encouragement on my research work and study. I am very thankful to Dr. Antonio Olmos-Gallo for his valuable suggestions on my dissertation. Also, I am grateful to Dr. Donald Bacon for serving as my committee chair. Meanwhile, I extend my
gratitude to Dr. Thomas E. Obremski, the other faculty, and the staff at the Morgridge College of Education and at the other DU schools and departments for their great support during my study at DU. Many thanks to my friends and colleagues, Dr. Marybeth Lehto, Turker Toker, and Wei Xie, for their generous help in the matrix development and the statistical computation. I would also like to thank my parents and sisters for their enduring support and encouragement. Finally, thanks to all my friends in Denver, especially Carol Carder and Laura Compton.
v
Table of Contents
List of Tables ... viii
List of Figures ...x
Chapter One: Introduction and Literature Review ...1
Research Purposes and Research Questions ...8
Literature Review...10
Cognitive diagnostic assessment...11
Merits of cognitive diagnostic assessment ...11
Cognitive diagnostic models with the Q-matrix ...13
The item-attribute matrix ...16
Definition of attributes and the item-attribute matrix ...16
Challenges in developing the item-attribute matrix ...18
Studies of the item-attribute matrix ...22
Impact of Q-matrix misspecification on the model parameters and classification of respondent...22
Validation of the Q-matrix ...33
Exploratory approach to developing the Q-matrix ...42
Cognitive diagnostic models ...46
The linear logistic test model ...46
The least squares distance method ...47
TIMSS mathematics assessment ...49
Overview of TIMSS ...49
TIMSS 2007 mathematics assessment for the eighth grade ...50
Research of cognitive constructs of the TIMSS mathematics test ...52
Chapter Two: Method ...55
Participants ...56
Measures… ...57
Mathematics test items ...57
Attributes developed according to the TIMSS assessment framework ...60
Attributes developed according to item type ...63
The second classification of cognitive process attributes—the new cognitive process attributes ...64
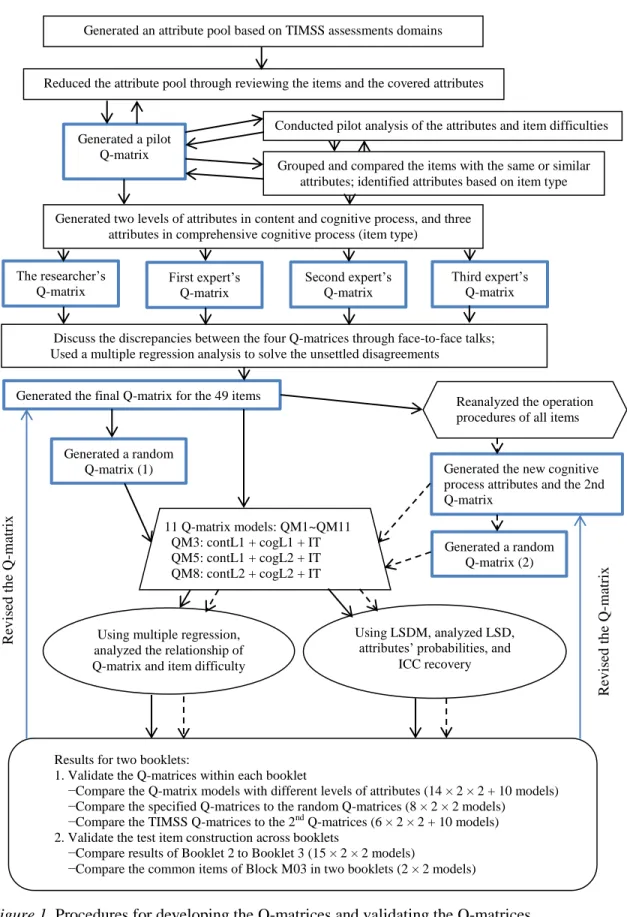
Procedures for Developing the Attributes and the Q-matrices ...66
Analysis...72
Models of the Q-matrix ...72
Analysis steps...75
Chapter Three: Results ...78
vi
The TIMSS Q-Matrix with the Attributes Based on the TIMSS Assessment
Framework and Item Type ...80
The Specified Q-matrix and item difficulty ...82
Booklet 2 ...82
Booklet 3 ...84
Comparing Booklet 2 to Booklet 3 ...85
The random Q-matrix and item difficulty ...87
Booklet 2 ...87
Booklet 3 ...88
LSDM: the specified Q-matrix ...89
Booklet 2 ...90
Booklet 3 ...94
Comparing Booklet 2 to Booklet 3 ...96
LSDM: the random Q-matrix...97
The 2nd Q-Matrix with the Attributes Based on the TIMSS Content, the New Cognitive Processes, and Item Type ...102
The specified Q-matrix and item difficulty ...103
Booklet 2 ...103
Booklet 3 ...105
Comparing Booklet 2 to Booklet 3 ...107
The random Q-matrix and item difficulty ...108
Booklet 2 ...108
Booklet 3 ...109
LSDM: the specified Q-matrix ...110
Booklet 2 ...110
Booklet 3 ...113
Comparing Booklet 2 to Booklet 3 ...115
LSDM: the random Q-matrix...115
Results Summary of the Regression Analysis and the LSDM Analysis for the Original Q-Matrices ...120
Revision of the Q-Matrices ...123
Analysis of the Revised Q-Matrices ...126
The revised Q-matrix and item difficulty ...126
Models with only the content attributes ...128
Models with the TIMSS cognitive process attributes ...128
Models with the new cognitive process attributes ...129
Results summary of multiple regression analysis ...130
LSDM: models with the TIMSS content and TIMSS cognitive process attributes ...131
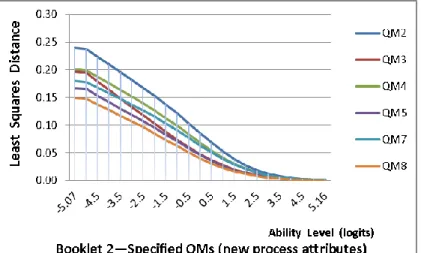
Least squares distance of Booklets 2 and 3 ...131
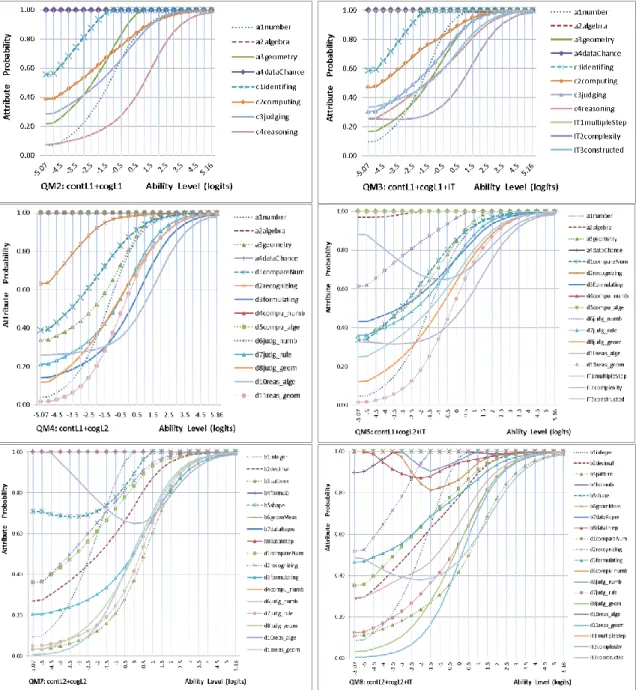
Attribute probability curves of Booklets 2 and 3 ...133
LSDM: models with the new cognitive process attributes ...137
Least squares distance of Booklets 2 and 3 ...137
vii
Results summary of LSDM analysis...140
Results summary of the regression analysis and the LSDM analysis for the revised Q-matrices ...143
Comparing the TIMSS cognitive process attributes to the new cognitive process Attributes...144
The Q-matrix models of QM2 ~ QM5-2 ...144
The Q-matrix models of QM9 ~ QM11 ...146
Recovery of item characteristic curve with the LSDM ...152
Chapter Four: Discussion ...156
Summary of the Study ...157
Major Findings ...161
Limitations ...171
Recommendations for Further Study ...172
Conclusion ...174
References ...176
Appendix A: Studies of the Item-Attribute Matrix ...189
Appendix B: Examples of TIMSS Mathematics Items ...195
Appendix C: Informed Consent Form ...196
Appendix D: The Q-Matrix with the Attributes Based on the TIMSS Assessment Framework and Item Type ...197
Appendix E: The Q-Matrix with the New Cognitive Process Attributes ...199
Appendix F: The Random Q-Matrix according to the Attributes Based on the TIMSS Assessment Framework and Item Type (Booklet 2) ...201
Appendix G: The Random Q-Matrix according to the Attributes Based on the TIMSS Assessment Framework and Item Type (Booklet 3) ...202
Appendix H: The Random Q-Matrix according to the New Cognitive Process Attributes (Booklet 2) ...203
Appendix I: The Random Q-Matrix according to the New Cognitive Process Attributes (Booklet 3) ...204
Appendix J: The Revised Q-Matrix with the Attributes Based on the TIMSS Assessment Framework and Item Type ...205
Appendix K: The Revised Q-Matrix with the New Cognitive Process Attributes ...207
Appendix L: Correlation Coefficients among the Item Difficulty and All Attributes (1) ~ (8) ...209
viii
List of Tables
Table 1. Characteristics of the Participants ...57
Table 2. Number of Items by Booklet ...58
Table 3. Number of Items by Assessment Block ...60
Table 4. Attributes Based on the TIMSS Assessment Framework and Item Type ...63
Table 5. The New Cognitive Process Attributes ...65
Table 6. Models of the Q-matrix ...73
Table 7. Item Difficulty of the Mathematics Items ...79
Table 8. Models of the Q-matrix Based on the TIMSS Assessment Framework and Item Type ...81
Table 9. Results of Multiple Regression of QM1 ~ QM3 for Booklet 2 ...82
Table 10. Results of Multiple Regression of QM4 and QM5 for Booklet 2 ...83
Table 11. Results of Multiple Regression of QM6 ~ QM8 for Booklet 2 ...83
Table 12. Results of Multiple Regression of QM1 ~ QM3 for Booklet 3 ...84
Table 13. Results of Multiple Regression of QM4 and QM5 for Booklet 3 ...84
Table 14. Results of Multiple Regression of QM6 ~ QM8 for Booklet 3 ...85
Table 15. Comparison of the Variances in Item Difficulty Explained by the Q-Matrices of Booklets 2 and 3 ...86
Table 16. Variances in Item Difficulty Explained by the Specified and Random Q-Matrices (Booklet 2) ...88
Table 17. Variances in Item Difficulty Explained by the Specified and Random Q-Matrices (Booklet 3) ...89
Table 18. Mean Least Squares Distance for the Specified QMs of Booklet 2 ...91
Table 19. Mean Least Squares Distance for the Specified QMs of Booklet 3 ...94
Table 20. Mean Least Squares Distance for the Specified and Random QMs ...98
Table 21. Models of the Q-matrix with the New Cognitive Process Attributes ...103
Table 22. Results of Multiple Regression of QM2 and QM3 for Booklet 2 (with New Process Attributes) ...104
Table 23. Results of Multiple Regression of QM4 and QM5 for Booklet 2 (with New Process Attributes) ...104
Table 24. Results of Multiple Regression of QM7 and QM8 for Booklet 2 (with New Process Attributes) ...105
Table 25. Results of Multiple Regression of QM2 and QM3 for Booklet 3 (with New Process Attributes) ...105
Table 26. Results of Multiple Regression of QM4 and QM5) for Booklet 3 (with New Process Attributes) ...106
Table 27. Results of Multiple Regression of QM7 and QM8 for Booklet 3 (with New Process Attributes) ...106
Table 28. Comparison of the Variances in Item Difficulty Explained by the Q-Matrices of Booklets 2 and 3 with the New Cognitive Process Attributes ...107
Table 29. Variances in Item Difficulty Explained by the Specified and Random Q-Matrices with the New Cognitive Process Attributes (Booklet 2) ...109
ix
Table 30. Variances in Item Difficulty Explained by the Specified and Random
Q-Matrices with the New Cognitive Process Attributes (Booklet 3) ...110 Table 31. Mean Least Squares Distance for the Specified QMs of Booklet 2 (with
New Process Attributes) ...111 Table 32. Mean Least Squares Distance for the Specified QMs of Booklet 3 (with
New Process Attributes) ...113 Table 33. Mean Least Squares Distance for the Specified and Random QMs (with
New Process Attributes) ...117 Table 34. Results Summary of the Analyses Using Multiple Regression and the
LSDM ...122 Table 35. Attributes after Revising the Q-Matrices ...126 Table 36. Variances in Item Difficulty Explained by the Revised Q-Matrices with
the TIMSS Process Attributes ...129 Table 37. Variances in Item Difficulty Explained by the Revised Q-Matrices with
the New Process Attributes ...130 Table 38. Mean Least Squares Distance for the Revised QMs of Booklet 2 (with
TIMSS Process Attributes) ...133 Table 39. Mean Least Squares Distance for the Revised QMs of Booklet 2 (with
New Process Attributes) ...138 Table 40. Results Summary of the Revised Q-Matrices Using Multiple Regression
and the LSDM ...142 Table 41. Variances in Item Difficulty Explained by the Revised Q-Matrices:
TIMSS Process Attributes Vs. New Process Attributes ...145 Table 42. Variances in Item Difficulty Explained by the Q-Matrices for QM1, QM6,
and QM9 ~ QM11 ...147 Table 43. Number of Items with Different Recovery Degrees ...154
x
List of Figures
Figure 1. Procedures of developing the Q-matrices and validating the Q-matrices ...71
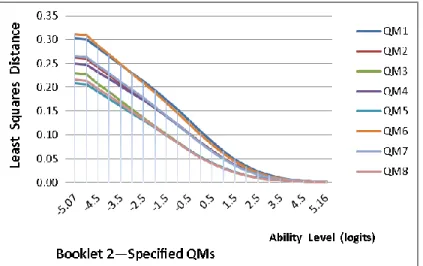
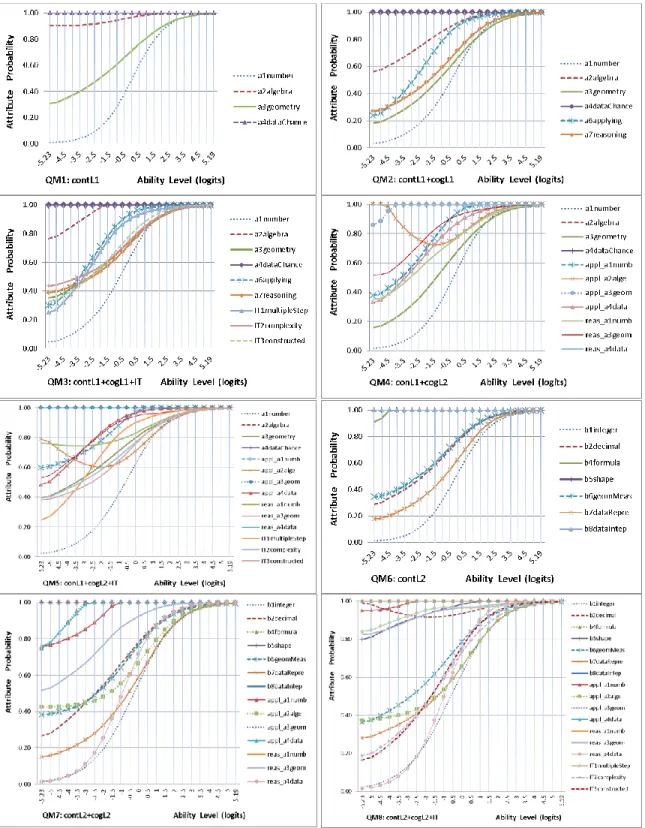
Figure 2. Least squares distance for the specified QMs of Booklet 2 ...91
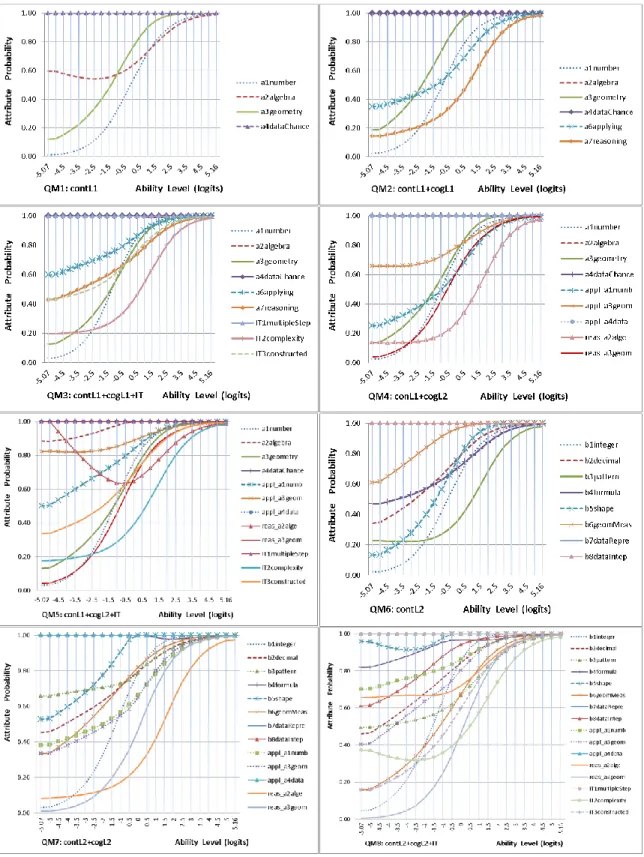
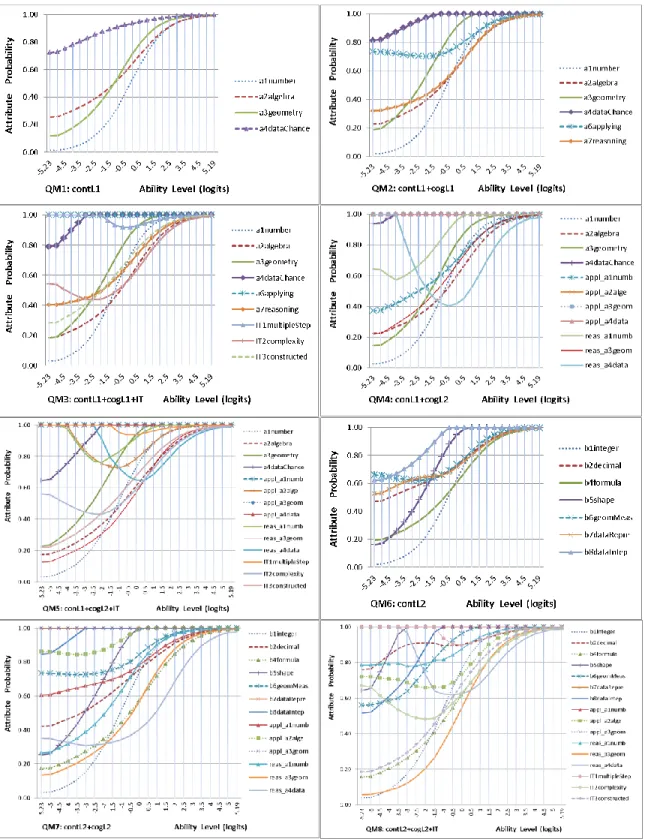
Figure 3. Attribute probability for the specified QM1 to QM8 of Booklet 2 ...93
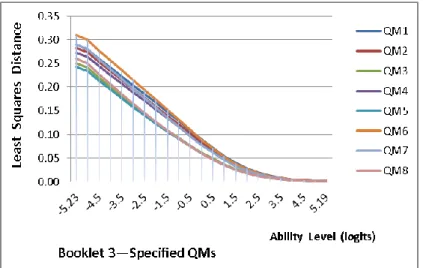
Figure 4. Least squares distance for the specified QMs of Booklet 3 ...94
Figure 5. Attribute probability for the specified QM1 to QM8 of Booklet 3 ...95
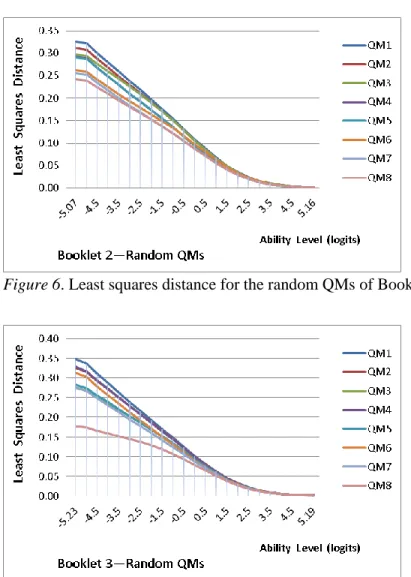
Figure 6. Least squares distance for the random QMs of Booklet 2...98
Figure 7. Least squares distance for the random QMs of Booklet 3...98
Figure 8. Attribute probability for the random QM1 to QM8 of Booklet 2 ...100
Figure 9. Attribute probability for the random QM1 to QM8 of Booklet 3 ...101
Figure 10. Least squares distance for the specified QMs of Booklet 2 (with new process attributes) ...111
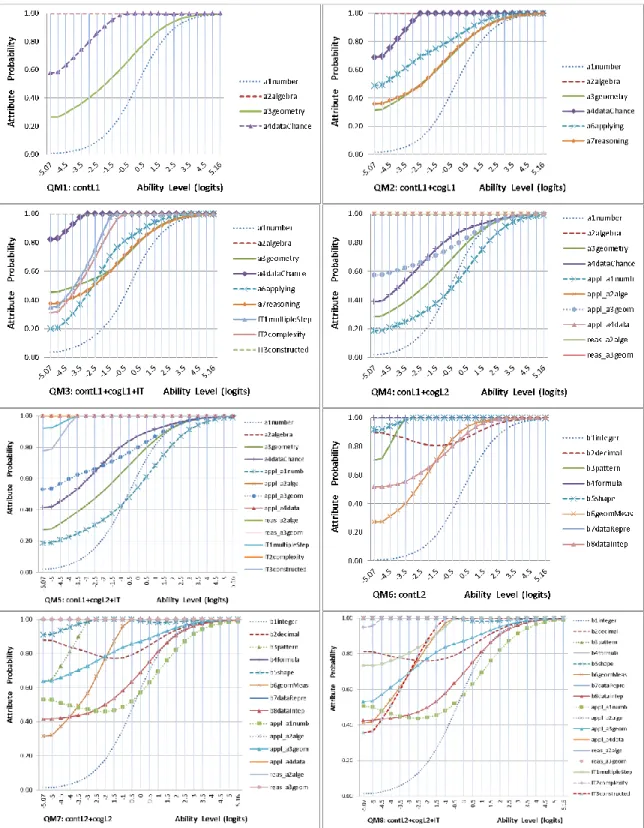
Figure 11. Attribute probability for the specified QM2-QM5, QM7 and QM8 of Booklet 2 (with new process attributes)...112
Figure 12. Least squares distance for the specified QMs of Booklet 3 (with new process attributes) ...113
Figure 13. Attribute probability for the specified QM2-QM5, QM7 and QM8 of Booklet 3 (with new process attributes)...114
Figure 14. Least squares distance for the random QMs of Booklet 2 (with new process attributes) ...116
Figure 15. Least squares distance for the random QMs of Booklet 3 (with new process attributes) ...116
Figure 16. Attribute probability for the random QM2-QM5, QM7 and QM8 of Booklet 2 (with new process attributes)...118
Figure 17. Attribute probability for the random QM2-QM5, QM7 and QM8 of Booklet 3 (with new process attributes)...119
Figure 18. Least squares distance for the revised QMs of Booklet 2 (with TIMSS process attributes) ...132
Figure 19. Least squares distance for the revised QMs of Booklet 3 (with TIMSS process attributes) ...132
Figure 20. Attribute probability for the revised QM1 to QM5-2 of Booklet 2 (with TIMSS process attributes)...135
Figure 21. Attribute probability for the revised QM1 to QM5-2 of Booklet 3 (with TIMSS process attributes)...136
Figure 22. Least squares distance for the revised QMs of Booklet 2 (with new process attributes) ...137
Figure 23. Least squares distance for the revised QMs of Booklet 3 (with new process attributes) ...137
Figure 24. Attribute probability for the revised QM2 to QM5-2 of Booklet 2 (with new process attributes) ...139
Figure 25. Attribute probability for the revised QM2 to QM5-2 of Booklet 3 (with new process attributes) ...140
xi
Figure 26. Least squares distance for QM9 to QM11 of Booklet 2 (with TIMSS
process attributes) ...148 Figure 27. Least squares distance for QM9 to QM11 of Booklet 3 (with TIMSS
process attributes) ...149 Figure 28. Least squares distance for QM10 and QM11 of Booklet 2 (with new
process attributes) ...149 Figure 29. Least squares distance for QM10 and QM11 of Booklet 3 (with new
process attributes) ...149 Figure 30. Attribute probability for QM9 to QM11 of Booklets 2 and 3 (with level 1
TIMSS process attributes)...151 Figure 31. Attribute probability for QM10 and QM11 of Booklets 2 and 3 (with
level 1 new process attributes) ...152 Figure 32. Mean absolute difference of the Booklet 2 items for QM4 and QM5-2 ...153 Figure 33. Mean absolute difference of the Booklet 3 items for QM4 and QM5-2 ...153 Figure 34. Mean absolute difference of the items in Block M03 for QM4 and
1
Chapter One
Introduction and Literature Review
Assessments play a vital role in society. Probably, all of us have experienced numerous examinations or tests since we began school. Assessments, large or small, not only decide one’s immediate educational path, but also impact one’s choice of future careers and life, as well as bearing effects on social equality (Hanson, 1993; Miyazaki, 1976; Wilbrink, 1997). Because of the power of assessment in our daily lives, the pursuit of scientific and effective assessment systems is an enduring endeavor for researchers, educators, and policymakers, especially for those in the field of educational assessment. For any nation, human resources are key to development and prosperity both
economically and socially. Education is the primary foundation for nurturing
knowledgeable and skilled citizens (National Commission on Excellence in Education, 1983), while educational assessments, as evaluation tools of educational outcomes, are core components in the educational system. Nowadays to better appraise the development of children, intellectually, psychologically, or physically, educational assessments are administrated at all levels—international, national, regional, and local (Schmeiser, 2007).
From an historical perspective, the approaches and ends of educational assessment have changed due to progress in education systems and advances in
technology and human society. Education is in many places no longer a privilege of the wealthy class. In modern society, all members are entitled to equal educational
2
Education, 1983). For example, the progress in higher education was from being
available to the elite to being available to the masses, and then to approaching universal access during the past decades (Trow, 2006). Thus, current large-scale educational assessments are not implemented only for selecting students for college or university education, such as college entry examinations, or a small group of elites for the state's civil services, such as the imperial Chinese civil service examinations or the
examinations in Western Europe during the 18th and 19th centuries (Hanson, 1993;
Wilbrink, 1997). For educational assessments employed in present K-12 education in U.S. and many countries around the world, the main goals are to display the students’ learning status, to provide feedback for learning and instruction, to collect information for
educational policies, and finally, to raise student achievement to higher levels (Linn, 2006, 2010; Nichols, 1994) .
In the 1960s, the National Assessment of Educational Progress (NAEP) was launched to periodically monitor student’s academic achievement (Jones & Thissen, 2007). During the 1970s and 1980s, under educational systems deemed to be
unsatisfactory, “both the top-down accountability and the bottom-up instructional perspectives” (p. 4) demanded expanding educational assessments, for both educational policy-making and for classroom instruction (Linn, 1993). As a result, since the 1980s, standardized tests have been employed by more and more states in their educational accountability systems (Linn, 2006, 2010; Nichols, 1994). This trend was strengthened by the passage of the No Child Left Behind Act of 2001 (NCLB: U.S. Department of Education, 2001). To improve the performance of U.S. primary and secondary schools, NCLB required all states to have compulsory achievement tests for multiples subjects at
3
different grades (Pellegrino, 2004). However, examinations are not ultimate goals; they “are supposed to be a means to an end, that end being learning” (Hanson, 1993, p. 218). Increasing assessment does not necessarily lead to the improvement in students’
achievement. As Pellegrino (2004) pointed out, “weighing the pig won’t cause it to grow—you still have to feed it” (p. 5). Only when educational assessments become integrated components of learning and instruction can they exert significant impact on improving students’ academic performance (Pellegrino, 2004). Thus, design and implementation of more reliable and effective assessments are still challenges in the educational assessment community. Educators expect “to develop a more efficient and effective diagnostic testing model that provides technically sound information about student achievement” and that can “facilitate differential instruction to individual students or groups of students” (Schmeiser, 2007, p. 1118).
Technically, modern educational assessments are rooted in the anthropometric testing and intelligence testing of the 1880s (Hanson, 1993; Jones & Thissen, 2007; Wilbrink, 1997). Frances Galton’s anthropometric testing and then James McKeen Cattell’s mental tests focus more on individual physical differences, while Binet and Simon’s intelligence testing was intended to assess higher cognitive abilities such as child’s mental age. Following them, numerous psychologists and statisticians contributed to the development and popularity of measurements, and their application with the U.S. Army and with educational systems. As in every scientific and social discipline, the long-term development of educational assessments needs a sturdy theoretical foundation. Louis Leon Thurstone, as a measurement pioneer, explored underlying theories of measurement and the creation of reliable tests in the 1930s (Jones & Thissen, 2007).
4
Before the 1970s, classical test theory (CTT), which uses raw scores, dominated the field of measurement research. But, the test scores based on the CTT are dependent on test items and examinees, and so are not invariant. Item response theory (IRT) provides invariant estimates for both test item and examinee ability (Hambleton, 1993). In the 1970s and 1980s, substantially increasing numbers of research studies employed IRT with practical assessment issues (Linn, 1993). However, although IRT has more
advantages than CTT, only a single ability of an examinee is estimated in a test based on a summative form. IRT models still “have little connection with the concerns of cognitive theory about the processes, strategies, and knowledge structures that underlie item
solving” (Embretson, 1993, p. 125). Numerous studies pointed out that assessments lacked cognitive foundations (Snow & Lohman, 1993). Since the 1980s, educational researchers have increasingly explored the integration of cognitive psychology with psychometrics to create better diagnostic testing and measurements (Mislevy, 2010; Nichols, 1994; Sheehan & Mislevy, 1990; Snow & Lohman, 1993). Growing interest in cognitive diagnostic assessment (CDA) concerns validity issues in educational
assessment and a way to create efficient diagnostic tools for improving class instruction and students’ learning (Chen, 2006).
Meanwhile, the rapid advances in science and technology not only created more advanced computing tools, but also demanded more precise information for measurement. As studies in the science fields such as chemistry, biology, and physics, research in
educational assessment reached to a relative “micro-level” with the aid of advanced technical tools (K. K. Tatsuoka, 2009). Following the relatively coarser-grained scores, such as CTT overall score and IRT score, educational researchers investigated
5
educational assessments that can provide cognitive information at a finer level of grain size, such as mastery of latent attributes or sub-skills, and cognitive processes that affect students’ acquisition of knowledge. As a result, cognitive diagnostic models (CDMs) are “designed to measure specific knowledge structures and processing skills in students so as to provide information about their cognitive strengths and weaknesses” (Leighton & Gierl, 2007, p. 3). Also, the study of cognitive diagnostic assessment was impelled by the enactment of NCLB (U.S. Department of Education, 2001), which called for interpretive, descriptive, and diagnostic assessment reports for individual students (U.S. Department of Education, 2003).
According to Fu and Li (Fu, 2005; Fu & Li, 2007), there are over sixty types of CDMs, for binary, polytomous, or continuous response items, for compensatory or non-compensatory attribute structures, and for unidimensional or multidimensional latent traits. For many CDMs, the item-attribute matrix (or attribute matrix, or Q-matrix) is the quintessential component “because it represents the operationalization of the substantive theory that has given rise to the design of the diagnostic assessment” (Rupp, Templin, & Henson, 2010, p. 49). So, the correct specification of the relationship between items and attributes is a crucial step in the analyses with a CDM (Baker, 1993; de la Torre, 2008; Im, 2007; Im & Corter, 2011; Rupp & Templin, 2008; Rupp et al., 2010). However, relatively few studies have investigated validation of the item-attribute matrix. As Liu, Xu, and Ying (2011a) pointed out, “Despite the importance of the Q-matrix in cognitive diagnosis, its estimation problem is largely an unexplored area” (p. 2). Although in the past five years, researchers have conducted some studies on validating the Q-matrix, there are still no agreed-upon standards for examining the attribute matrix. The validation
6
of the attribute matrix needs to be further examined to enable reliable inferences from a CDM. Thus, the present study explored validation of the item-attribute matrix using test item data from the Trends in International Mathematics and Science Study 2007 (TIMSS 2007).
TIMSS is one of a few international large-scale studies. Modern communications make the earth a global village with transparent borders. The world calls for more
collaboration than ever before, although global competition still exists among countries. Educators extend their lenses beyond their own countries. They concern themselves with education and human development in the whole world, especially development of young people—the future of the world. Their concerns led to the development of international large-scale assessments, such as the Progress in International Literacy Study (PIRLS), Programme for International Student Assessment (PISA), and TIMSS. The primary goals of these international assessments are to collect solid information on trends in students’ achievement in mathematics, science, and reading literacy, or in the essential knowledge and skills needed in adult life, and also comprehensive background information that could affect their performance; to provide guidance for educational policy-making and practices; and ultimately to improve the quality and equity of education in national as well as international contexts (Mullis, Martin, & Foy, 2008; Mullis et al., 2005b; Mullis, Martin, Ruddock, O’Sullivan, & Preuschoff, 2009; Organization for Economic Co-operation and Development [OECD], 2010).
TIMSS is the largest international educational study, involving more than 60 countries around the world (Mullis et al., 2005b, 2009). The study is supervised by the International Association for the Evaluation of Educational Achievement (IEA). It is
7
designed to monitor fourth and eighth graders’ achievement in mathematics and science over time. The assessment content is in line with mathematics and science curricula in the participating countries and is intended to provide information important to evaluating the effectiveness of curricular and instructional methods. As the largest international
comparative assessment, TIMSS results exert significant influence on the participating countries’ educational policies and educational improvement all around the world. Thus, the validation of the TIMSS assessment is extremely important. The present study focuses on the eighth graders’ mathematics assessment in TIMSS 2007, the latest released assessment.
According to the design framework, TIMSS is intended to better understand what knowledge and skills students should learn at school and the degree to which students have mastered that knowledge and those skills, that is, students’ particular strengths and weaknesses. Since the first wave of TIMSS in 1995, students’ overall mathematics achievement and achievement in the content domains (e.g., number, algebra, geometry, and data and chance) have been reported. To meet increasing needs for students’
performance information in cognitive processes, the subscores of three cognitive domains (knowing, applying, and reasoning) were required to be reported in TIMSS 2007. The above review shows that both TIMSS and CDA have similar study purposes, that is, to provide fine-grained diagnostic feedback that can facilitate instruction and learning. Thus, cognitive diagnostic methods were applied in the current study to explore achievement scales in TIMSS mathematics assessment.
8
Research Purposes and Research Questions
The purposes of this study were (1) to validate the item-attribute matrix using two levels of attributes (Level 1 attributes and Level 2 sub-attributes), and (2) through
retrofitting the diagnostic models to the TIMSS test, to evaluate the construct validity of TIMSS mathematics assessment by comparing the results of two assessment booklets in TIMSS 2007. The matrix of mathematics attributes was cross-validated by two cognitive methods: multiple regression based on Fischer’s linear logistic test model (LLTM, 1973) and Dimitrov’s least squares distance method (LSDM, 2007). These two approaches are IRT-based methods, and assume that all latent attributes are non-compensatory, that is, all attributes must be mastered to solve an item correctly.
Moreover, the current study examined attributes for both mathematical content or knowledge and cognitive processes involving solving mathematics problems. According to Embretson (1983), an effective “cognitive model should diagnose attributes on
knowledge and skills as well as cognitive processes/mechanisms” (p. 180). For eighth-grade mathematics, the content domains are fairly consistent and the content attributes are easily specified. However, the attributes for cognitive processes are relatively difficult to identify. If every step of the cognitive process is specified, there are many parameters which would likely be unstable. If cognitive process attributes are summarized in a very broad way, insufficient feedback would be provided for instruction and learning. TIMSS 2007 reported the subscores for the four content domains and three cognitive domains. Therefore, this study explored cognitive attributes with appropriate grain size for both domains. (Note: In this study and other CDM studies, cognitive attributes include attributes of both content and cognitive domains—content attributes and cognitive
9
process attributes. In TIMSS, cognitive domains only refer to cognitive processes/behaviors such as knowing, applying, and reasoning.)
The following research questions were addressed in this study.
(1) Which type of attributes contributes more to item difficulty: content, cognitive process, or complex cognitive process (item type)?
(2) Do the new cognitive process attributes provide an explanation of the items? What different results were found between the TIMSS cognitive process attributes and the new cognitive process attributes? (The TIMSS cognitive process attributes (knowing, applying, and reasoning) were developed based on the TIMSS assessment framework, while the new cognitive process attributes (identifying, computing, judging, and reasoning) were based on hypothesized cognitive procedures in solving the test items.)
(3) What differences are generated from the level 1 attributes and the level 2 attributes? (The level 2 attributes were the sub-attributes of the level 1 attributes)
(4) Are the attributes of the two levels appropriate for recovering the students’ mathematics achievement?
(5) What attributes combined into a Q-matrix can adequately explain the TIMSS
mathematics test?
(6) Do the two booklets hold the same construct validity in mathematics assessment?
The current study contributes to the following aspects of assessment. First, the relationship between items and attributes is the key component for many cognitive
10
diagnostic models. Through different methods and indexes, this study sheds additional light on the process for creating and testing a reliable attribute matrix. Second, this study can provide useful information for constructing ideal test items in mathematics
assessments, especially for TIMSS, in terms of knowledge content and cognitive
processes, as well as item type (e.g., multiple-choice response or open response, wording, and length of question). As the biggest international series of studies, every wave of TIMSS assessments relies on numerous efforts, collaboration, time, and funding for designing, developing, and administering the tests (Gonzales et al., 2008; Mullis et al., 2005b, 2008, 2009). It is an ambitious effort for TIMSS to offer scientific mathematics tests and feedback for instruction and learning. Third, the study also generates valuable results that help better understand students’ strengths and weaknesses in mathematics around the world.
Literature Review
The following review summarizes literature related to four topics: (1) cognitive diagnostic assessment, (2) the item-attribute matrix, (3) cognitive diagnostic models— LLTM and LSDM, and (4) TIMSS mathematics assessment. The first section introduces the motivations and advantages of developing cognitive diagnostic assessments, common CDMs, and the importance of the Q-matrix in CDMs. The second section addresses definition and selection of attributes and the challenges in building attribute matrices, and reviews studies of the item-attribute matrix, such as misspecification and validation of the Q-matrix. The third section describes the CDMs related to the present study: the LLTM and LSDM. The last section of this literature review summarizes the development of
11
TIMSS, design of the TIMSS 2007 mathematics assessment, and studies of cognitive constructs of the TIMSS mathematics test.
Cognitive diagnostic assessment.
The generation of CDA is a product of multiple streams of influence. The idea of mass education concerns progress of our society as a whole; also, it concerns
development of individual students. The current educational system not only examines educational outcomes, but also pays attention to learning processes. Educators, parents, and students themselves want to know what knowledge has been mastered; they also want to deeply understand what cognitive skills are necessary for mastery. Moreover, the development of education seeks advanced and more reliable educational assessment, while advancement in modern science and techniques makes it possible to provide more precise measures. In addition, U.S. educational policy, specifically the enactment of NCLB (U.S. Department of Education, 2001), provided a strong impetus for developing more fine-grained assessment. Under these circumstances, CDA has attracted more researchers’ and educators’ interest during the past thirty years. Researchers retrofit CDMs to existing tests to search for more detailed diagnostic information. Meanwhile, they implement CDA to explore a new generation of educational assessments.
Merits of cognitive diagnostic assessment. Cognitive diagnostic assessment integrates advanced knowledge in cognitive psychology and psychometrics. Compared to unidimensional measurement methods such as CTT and IRT, CDA has some potential advantages. The information derived from CDA is “interpretive and diagnostic, highly informative, and potentially prescriptive” (Pellegrino et al., 1999, p. 335). First, CDA diagnoses students’ achievement and learning at a finer level of grain size from multiple
12
dimensions within a given subject, which allows a better understanding of students’ knowledge states (Dimitrov, 2007; Gierl & Leighton, 2007; Lee & Sawaki, 2009; Leighton & Gierl, 2007; Pellegrino, Baxter, & Glaser, 1999). Individual students’ learning profiles are illustrated by the attributes required by each item, which cover underlying knowledge and skills, as well as cognitive processes (K. K. Tatsuoka, 2009).
Second, the fine-grained feedback provides detailed information for teaching and instructional interventions (Leighton & Gierl, 2007; Nichols, 1994). One of the main purposes of CDA is to classify students according to latent knowledge characteristics (Rupp & Templin, 2008; Rupp et al., 2010). Through students’ knowledge profiles, teachers learn about students’ cognitive strengths and weaknesses in specific knowledge areas, which assist them in implementing more effective instructional strategies to remedy their weaknesses (Dimitrov, 2007; Lee & Sawaki, 2009).
Third, CDA focuses on structured procedural or knowledge networks (Yang & Embretson, 2007). It holds promise for designing tests with desirable measurement and cognitive characteristics, especially for devising large-scale assessments (Dimitrov, 2007). For large-scale assessments, designing and updating test item pools always takes a great amount of resources in time, finance, and expertise. Use of cognitive diagnostic methods might reduce costs in developing test items. Studies found that CDMs have higher reliability than IRT models for tests with the same length (Templin & Henson, 2009), which indicates that students’ latent abilities can be measured with fewer items. Moreover, in general, the required attributes in knowledge and skills are announced openly before a test, while test items are kept in security. In CDA, it would be relatively easier to generate numerous test items through multiple combinations of the required
13
attributes. Motivated by cognitive response processes, some researchers have explored designing tests under CDA frameworks, such as the cognitive design system (Embretson, 1998, 2010), evidence centered design (Almond, Mislevy, Williamson, & Yan, 2011; Mislevy, Almond, & Lukas, 2003; Mislevy & Haertel, 2006; Mislevy, Steinberg, & Almond, 2003), principled test design with the attribute hierarchy method (Gierl, Alves, & Majeau, 2010), and assessment engineering task models (Dallas, Furter, Luo, & Ma, 2012; Luecht, 2002, 2012; Luecht & Dallas, 2010; Masters, 2010).
In addition, CDA brings a promising future for testing and assessment as the educational environment is changing with advanced technology. For instance, some studies tried to integrate cognitive diagnosis into computer adaptive testing (Chang, Boughton, Wang, & Zhang, 2010; Neo, 2011; Neo & Chang, 2012).
Cognitive diagnostic models with the Q-matrix. The advantages of CDA
persuade researchers to explore different CDMs that can extract reliable references about students’ learning states. Many CDMs are IRT-based models and use a Q-matrix to specify the relationship between items and attributes required by items. The seminal CDMs might track back to Suppes’ probabilistic model (1969) and its extension proposed by Spada (Dimitrov, 2007).
Suppes (1969) analyzed task performance and related operations in arithmetic problems using stimulus-response theory of finite automata. Later, Spada (1977) replaced Suppes’ attribute probability term with Rasch model probability (Rasch, 1960), which allows variance in probability across persons. Both models assumed that the probability for solving a problem correctly was the product of the probabilities for successfully manipulating the operations or knowledge. Based on the same assumption, a body of
14
conjunctive CDMs has been developed, which assume that successful response on an item requires mastery of all necessary knowledge and skills. In the conjunctive models, a low value on one attribute normally cannot be compensated for by a high value on another attribute. The most well-known conjunctive CDMs include the linear logistic test model (Fischer, 1973), the multicomponent and general component latent trait models (Embretson, 1984; Whitely, 1980), K. K. Tatsuoka’s rule space model (1983, 1985, 1987, 1990, 1995, 2009), the noncompensatory reparameterized unified model or fusion model (DiBello, Stout, & Roussos, 1995, 2007; Hartz, 2002), the deterministic inputs, noisy ‘‘and’’ gate (DINA) model (de la Torre & Douglas, 2004; de la Torre, 2011; Haertel, 1989; Junker & Sijtsma, 2001; Macready & Dayton, 1977), the noisy inputs,
deterministic ‘‘and’’ gate (NIDA) model (Junker & Sijtsma, 2001; Maris, 1999), the attribute hierarchy method (Gierl & Leighton, 2007; Gierl et al., 2007; Gierl, Zheng, & Cui, 2008; Leighton et al., 2004; Wang & Gierl, 2011), von Davier’s general diagnostic model (2008), Dimitrov’s least squares distance method (2007, 2010), and Rupp,
Templin, and Henson’s log-linear CDM (2010). The LLTM and LSDM are introduced in detail in the following section.
Also, researchers explored disjunctive CDMs, which assume that successful response to an item only requires mastery of at least one of the necessary knowledge and skill attributes. The disjunctive CDMs encompass the compensatory reparameterized unified model (Hartz, 2002), the deterministic input, noisy-or-gate (DINO) model and the noisy input, deterministic-or-gate (NIDO) model (Templin & Henson, 2006; Rupp et al., 2010), the disjunctive LSDM (Dimitrov, 2012), and the log-linear CDM (Henson,
15
CDMs, please refer to the studies by Rupp, Templin, and Henson (2010), Fu and Li (Fu, 2005; Fu & Li, 2007), and DiBello, Roussos, and Stout (2007). They summarized CDMs in terms of attribute scale, attribute dimensionality, item type, Q-matrix incompleteness, cognitive strategy, and attribute structure. These models have been applied to or
examined with simulated data or real data in the fields of mathematics, English language, computer science, biology, architecture, and gambling behaviors.
For all of the above CDMs, the item-attribute matrix is an integral component. According to Rupp, Templin, and Henson (2010), CDMs “are confirmatory
multidimensional latent-variable models. Their loading structure/Q-matrix can be complex to reflect within-item multidimensionality or simple to reflect between-item multidimensionality” (p. 83). To be confirmatory models, CDMs require that the loading structure or Q-matrix be specified before data analyses. In general, cognitive diagnostic analyses involve the following main steps: identifying and defining attributes according to tests and test items, developing the Q-matrix, choosing a model and analyzing data, and providing diagnostic feedback—reporting scores and classifying examinees (Lee & Sawaki, 2009). This analysis procedure reflects the fundamental position of the Q-matrix for many CDMs. The quality of the Q-matrix highly impacts whether CDMs can be implemented appropriately, whether the parameters can be estimated correctly, and whether the results are reliable. However, many studies or analyses with CDMs assume that the Q-matrix is correct or fixed. Also relatively few studies assess the construction and validation of the Q-matrix.
16
The item-attribute matrix.
The attribute or Q-matrix, as the “weight” of attributes in item difficulty, was first introduced in the study of the linear logistic test model by Fischer (1973). DiBello et al. (2007) pointed out “LLTM’s use of a Q matrix as an historically pivotal development that lies mid-way between unidimensional models such as the Rasch model and fully
diagnostic models” (p.18). Later, K. K. Tatsuoka (1983, 1985, 1990, 2009) further elaborated attributes and the item-attribute matrix. Researchers from the different
perspectives addressed the construction of the item-attribute matrix and its challenges and the consequences of a misspecified Q-matrix, as well as potential validation methods.
Definition of attributes and the item-attribute matrix. K. K. Tatsuoka (1983, 1990, 2009), as one of most influential figures in CDA, illuminated attributes and the item-attribute matrix in detail in studies of the rule space method. Attributes (or cognitive attributes)refer to underlying knowledge and cognitive processing skills that are required to solve problems in a specific content area. Sometimes the terms “attributes” and “skills” are used interchangeably by researchers. Attribute patterns that exhibit mastery or
nonmastery of attributes are defined as knowledge states or knowledge structures. Attributes are latent variables that can be expressed by the indicators—observed item scores. Compared to item-level responses, responses to attributes can be treated as micro-level responses. Item-attribute matrix (Q-matrix or attribute matrix) is an incidence matrix that displays the hypothesized relationship between items and necessary attributes. Generally, the rows of a Q-matrix represent items and the columns represent attributes. For example, a Q-matrix (j × k) indicates that there are j items related to k attributes. The entries of a Q-matrix are 1s or 0s. For an element qjk, “1” means that a correct response to
17
item j requires attribute k; otherwise, it is “0”. The item-attribute matrices represent the
design of assessments (Close, 2012).
The development of attributes and Q-matrices with high quality is always a challenge. It often needs the collaboration of experts in the content area fields of the test subject, psychology, educational measurement, statistics, and education practice (K. K. Tatsuoka, 2009). The experts derive a list of attributes through analyzing goals of
assessments, test specifications, and test items, and also via studying students’ test-taking protocols and talking out loud when students are answering items. First, the selection and identification of attributes is based on the degree or level of information one wants to diagnose or report (Lee & Sawaki, 2009; Rupp et al., 2010; K. K. Tatsuoka, 2009), which means that researchers need to choose an appropriate grain size. In the studies of addition and fraction subtraction questions, K. K. Tatsuoka specified every source of erroneous rules of operations as an attribute. However, for the studies of large-scale assessments such as TIMSS and NAEP, she pointed out it is not appropriate to choose attributes at such a small grain size, which would result in unstable parameters and overly complex diagnostic feedback to teachers and students. Hartz (2002) also pointed out a tradeoff between the complexity of the Q-matrix and the accuracy of parameter estimation must be evaluated on a case by case basis. Therefore, a balance between the richness of
diagnostic information and the stability of estimation is necessary. The rule space method can handle eighteen or fewer attributes for a test with 60 items (K. K. Tatsuoka, 2009); most CDMs use four to eight attributes (Rupp & Templin, 2008).
Second, the attribute definition should reflect major knowledge, skills, and thinking processes that underlie the responses on tasks. Some CDA studies focus on the
18
test content or knowledge, such as mathematics attributes in number, algebra, geometry, and probability, or English language attributes in listening, speaking, writing, and reading. Some studies focus on cognitive processes, such as K. K. Tatsuoka’s addition and
fraction subtraction questions. In the analysis of patterns of students’ sub-skill achievement in the Third International Math and Science Study-Revised (TIMSS-Revised) in 1999, K. K. Tatsuoka and her associates developed a set of comprehensive attributes classified into three categories: content knowledge variables, cognitive process variables, and special skill variables unique to item types (K. K. Tatsuoka, Corter, & C. Tatsuoka, 2004). Using the same attribute classifications, researchers conducted cognitive analyses on mathematics of Turkish university entrance exam and a national assessment on Turkish eighth-grade (Dogan, 2006; Ma, Çetin, & Green, 2009). For a mathematics test, the content domains are normally known, while the appropriate cognitive domains are not as easily identified as the content domains. So, one of the purposes of this study was to identify cognitive attributes with acceptable grain size, which can provide enough but not too much information about students’ cognitive abilities.
Challenges in developing the item-attribute matrix. “A successful skills
diagnosis critically depends on high quality Q matrix development” (DiBello et al., 2007, p. 6). Through simulation analyses or studies using real data sets, researchers found that the misspecification of the item-attribute matrix can cause serious consequences such as incorrect estimation of item parameters and attribute distribution, poor model fit,
misclassification of respondents, and wrong diagnostic inferences (Baker, 1993; de la Torre, 2008; de la Torre & Chiu, 2009; Fall & Templin, 2009; Henson & Templin, 2009; Im & Corter, 2011; Liu, Xu, & Ying, 2011a, 2011b; Rupp & Templin, 2008). Meanwhile,
19
it is a difficult effort to construct a Q-matrix to reflect relatively complex cognitive processes in solving problems. “In fact, little consensus exists as to how to identify attributes on a test, how to create a good Q-matrix, and how to validate or detect the misspecification of the Q-matrix” (Lee & Sawaki, 2009, p. 184). Although some studies of the Q-matrix have been conducted, generally speaking, selection and validation of the Q-matrix is still not well understood and needs further exploration.
According to Lee and Sawaki (2009), one challenge in developing the Q-matrix is that there is a limited conceptual foundation for many commonly used Q-matrix
constructions. Generally, domain or content experts identify the relationship between the attributes and test items according to a list of predefined attributes as well as their
knowledge and intuitions. To a certain degree, creating a Q-matrix is a subjective process (Baker, 1993; Chen, de la Torre, & Zhang, 2012; Lee & Sawaki, 2009); and “a proposed Q-matrix by content experts’ specification may not be identical to the ‘true’ Q-matrix” (Im, 2007, p. 2). Sometimes, multiple rater methods and item statistical parameters can assist in adjusting and reducing the subjectivity of judgment. However, sometimes it is difficult to reach a consensus due to disagreements among the raters and the complexity of assessments.
Challenges in developing the Q-matrix also come from examinees’ inconsistent response behaviors as pointed out by DiBello, Stout, and Roussos (1995, 2007), which result in different response patterns from those predicted by the Q-matrices. First are the issues of strategy and completeness in the Q-matrix. Many Q-matrices are constructed based on experts’ views about students’ responses to the test items. In practice, students may use different cognitive processes or strategies from those presumed by experts. For
20
example, Rho’s (2010) results indicated that the use of different solution strategies affected cognitive skill diagnosis. Under this situation, studying students’ protocols in test taking is a good way to validate a Q-matrix based on experts’ views (K. K. Tatsuoka, 2009). Also, some skills or cognitive processes affecting performance may not be
included in the list of proposed attributes. However, only the unified model and its extensive models acknowledge that a Q-matrix does not have to include all attributes using the completeness parameter. The second challenge is lack of perfect positivity, which shows that a respondent who has mastered all necessary attributes fails to answer an item correctly due to slipping, while a respondent who has not mastered all necessary attributes answers an item correctly through guessing. Some cognitive diagnostic studies incorporate this factor into the models. For example, the DINA and DINO models add slip and guessing parameters at the item level; and the NIDO and NIDA models restrict slip and guessing parameters at the attribute level. The third factor is the random error, such as when a respondent accidentally selects a wrong response category. However, many CDMs do not consider this factor.
The study of Q-matrices and CDMs is at a very beginning stage. Ongoing debates exist about the Q-matrix of the well-known rule space model. K. K. Tatsuoka and her associates’ rule space model has been applied to hundreds of studies, including large-scale assessments such as TIMSS, NAEP, and SAT. However, some researchers pointed out flaws in K. K. Tatsuoka’s Q-matrix theory, and the Boolean descriptive function is not appropriate for estimating examinees’ knowledge state using the Q-matrix (Ding, Zhu, Lin, & Cai, 2009). Moreover, in studies of the rule space model, K. K. Tatsuoka and her associates used addition and subtraction problems to explore classification of examinees
21
and students’ cognitive processes and misconceptions involved in solving arithmetic problems (Klein, Birenbaum, Standiford, & K. K. Tatsuoka, 1981; C. Tatsuoka, 2002, 2005; K. K. Tatsuoka, 1983, 1984, 1985, 1987, 1990, 1996, 2009; K. K. Tatsuoka,
Birenbaum, & Arnold, 1989; K. K. Tatsuoka, Linn, M. M. Tatsuoka, & Yamamoto, 1988; K. K. Tatsuoka & M. M. Tatsuoka, 1983, 1997). Among them, one fraction subtraction data set, which comprises the responses to 20 test items from 536 middle school students (K. K. Tatsuoka, 1984, 1990), was used by many researchers as a typical case for CDM research. K. K. Tatsuoka originally extracted seven attributes. Then, de la Torre and Douglas (2004) added one more attribute. But, besides this added attribute, their rest of the Q-matrix is not exactly the same as K. K. Tatsuoka’s Q-matrix. Based on a subset or the whole of this data set and one of the two above Q-matrices, researchers evaluated the exploratory technique in finding a Q-matrix, Q-matrix validation, relative and absolute model fit, consequences of misspecification of the Q-matrix and the cognitive model, and classification consistency and accuracy, or explored various cognitive models such as higher-order latent trait models, partially ordered latent classification models, the DINA and NIDA models, general DINA model framework, a model for multiple strategies of problem solving, and the log-linear CDM (Chen et al., 2012; Close, 2012; Close, Davison, & Davenport, 2012; Cui, Gierl, & Chang, 2012; de la Torre, 2008, 2009, 2011; de la Torre & Douglas, 2004, 2008; de la Torre & Lee, 2010; DeCarlo, 2011; Henson et al., 2009; Im, 2007; Im & Corter, 2011; Rho, 2010; C. Tatsuoka, 2002; Wang, Ding, Song, & Liu, 2012). However, using a logistic version of the DINA model, DeCarlo (2011) found that the structure of de la Torre and Douglas’ Q-matrix resulted in some neglected problems in the classification of examinees: for example, estimates of latent class size
22
were too large, close to unity; and examinees who incorrectly answered all items were classified as mastering most of the skills. The disagreements about the widely known CDM and Q-matrices indicate that there still exist many unsettled issues in building a reliable Q-matrix.
Studies of the item-attribute matrix. Although during the past thirty years, numerous CDA studies have been conducted and CDMs have been explored, “CDA is still in its infancy” (Leighton & Gierl, 2007, p. 3). Among CDA research projects, studies of the item-attribute matrix were relatively few in number. Fortunately, during the recent five years and especially in the past couple of years, more and more researchers realized the importance as well as the difficulty of developing a reliable Q-matrix. A summary of a thorough literature review of the studies relative to the item-attribute matrix is found in Appendix A. Studies of the item-attribute matrix focus on three aspects: impact of Q-matrix misspecification on the estimation of item and person parameters and
classification of respondents; validation of the Q-matrix; and exploratory methods of developing a Q-matrix. Most of the studies investigated the consequences of Q-matrix misspecification, while a few studies explored empirical approaches to validating cognitive attributes.
Impact of Q-matrix misspecification on model parameters and classification of respondents. In general, studies explored three types of Q-matrix misspecification: over-specification/fit, over-specification/fit, and mixed misfit with both over- and under-specification. The over-specified Q-matrix refers to unnecessary attributes being included (the entries of 0 are incorrectly specified as 1s), which leads to noise in the parameter estimation (Kunina-Habenicht, Rupp, & Wilhelm, 2012). The under-specified Q-matrix
23
refers to the required attributes being omitted (some entries of 1 are incorrectly replaced by 0s), which results in fewer item parameters to be estimated. Most studies assumed independence of attributes. Some studies assumed dependency between attributes (Rupp & Templin, 2008) or ordered relationships among attributes (DeCarlo, 2011; Im, 2007; Im & Corter, 2011).
Baker (1993) first conducted a systematic study of the misspecification of the Q-matrix using simulation. He investigated sensitivity of the linear logistic test model (Fischer, 1973) to misspecification of the matrix, sample size, and density of the Q-matrix. The LLTM assumes that the difficulty of items is a linear combination of a smaller set of latent cognitive attributes, and the entries of the Q-matrix were first introduced as the “weights” of cognitive operations in items. Thus, the Q-matrix is crucial to accurate parameter estimation in the LLTM. Baker set up six levels of random misspecification, which were defined by the percentage of misspecified elements in an error-free Q-matrix, from 1% to 10%. This study found that a small degree of Q-matrix misspecification (1% to 3%) could lead to a large impact on the item difficulty
parameters and basic parameters, while a higher misspecification (5% to 10%) seriously degraded the parameter estimation. The impact of Q-matrix misspecification was smaller with a dense Q-matrix (a matrix with more 1s, that is, solving items required more attributes) than with a sparse matrix (a matrix with more 0s). Compared to the Q-matrix misspecification, the effect of sample size was quite small.
In the study of a Bayesian framework for the reparameterized unified model (RUM), Hartz (2002) evaluated the effectiveness and robustness of RUM parameter estimation and examinee classification under the conditions that the user supplied
Q-24
matrix was less than ideal or not correct. The RUM is a diagnostic model with parameters for both the relationship between items and attributes and examinee attribute profiles. The big difference between the RUM and other CDMs, which may be the important advantage of the RUM, is that the RUM encompasses attributes that are not included in the Q-matrix. In the study, Hartz examined the Q-matrix with a weaker than ideal relationship between the attributes and the items (i.e., higher item discrimination for the relative attributes r*). She found that although most of the parameters were well
estimated, the estimation of the attribute completeness index (c) was less accurate and the power of the examinees classification was reduced. Normally, a more complex Q-matrix resulted in a less accurate estimation of the parameters. After increasing the average number of attributes per item from two to three, the parameter estimation of the 40 items was still very good; and the examinee classification rates were slightly reduced. Results indicated that for both the Q-matrices with two or three attributes per item, the RUM was an effective diagnostic model. However, when the entries of the Q-matrix became more complex, the accuracy of parameters would be impacted greatly.
Also, Hartz (2002) investigated the performance of RUM parameter estimation with three types of Q-matrix misspecification: inclusion of an extra attribute, exclusion of a required attribute, and an item specified with severely incorrect attributes. The first two types of misspecification involved change in the total number of attributes, which were different from the misspecification in some studies with only a few entries over-specified or under-specified while the total number of attributes was fixed. The results showed that inclusion of an extra attribute did not affect the item parameter estimation and examinee attribute classification; and the extra attribute was excluded from the parameter analysis.
25
Second, eliminating a necessary attribute from the whole Q-matrix significantly impacted the completeness indices (c) of the items that required the missing attribute, all of which were present in the final model and were significantly under-estimated. Because of the inclusion of the c parameter and the examinee ability parameter (θ), the estimation of the item parameters to the other attributes were not influenced, and the attribute classification rates were slightly reduced, but acceptable. Third, when an item was completely
misspecified with attributes which did not generate the item’s response, only the parameters of the misspecified item were affected. Although this study indicated the robustness of RUM to the less-ideal cognitive structure and the misspecified Q-matrix, the misspecified Q-matrix, especially missing important attributes, generated less satisfactory parameters.
Im and Corter investigated the statistical consequences of attribute
misspecification in the rule space method (Im, 2007; Im & Corter, 2011). They examined the impact of two types of attribute misspecification (exclusion of an essential attribute and inclusion of a superfluous attribute) and the ordered relations of an excluded/included attribute with the other attributes. The essential attributes refer to the attributes required to solve the problems, whereas the superfluous attributes mean those unnecessary attributes. A simulation study displayed the opposite impact of the two kinds of attribute misspecification on examinees’ attribute mastery probabilities. Excluding an essential attribute tended to lead to underestimation of mastery probabilities, while including a superfluous attribute generally led to overestimation of mastery probabilities. The impact of attribute exclusion was higher than attribute inclusion on examinees’ mastery
26
classification consistencies of examinees’ attribute mastery. Meanwhile, the impact of attribute misspecifications was mediated by the order relations among attributes. When an essential attribute in the subset of some remaining attributes was excluded, examinees’ mastery probabilities were underestimated or remained the same; whereas when an essential attribute in the superset of some remaining attributes was excluded, examinees’ mastery probabilities were overestimated or remained the same.
Rupp and Templin (2008) investigated the effects of Q-matrix misspecification on item parameter estimates and respondent classification accuracy for a simple but
restricted CDM—the DINA model. A simulation study examined four types of Q-matrix misspecification: an underfitting, an overfitting, a balanced misfit (exchanging 0s and 1s while the overall numbers of 0s and 1s were held constant), and attribute misspecification under incorrect assumptions about attribute dependencies. The results showed that when the required attributes were incorrectly deleted, the slipping parameter was overestimated most strongly; on the other hand, when unnecessary attributes were added, the guessing parameter was overestimated most strongly. For those items that did not involve
misspecified attributes, the item parameters were not affected. Also, the misspecifications in the Q-matrix resulted in misclassifying the respondents. Under the context of balanced misfit, a large number of misclassifications existed. The four kinds of misspecification indicated that omitting certain attribute combinations led to completely misclassifying the respondents with such attribute combinations. However, the degrees of misclassification for different attribute patterns were not the same. The attribute class with all attributes present or absent did not show large elevations in the misclassification rates.
27
Following this, Henson and Templin (2009) explored the impact of a misspecified Q-matrix on the item and examinee parameters of a complex model—the RUM (Hartz, 2002). The RUM involves five parameters: probability of a correct item response (π*) when all required attributes are mastered; reduced proportion of item response probability (or item discrimination for the relative attributes, r*) when the kth attribute is not
mastered; attribute completeness index (c); proportion of examinees mastering each attributes (pk); correlation of attribute pairs (ρ), which lead to the correct classification
rate. This study analyzed the three types of Q-matrix misspecifications: over-fit, under-fit, and a combination of both. The variation of the estimates was tested by computing the mean deviation, mean absolute deviation, and the root mean squared error of all the parameters. Also, the study examined the correct classification rates. The results showed that robustness of the RUM statistical inference to the misspecified Q-matrix heavily depended on the type of misspecifications. Specifically, when the Q-matrix was over-specified and the parameter c was included, the Q-matrix misspecification had little impact on parameter estimation; whereas the under-specified Q-matrix affected seriously most parameter estimates such as: underestimating c, and pk, and overestimating r*, ρ,
and the correct classification rate. When both the over- and under- misspecifications existed in the Q-matrices, the parameter estimates were affected moderately or strongly. The results also indicated that when the attribute completeness index c was excluded, the errors of estimation caused by the Q-matrix misspecification were worse. Based on the findings, the researchers suggested that one should identify those required, or possibly required, attributes for each item, but being careful not to assign an attribute when much uncertainty exists.
28
Within a Bayesian framework, Zhang and Rupp (2009) explored how prior informative specification for item parameters compensated for a potential
misspecification of the Q-matrix, especially for relatively small respondent sample size (n = 250 and 500). The study involved two types of Q-matrix misspecification: (a) items measuring two attributes were replaced by items assessing one attribute; and (b) balanced attribute misspecification (exchanging 0s and 1s while the overall numbers of 0s and 1s were held constant). The researchers compared the item and person estimates of two Bayesian DINA models, one with and another without informative priors—reasonable true values for each item parameter. The simulation analyses showed that the Q-matrix misspecification resulted in strong bias in the estimation of the relative item parameters (slipping and guessing) and person parameters (the latent class distribution, the correct classification rate across attribute patterns, the marginal correct classification rate for each attribute, and the tetrachoric correlations between attributes). More respondents were incorrectly classified into the group lacking attribute mastery.
Shu, Henson, and Willse (2010) implemented Q3 (Yen, 1984) to detect
misspecification of skills/attributes in the Q-matrix within the DINA and DINO models. Q3 is a measure of local item dependence in IRT analysis. It is defined as the correlation of residuals of the pairwise items, Q3 = rd1.d2 (d1 and d2 are the deviations of two items).
“Theoretically, the covariance in the response data should be fully explained by the underlying attributes and thus Q3 is expected to be zero if the underlying attributes are correctly specified in the Q-matrix” (Shu et al., 2010, p. 9). A non-zero Q3 indicated that the attributes of the items did not explain the items well; and a large value of Q3