1994A&A...283L..13Q
Astron. Astrophys. 283, L13~L16 (1994)
Letter to the Editor
ASTRONOMY
AND
ASTROPHYSICS
Maximum-entropy maps of the Be shell star
~
Tauri
from optical long-baseline interferometry
A. Quirrenbach
1•2,3,D.F. Buscher
1.2,D. Mozurkewich
1•4, C.A. HummeJ
1.2,and
J.T.
Armstrong
1•21 NRL/USNO Optical Interferometer Project; U.S. Naval Observatory, AD5; 3450 Mass. Ave., NW; Washington, DC 20392-5420, USA
2 Universities Space Research Assocation (USRA); 300 D Street, SW, Suite 801; Washington, DC 20024, USA
3 Present address: MPI ftir Extraterrestrische Physik, Postfach 1603, D-857 48 Garching bei Miinchen, Germany
4 Remote Sensing Division, Naval Research Laboratory, Code 7215; Washington, DC 20375, USA
Received 9 December 1993 I Accepted 13 January 1994
Abstract. We present the. first maximum-entropy maps re-constructed from visibility amplitudes obtained with an opti-cal long-baseline interferometer. They show the Be shell star ( Tauri. In the continuum at 550 nm the star is an unresolved point source, whereas in the light of the Hac line an extended, elongated structure is observed. The best-fit parameters of an elliptical Gaussian model are: major axis a
=
3.55±
0.33 mas, axial ratio r=
0.30±
0.03, position angle ¢>=
-59°±
4 °. The morphology of the Hac emission region is most easily in-terpreted as a disk seen almost edge-on; if this disk is axially symmetric, a limit for the inclination i2:
73° can be derived. Our observations provide further evidence for the equatorial disk model of Be stars.Key words: Techniques: interferometric ~ Stars: emission line,
Be~ Stars: imaging ~Stars: individual: (Tau~ Stars: mass-loss
1. Introduction
While stellar long-baseline interferometry has become a very successful tool to measure stellar diameters (e.g. Mozurkewich et al. 1991) and to determine "visual" orbits of close binaries (e.g. Armstrong 1992), extraction of more detailed informa-tion about the stellar brightness distribuinforma-tion from the visibil-ity data remains a considerable challenge. The first notable achievement in this area was the measurement of Sirius' limb darkening by Hanbury Brown et al. (1974) with the Narrabri intensity interferometer. Possible structure in (3 Andromedae was inferred from I2T data at 1.65 and 2.2 f.LID by DiBenedetto and Bonneau (1990). Observations with the Mkiii interferome-ter have shown that Mira's atmosphere is strongly asymmetric and changes shape on the timescale of months (Quirrenbach et al. 1992). The Hac emission region of the Be star 1 Cassiopeiae has been observed with the I2T (Thorn et al. 1986), GI2T (Mourard et al. 1989), and Mkiii (Quirrenbach et al. 1993) instruments; the results support the long-standing picture of a rotating disk-shaped envelope.
Send offprint requests to: A. Quirrenbach (Garching address)
Whereas the interpretation of these data sets has been based on fitting models with a small number of free param-eters to the measured visibilities, future interferometric arrays will rely on methods similar to those currently used in radio interferometry to reconstruct the sky brightness distribution. These algorithms have already been adapted for the analysis of data obtained with aperture masks on large telescopes (Haniff et al. 1988, Buscher et al. 1990). Closure phase information will be crucial to obtain images with high fidelity and dynamic range using instruments such as the Big Optical Array1 (BOA),
the ESO Very Large Telescope Interferometer (VLTI) and the Cambridge Optical Aperture Synthesis Telescope (COAST). It is possible, however, to obtain images of simple objects from amplitude data only. Here we present a maximum-entropy re-construction of the Hac disk of the Be shell star ( Tauri from data obtained with the Mkiii Optical Interferometer.
2. The observations
( Tauri (B4 IIIe, mv
=
3.0) was observed with the Mkiii instrument2 on 12 nights between Sept. 27 and Nov. 30, 1992;some test observations had been performed on Dec. 27, 1991, and Jan. 01, 1992. The Mkiii is a Michelson interferometer with a single north-south baseline, whose length can be varied between 3.0 and 31.5 m. In addition to the wide-band channel used for active fringe-tracking, three data channels are avail-able; their bandpasses are defined by interference filters. Auto-matic acquisition of the stellar images and of the fringes under computer control allows for rapid switching between different stars, so that observations of the program stars can be sand-wiched between calibrators with known diameters. With this observing strategy, an accurate calibration of the system visi-bility (i.e., the fringe contrast obtained on a point source), can be achieved as a function of seeing, zenith angle, and time. De-tailed descriptions of the instrument and observing procedures are given by Shao et al. (1988) and Mozurkewich et al. (1991).
1 The BOA is the imaging portion of the Navy Prototype
Op-tical Interferometer under construction at Lowell Observatory.
2The Mkiii Optical Interferometer on Mt. Wilson near Los
Angeles, CA, is operated by the Remote Sensing Division of the Naval Research Laboratory (NRL ).
Public reporting burden for the collection of information is estimated to average 1 hour per response, including the time for reviewing instructions, searching existing data sources, gathering and maintaining the data needed, and completing and reviewing the collection of information. Send comments regarding this burden estimate or any other aspect of this collection of information, including suggestions for reducing this burden, to Washington Headquarters Services, Directorate for Information Operations and Reports, 1215 Jefferson Davis Highway, Suite 1204, Arlington VA 22202-4302. Respondents should be aware that notwithstanding any other provision of law, no person shall be subject to a penalty for failing to comply with a collection of information if it does not display a currently valid OMB control number.
1. REPORT DATE
13 JAN 1994
2. REPORT TYPE3. DATES COVERED
00-00-2011 to 00-00-2011
4. TITLE AND SUBTITLE
Maximum-entropy Maps Of The Be Shell Star Zeta Tauri From Optical
Long-Baseline Interferometry
5a. CONTRACT NUMBER 5b. GRANT NUMBER
5c. PROGRAM ELEMENT NUMBER
6. AUTHOR(S) 5d. PROJECT NUMBER
5e. TASK NUMBER 5f. WORK UNIT NUMBER 7. PERFORMING ORGANIZATION NAME(S) AND ADDRESS(ES)
U. S. Naval Observatory,3450 Mass Ave., N.W.,Washington,DC,20392
8. PERFORMING ORGANIZATION REPORT NUMBER
9. SPONSORING/MONITORING AGENCY NAME(S) AND ADDRESS(ES) 10. SPONSOR/MONITOR’S ACRONYM(S)
11. SPONSOR/MONITOR’S REPORT NUMBER(S)
12. DISTRIBUTION/AVAILABILITY STATEMENT
Approved for public release; distribution unlimited
13. SUPPLEMENTARY NOTES
Astronomy and Astrophysics, vol. 283, no. 2, p. L13-L16
14. ABSTRACT
We present the first maximum-entropy maps reconstructed from visibility amplitudes obtained with an
optical long-baseline interferometer. They show the Be shell star zeta Tauri. In the continuum at 550 nm
the star is an unresolved point source, whereas in the light of the H-alpha line an extended, elongated
structure is observed. The best-fit parameters of an elliptical Gaussian model are: major axis a = 3.55
+/-0.33 mas, axial ratio r = 0.30 +/- 0.03, position angle phi = -59 deg +/- 4 deg. The morphology of the H-alpha
emission region is most easily interpreted as a disk seen almost edge-on; if this disk is axially symmetric, a
limit for the inclination i greater than or equal to 73 deg can be derived. Our observations provide further
evidence for the equatorial disk model of Be stars.
15. SUBJECT TERMS
16. SECURITY CLASSIFICATION OF: 17. LIMITATION OF
ABSTRACT
Same as
Report (SAR)
18. NUMBER OF PAGES13
19a. NAME OF RESPONSIBLE PERSON a. REPORTunclassified
b. ABSTRACTunclassified
c. THIS PAGEunclassified
Standard Form 298 (Rev. 8-98)
1994A&A...283L..13Q Ll4
For the observations reported here, we used baselines rang-ing from 4.2 to 31.5 m. The main data channel was centered on the Ha line at 656 nm and had a width of 1 nm. A second channel at the same central wavelength, but 10 nm wide, was used for control purposes; this is necessary because the 1 nm. wide filter tends to attenuate the wings of the rather wide
Ha line. The third channel was centered at 550 nm and 25 nm wide; it was used to measure the stellar continuum for com-parison. Each individual observation ("scan") was 300 s long; this gave sufficient signal-to-noise on the program as well as calibrator stars in all channels. The observations were sched-uled in a way that would optimize the hour-angle coverage on the longer baselines; the resulting coverage of the Fourier (
uv)
plane for the combined data on ( Tauri from all nights in the narrow Ha channel is shown in Fig. 1.~
..
.s:: 0. c"
;; > 0 iJ..
0:::.
> 60 50 40 30 20 10 0 -10 -20 -30 -40 -50.
. .
-
~..
..
.
...
--
...
-.
l
-·
....
..
:
..
·:. ··t ~--. . . .J... • • - • • - - • • • - - • • • •..
~··.
:·..
: . I .-. .-. I I I I . . . I -I l l -I...
..
.
.
...
-60 L.___,__..___.__.J...___,L.~ -30 -20 -10 0 10 20 30 u [101 wavelengths)Fig. 1. Coverage of the Fourier ( uv) plane, for the data in the Ha channel.
3. Maximum-entropy mapping
The Mklll standard data reduction software incoherently in-tegrates the square of the visibility amplitude V.~w estimated from each 4 ms sample over the length of the scan, arid divides it by the system visibility, giving ~!1• The calibrated data can then be used by model fitting or image reconstruction programs similar to those used in radio interferometry. For the analysis of the ( Tauri data, we used an iterative maximum-entropy algorithm, which seeks to find the "smoothest" image which is compatible with the data. In each step, it calculates model visibilities from a test image, compares them to the data and computes
X;ed
and its partial derivatives, and modifies the im-age along the direction of the gradient ofx;ed-
>.S,
wherex;ed
is the reduced
x
2 ,>.
a Lagrange multiplier, andS
the image entropy (see e.g. Narayan and Nitnayanda 1984). Starting from a user-specified initial image (typically a point source at the origin on a low uniform background), the algorithm thus tries to converge to the image which hasX;ed
= 1 and maximum entropy. More detailed descriptions of the algorithm are given by Skilling and Bryan (1984) and Buscher (1993).1.{) Ul "0 c 0 u
(0)
Q) Ul 0 u L... 0E
1.{) I5
0
-5
milliorcseconds
Fig. 2. Maximum-entropy reconstruction of ( Tauri in the contin-uum channel centered at 550nm. Contour levels are 0.1, 0.2, 0.5, 1, 2, 5, 10, 20, 50, and 80% of the peal<.
1.{) 0 Ul "0 c 0 u Q) Ul 0 u L... ~
.E
1.{) I5
0
-5
milliorcseconds
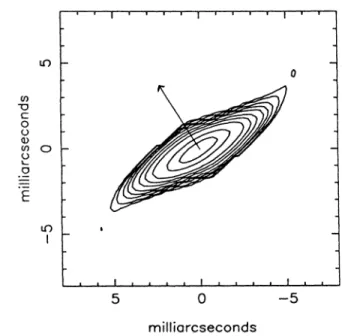
Fig. 3. Maximum-entropy reconstruction of ( Tauri in the Ha emis-sion line (656nm). Contour levels are as in Fig. 2. The arrow indi-cates the position angle of the linear polarization.
We tested the program using one night's data on the bi-nary star Capella (a Aurigae); it converged to an image with two pointlike stars at a separation and position angle in agree-ment with results from model fitting and from a new improved orbital solution (Hummel et al. 1994). During these tests we found that the convergence was substantially improved and the sidelobe level in the final image drastically reduced when V2
at zero spacing was explicitly set to 1. In principle, this effect is well-known in radio astronomical applications, but there the flux density at zero spacing is frequently not known precisely enough to aid the maximum-entropy algorithm significantly.
The photosphere of ( Tauri is expected to be almost
1994A&A...283L..13Q
resolved even on our longest baseline; estimates for the stel-lar angustel-lar diameter, based on photometric data, range from 0.4mas (Ochsenbein and Halbwachs 1982) to 0.6mas (Glush-neva 1987). Our data in the 550 nm channel show indeed only marginal indications of resolution; on the 31.5 m base-line V2 ::::::: 0.8. This allows us to set an upper limit of::::::: 1 mas on the size of the photosphere. Based on radial velocity varia-tions of the shell lines it has been argued that ( Tauri is in a binary system with period 132.91 days (Delplace and Cham-bon 1976). Since there is no signature of the secondary in our 550 nm data, we can set a limit on the magnitude difference
t..mv
2:
2.5 (unless the separation d2:
100 mas, which is in-compatible with the total mass, period and distance of the system). This is consistent with the finding by Floquet et al. (1989) that the presumed secondary cannot be a bright (lumi-nosity class II) giant, which would fill its Roche lobe.In Fig. 2, we present the maximum-entropy map of ( Tauri at 550 nm. This map is basically the point-source response cor-responding to our uv coverage; the apparent elongation in E- W direction is due to the fact that the resolution is substantially better in the N-S than in E-W direction (see Fig. 1).
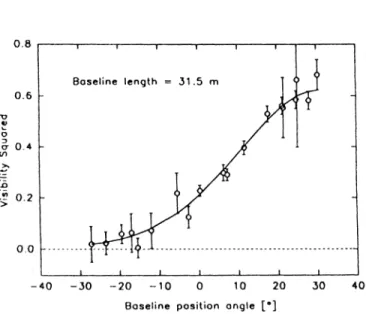
In the light of the Ha line, ( Tauri is clearly resolved and strongly elongated (in the projection onto the sky). Figure 3 shows the maximum-entropy map from the data taken in the 1 nm wide channel. The fit to the data is excellent, as can be seen in Fig. 4, where we superpose the model prediction on the data obtained on the longest (31.5 m) baseline. (The baseline position angle is the angle of the corresponding point in the uv plane, measured clockwise from the v axis.) It should be pointed out that the strong elongation of the Ha emission region is apparent directly from the visibility data: a spherically symmetric object would give visibilities that are symmetric with respect to meridian transit (baseline position angle 0°).
0.8 r----.----.----,---r----.----.--.-,----. 0.6 u ~ 0
6-
0.4 Vl -~ 0.2 0.0 -40 Baseline length 31.5 m -30 -20 -10 0 10Baseline position angle 20
( •]
Fig. 4. Visibility data in the 1 nm wide Ha channel from the longest (31.5m) baseline, and maximum-entropy model.
We have performed a series of tests with a number of dif-ferent starting models to verify that the maximum-entropy al-gorithm converged consistently to basically identical solutions. Nevertheless, it should be borne in mind that a
maximum-entropy "image" is nothing but a model representation for the data and thus susceptible to a number of artifacts.
First, the lack of phase information in our data will tend to favor a mirror-symmetric reconstruction. Our test with a reconstruction of the binary star Capella, which did not give a "ghost image" of the secondary, shows that this is not necessar-ily the case, however.
If
the object is fairly simple, amplitude data with sufficient signal-to-noise can produce asymmetric re-constructions. In the case of ( Tauri we cannot decide whether the structure of the envelope is indeed symmetric or whether the signal-to-noise in the data is not high enough to make the maximum-entropy program converge to an asymmetric solu-tion. Rapid variations of the emission line profiles (e.g. Yang et al. 1990) suggest that the Ha emitting region might be ei-ther asymmetric or not centered on the star (Telting et al. 1993). On the other hand, Thorn et al. (1986) find that the envelope of 'Y Cassiopeiae is in fact symmetric and centered on the star to within 0.3 mas. Future interferometric observations with longer baselines and high- quality phase information are needed to decide this question.Second, the asymmetric coverage of the uv plane will show up as an artificial elongation of the contour lines in E-W direc-tion, as discussed above. The continuum map in Fig. 2 can be used as a reference for the point-source response. It should be pointed out that maximum-entropy maps do not have a defined "beam shape". (To facilitate the comparison, the reproductions of the two maps have been scaled by the wavelength ratio.)
To derive numerical parameters for the Ha emission region, we have therefore also fitted a simple elliptical Gaussian model to the visibility data. The best-fit parameters of this model are: major axis a = 3.55
±
0.33 mas, axial ratio r = 0.30±
0.03, position angle c/1=
-59°±
4° (measured from north through east). The quoted errors are formal errors obtained from the increase ofx
2 when the parameters are varied; the value for rmight actually be smaller, since the size of the minor axis is very close to our resolution limit. This elliptical model gives a very good representation of the overall appearance of the maximum entropy map.
The total extent of the Ha emission region is ::::::: 10 mas (3 FWHM of the Gaussian model, see also Fig. 3), or about 15 photospheric diameters. This value agrees roughly with model predictions (e.g. Poeckert and Marlborough 1978).
4. Discussion
The observed axial ratio of the Ha emission region r
=
0.30 implies that the intrinsic geometry is strongly non-spherical. This result is inconsistent with nearly spherical models for Be stars (e.g. Doazan 1987) and provides additional evidence for a disklike structure. Both fairly thick (opening angle ,.__ 15°, Po eckert and Marlborough 1978) and very thin (opening angle ~ 0.5 °, Bjorkman and Cassinelli 1993) disks are consistent with our data; in the latter model it might be difficult to explain the strong shell absorption, however.Under the assumption that the disk is axially symmetric, a lower limit to the inclination of the axis i
2:
arccos 0.30=
73° is derived from a simple geometric consideration. The high in-trinsic degree of polarization (Poeckert et al. 1979, McDavid 1990) provides independent, although less direct, evidence for a large inclination of ( Tauri. Published values for v sini
range from 220 km s-1 (Slettebak 1982) to 320 km s-1 (U esugi and1994A&A...283L..13Q
L16
preferred (Yang et al. 1990). Gao and Cao (1986) have tried to determine the inclination of ( Tauri using a method proposed by Hutchings (1976), which is based on the comparison of op-tical and UV line widths; they found i ~ 60°. Combining these values for v sin i and i leads to conclusion that the rotation
rate of ( Tauri is very close to the critical value, w/wcrit
=
1 (Ruusalepp 1989). The larger inclination indicated by our data gives w/wcrit ~ 0.85, however, supporting the idea that Be starsdo not rotate at the critical velocity. Our limit for the inclina-tion is also consistent with the supposiinclina-tion that Be stars with shell absorption lines in the visible part of the spectrum are seen almost equator-on (e.g. Slettebak 1979).
The continuum polarization of Be stars is believed to be due to scattering by free electrons in the circumstellar disk (McLean 1979). This explanation predicts that the polariza-tion posipolariza-tion angle X should be perpendicular to the equatorial
plane. Poeckert et al. (1979) and McDavid (1990) find X~ 33°; with only a small interstellar contribution. The position angle
ljJ
=
-59°±
4° from our data is indeed perpendicular to X· 5. ConclusionsFor the first time, we have been able to reconstruct a max-imum-entropy map from visibility amplitudes obtained with optical long-baseline interferometry. This represents an impor-tant step towards routine imaging with milliarcsecond resolu-tion, the declared goal of the interferometric arrays currently under construction.
Our maximum-entropy map of ( Tauri in the Ha line should be interpreted with some caution, because of the lack of phase information and the non-uniform coverage of the uv plane. Nevertheless, it confirms several predictions of the equa-torial disk model for Be stars. While elongated structures have been observed for the radio emission of 'ljJ Persei (Dougherty and Taylor 1992) and for the Ha emission of 1 Cassiopeiae (Quirrenbach et al. 1993), the observed axial ratio is more ex-treme for ( Tauri. This allows tighter constraints to be placed on the intrinsic geometry; a meaningful lower limit to the incli-nation can be derived under the assumption of axial symmetry.
Future observations with longer baselines and improved uv coverage will give valuable additional information about' the shape and structure of Be star disks. The emission line regions of these and similar objects are particularly good targets of op-tical long-baseline arrays. The small central star can be used as a reference object for fringe tracking, and the line-continuum phase difference can be used directly for imaging; phase closure methods are not needed. This gives a large increase in phase in-formation for arrays with a small number of elements. Further-more, even data with moderate signal-to-noise will carry valu-able astrophysical information. (In contrast, the main goal of the BOA, namely imaging of stellar photospheres, requires ex-tremely high signal-to-noise and excellent calibration to detect small deviations from simple uniform or limb-darkened disk models.) Finally, a simple estimate shows that the BOA will be sensitive enough to put "' 10 spectral channels across the
Ha line. A combination of the approaches taken by Mourard
et al. (1989) and in this work will thus make detailed studies of the kinematics of Be star disks possible.
Acknowledgements. We thank C.S. Denison and L.W.
Raro-giewicz for their help with the data acquisition. A. Quirrenbach acknowledges support by a Feodor Lynen Fellowship from the
Alexander von Humboldt Foundation. Basic research in In-frared and Optical Interferometry at NRL is supported by the Office of Naval Research through funding document number N00014-93-WX-35012, under NRL work unit 1798. The max-imum entropy program uses the MEMSYS2 algorithm from Maximum Entropy Data Consultants, Ltd. We have made use of the Simbad database, operated at CDS, Strasbourg, France.
References
Armstrong, J.T., 1992, in IAU Call. 135, Complementary
Ap-proaches to Double and Multiple Star Research, ed. H.A.
McAlister and W.I. Hartkopf, ASP Conf. Ser. 32, p. 492 Bjorkman, J.E., Cassinelli, J.P., 1993, ApJ 409, 429
Buscher, D.F., 1993, in IAU Symp. 158, Very High Angular
Resolution Imaging, ed. J.G. Robertson and W.J. Tango,
Kluwer, in press
Buscher, D.F., Haniff, C.A., Baldwin, J.E., Warner, P.J., 1990, MNRAS 245, 7P
Delplace, A.M., Chambon, M.Th., 1976, in IAU Call. 70, Be and Shell Stars, ed. A. Slettebak, Reidel, Dordrecht, p. 79
DiBenedetto, G.P., Bonneau, D., 1990, ApJ 358, 617 Doazan, V., 1987, in IAU Call. 92, Physics of Be Stars, ed. A.
Slettebak and T.P. Snow, Cambridge Univ. Press, p. 384 Dougherty, S.M., Taylor, A.R., 1992, Nature 359, 808
Floquet, M., Hubert, A.M., Maillard, J.P., Chauville, J., Chatzichristou, H., 1989, A&A 214, 295
Gao, W., Cao, H., 1986, Acta Astrophys. Sin. 6, 143 Glushneva, I.N., 1987, AZh 64, 601
Hanbury Brown, R., Davis, J., Lake, R.J.W., Thompson, R.J., 1974, MNRAS 167, 475
Haniff, C.A., Mackay, C.D., Titterington, D.J., Sivia, D., Bald-win, J.E., Warner, P.J., 1988, Nat 328, 694
Hummel, C.A., et al., 1994, AJ, submitted Hutchings, J.B., 1976, PASP 88, 5
McDavid, D., 1990, PASP 102, 773 McLean, I.S., 1979, MNRAS 186, 265
Mourard, D., Bose, I., Labeyrie, A., Koechlin, L., Saha, S., 1989, Nature 342, 520
Mozurkewich, D., Johnston, K.J., Simon, R.S., et al., 1991, AJ 101, 2207
Narayan, R, Nitnayanda, R., 1984, ARA&A 24, 127 Ochsenbein, F., Halbwachs, J.L., 1982, A&AS 47, 523 Poeckert, R., Bastien, P., Landstreet, J.D., 1979, AJ 84, 812 Poeckert, R., Marlborough, J.M., 1978, ApJ 220, 940
Quirrenbach, A., Mozurkewich, D., Armstrong, J.T., Johnston, K.J., Colavita, M.M., and Shao, M. 1992, A&A 259, L19 Quirrenbach, A., Hummel, C.A., Buscher, D.F., Armstrong,
J.T., Mozurkewich, D., Elias, N.M., 1993, ApJ 416, L25 Ruusalepp, M. 1989, Tartu Astroph. Obs. Teated, No. 100, 1 Shao, M., Colavita, M.M., Hines, B.E., et al., 1988, A&A 193,
357
Skilling, J., Bryan, R.K., 1984, MNRAS 211, 111 Slett.ebak, A., 1979, Space Sci. Rev. 23, 541 Slettebak, A., 1982, ApJS 50, 55
Telting, J.H., Waters, L.B.F.M., Persi, P., Dunlop, S.R., 1993, A&A 270, 355
Thorn, C., Granes, P., Vakili, F., 1986, A&A 165, L13 Uesugi, A., Fukuda, I., 1982, Revised Catalogue of Stellar
Ro-tational Velocities, Kyoto University, Kyoto, Japan
Yang, S., Walker, G.A.H., Hill, G.M., Harmanec, P., 1990, ApJS 74, 595