Sidnei Franco (Brazil), Peter Wanke (Brazil), Maria Fernanda Hijjar (Brazil)
Satisfaction factors with the use of self-employed people in highway
transportation
Abstract
In Brazil, cargo transportation services are predominantly based on highways and depend mostly on self-employed people. This paper reports on a survey conducted with 105 shippers – listed at Ranking Exame Melhores e Maiores – to evaluate not only the major factors related to the satisfaction on the services provided but also to cluster shippers in terms of common requirements of transportation services. Results indicate three major groups of shippers, in which the service quality perceptions depend on the intensive use of self-employed people, on the aggregate tonnage transported per year and on the shipments’ required safety levels.
Keywords: factors, satisfaction, cargo transportation, for-hire trucking, shippers, clusters. Introduction1
The transportation activity is currently standing out in Brazil due to the need of a logistic structure that is adequate to sustain the economic growth of the country. Well conserved and signaled high-ways, efficient ports and railways and safe air-ports are constant subjects in the national media. After a long period without investments in the country’s logistics infrastructure, the Federal Government allocated R$ 503.9 billion to infra-structure investments in the period from 2007 to 2010, of which R$ 58.3 billion were directed to investments in the logistics area (PAC, 2008). With these investments, the governmental goal is to assure a 5% annual economic growth between 2008 and 2010 (Yoshida, 2007). In spite of the large amounts, whether this is enough to solve all of the most urgent bottlenecks is not known. The Brazilian Transports Confederation prepared a Logistics Plan for Brazil that estimates the needs of investments of R$ 224 billion (CNT, 2007b). The Brazilian transportation matrix shows the fol-lowing distribution among modals: 61.1% in the highway, 20.7% in the railway, 13.6% in the water-way, 4.2% in the pipeway and 0.4% in the airway (CNT, 2007a). The prevalence of the highway mo-dal generates enormous productivity problems due to the dimensions of Brazil. Countries of similar size such as the USA, Australia and China transport, respectively, 26%, 24% and 8% of its cargo, through the highway modal (Fleury, 2003a).
Add to this the fact that highway transportation is treated by public entities as a free market. Thus, there is no specific legislation or requirement to enter and exit the market. The figures of authoriza-tion, permission and concession are not present in this activity (ANTT, 2008a). The highway transpor-tation stands out from the other modals because it
© Sidnei Franco, Peter Wanke, Maria Fernanda Hijjar, 2008.
has large flexibility since automotive vehicles can operate in any way available. The need for small investments in assets makes highway transportation much attractive for self-employed people. Data from the National Terrestrial Transportation Agency (ANTT) show that 56.53% of the vehicles registered with the National Cargo Highway Transportation Registry belong to self-employed people against 43.05% belonging to companies and 0.42% to coop-eratives (ANTT, 2008b).
The high percentage of self-employed people in operation providing the service of highway transpor-tation of cargo causes an enormous impact in the sector. The companies’ expectations in relation to the services provided and, accordingly, satisfaction, vary a lot. Companies with different levels of logis-tic sophislogis-tication make use of service providers with different capabilities (Wanke et al., 2007). The pro-viders of highway transportation may try to adapt their offer to the demands of their customers, but for this to be possible, it is necessary first that the cus-tomer satisfaction factors, in relation to the aspects of the transportation service, present a common pattern. Discovering whether this actually occurs led us to define the first purpose of this research: to determine whether the shippers present common patterns of satisfaction with the service that is pro-vided to them by highway carriers.
The grouping of shippers, based on these factors or common satisfaction patterns, would permit the carriers to improve their service level in the as-pects that are relevant to each kind of shipper. However, there are technical and financial diffi-culties when one tries to meet all groups. The possibility of distinguishing the shipper groups with different levels of satisfaction by demo-graphic characteristics would be very useful for the carriers permitting a better positioning in the market. Due to the wide use of self-employed people in the highway cargo transportation mar-ket, the percentage cargo transported by these
professionals was the first characteristic chosen to distinguish the groups. The second characteristic was chosen because it is a relevant piece of data in the planning of transportation, the total tonnage transported on an annual basis. Thus, we reached the second purpose of this research: to determine whether it is possible to distinguish the groups with different satisfaction levels according to these two demographic characteristics.
The paper is organized as follows. A general view of highway transportation in Brazil, the relevance of the subject and the purposes of the work are presented in the Introduction. The first section presents the review of the literature. The second section presents the questions to be answered, defines the universe and the sample, the way how the data were collected, the methodology used for the analysis and its justification. The third section analyzes the results obtained from the review of the literature. The fourth section, in turn, dis-cusses these results. Finally, the last section closes the article, with the conclusions reached and suggestions for future studies.
1. Cargo transportation and the use of self-employed people
Chopra and Mendl (2006) assert that cargo transporta-tion moves products among different points in the supply chain and is one of its key factors, exercising high influence on the chain’s capacity of being both fast or reliable and efficient. For the authors, as much as transportation is concerned, the fundamental choice for the managers of supply chains is to decide between the cost of transporting a certain material and the speed at which the material is transported. For instance, one may opt for a higher transportation cost to have higher speed or manage lower transportation costs with longer terms for delivery.
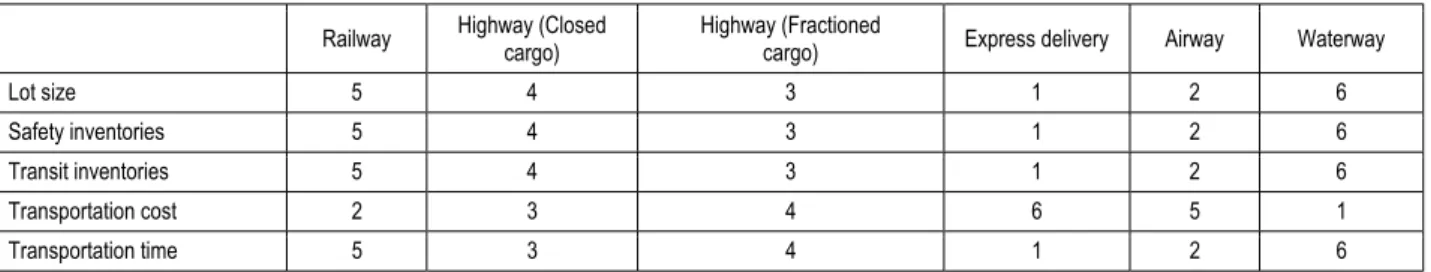
The authors also indicate the performance character-istics of the several modals of transportation avail-able and their impact on the performance of the supply chain in relation to the size of the transported batches, security inventories, transit inventories, costs of transportation and transportation time. The relations between these criteria and the different modals are shown in Table 1.
Table 1. Impact of the transportation means on the performance of the supply chain
Railway Highway (Closed cargo)
Highway (Fractioned
cargo) Express delivery Airway Waterway
Lot size 5 4 3 1 2 6
Safety inventories 5 4 3 1 2 6
Transit inventories 5 4 3 1 2 6
Transportation cost 2 3 4 6 5 1
Transportation time 5 3 4 1 2 6
Source: Chopra and Mendl (2006).
Referring to Brazil, Nazário (2000) affirms that, because a reduction in logistic costs and higher reli-ability in the service provided are increasingly more demanded, the use of more than one modal arises as a great opportunity for companies to become more competitive, since the highway modal prevails in Brazil’s transportation matrix, even for prod-ucts/segments in which it is not the most competi-tive. However, Fleury (2003b) numbers four large problems in highway transportation in Brazil:
i Informality and fragmentation of the sector – about 50% of the national fleet belongs to self-employed people, 20% to companies with their own fleet and 30% to carriers. In relation to transportation companies, there are around 40,000 of them in Brazil, and 85% have less than 50 employees.
i The aging of the fleet because of incapacity of renewal – the national fleet of cargo vehicles is in average 18 years old. Besides, 87% of the carrier companies do not have a fleet renewal program.
i Insecurity – the robbery of cargo has been increasing. From 1994 to 2001, the number of occurrences registered soared from 2,500 to 7,500. In the same period, the value of the stolen goods increased from R$ 100 million to R$ 500 million.
i Lack of regulation and inspection of the highway transportation sector which generated an excessive bad-quality offer and led to harmful operating practices and to prices that render it impossible to renew the fleet. Due to these characteristics, the price of highway freight charged in Brazil is 2.8 times lower than that charged in the USA.
Dealing with the same subject, Candido (2004) says that the exceeding offer of freight caused by a fleet in very bad conditions contributes to reduce prices, because there is excessive offer. To assure mini-mum cargo, self-employed carriers end up by sub-mitting to work in totally improper conditions, which makes the self-employed carrier to work in
periods that are longer than permitted by legislation, traveling with excessive cargo and driving at speeds that are excessively high or improper to the condi-tions of conservation of the ways.
According to a study performed by the Logistics Study Center (2002), the sector is tied to vicious circle. Low barriers to the entry and high barriers to the exit generate more offer than demand. The ex-cessive offer makes freight prices diminish. The carriers start to have more difficulties to obtain cargo. Pressed by low prices and by idleness, self-employed carriers start to adopt predatory competi-tion practices, such as excess in weight, in worked hours and speed and lack of proper maintenance. The installed capacity increases even more due to the practice of excessive weight and speed. With higher capacity, the price is further reduced thus feeding the vicious circle. As a last consequence, we have the impossibility of renewal of the fleet, which leads companies to depend more and more on self-employed people.
In Brazil, self-employed people are responsible for a large part of the trucks in circulation, having an important role in the economy of the country, espe-cially in long-distance cargo transportation. In many cases, these professionals work in partnership with carriers, which hire them normally in case of peaks in demand and in long-distance transportation. In these cases, the fixed costs are the responsibility of the owner of the hired vehicle (Valente et al., 1997). The simultaneous use of a driver hired by the company, as well as a self-employed truck driver owning his own vehicle is also found in Brazil, with higher tendency towards the use of the latter, because they provide more agility and flexibility in the distribution of vehicles. Besides, a growing complexity in employment relations is observed, reinforced by outsourcing practices that dissimu-late the subordination relationship between the parties. It is highlighted, however, that the activi-ties developed by drivers and truck owners in Brazil in the sector of vehicle transportation are almost the same, although, the subordination rela-tionships are not formalized by an employment agreement (Chahad and Cacciamali, 2005).
In several countries, many drivers have changed from the regular position of employees to the status of outsourced employees, or of self-employed truck drivers, organized under the legal form of self-employed people or entrepreneurs, that must have their own truck, or even rent it, performing almost the same services that they used to perform when they were regularly em-ployed (ILO, 2003).
As a general rule, this process ends up in a move-ment of transfer of those workers with a permanent employment relationship, absorbed by carriers, to the situation of outsourced workers, or of self-employed truck drivers, organized under the legal form of self-employed people (or entrepreneurs), that must have their own truck, or even rent it, per-forming almost the same services that they used to perform before, under the condition of an employee (ILO, 2003). Similar situations may be observed in several countries (ILO, 2003).
In Germany, the number of the so-called independ-ent drivers has increased considerably in the last few years. Under an alleged “transportation” contract, they drive the trucks in favor of someone else, but on an autonomous service basis. The large majority of them works only to one contractual partner, with-out employing anyone else, and using a truck lent by the producer or contractual partner, which gives him a schedule of hours and limited route, demanding exclusiveness and fixed remuneration.
In Argentina, the situation of a self-employed truck driver, as applicable, has been considered in the position of “independent worker with position of dependence”. Moreover, there is the practice of encouraging the driver to work as an independent professional, in the same companies that dismissed him and from which he receives facilities to acquire his own vehicle.
This practice in Finland is known as “involuntary employers”, in which many drivers work for the same employer, from which they have rented a truck within a pre-established rental plan.
In Japan, in “transportation agreements”, the self-employed truck driver is the owner of the vehicle, and is in charge of the expenses with maintenance and fuel, as well as other fees, including social security. Many of these workers are submitted to a strong dependence relation, because they work for one single company. In that, and in other countries, many times, the truck owned by the worker has to clearly show the brand, the label or logo of the main company.
In Australia, there are few barriers to the entry of self-employed truck drivers in the transportation sector. However, the high level of indebtedness contracted by the truck driver and the excess in the offer of workers in this situation favor the weaken-ing of the bargainweaken-ing conditions of these workers, increasing their situation of dependence.
As a consequence, virtually in all around the world, a material change has occurred in the work conditions of this occupational class, the impact of which on the
employment relations of the sector depends on the legal system of each country, as regards their rigidness and flexibility, and also to the structure of costs in the highway transportation sector of each country.
A spread in the subcontracting (outsourcing) com-panies has occurred that assures the offer of labor force and the provision of services to the final em-ployer, but that ends up by covering a dependence relationship that legally and clearly prevailed up to then. This situation has caused a disarticulation in the employment market of truck drivers, as well as relative disorganization of the offer of this occupa-tional class, even because the worker in self-employed and independent status has difficulties to structure himself as a syndicate (ILO, 2003).
Nickerson and Silverman (2003) affirm that the employment relationship in carrier companies com-prises a “tolerance zone” that is different from those observed in relation to the traditional contractual relations, associated to other forms of organization of work. It can be noted that drivers with regular employment relationships are easier to manage than independent workers, like subcontracted self-employed truck drivers.
Hart and Moore (1990) highlight that this occurs due to the ownership of the truck. The possession of this asset results in different positions of bargain when the contract is broken. This difference in bargaining power affects the cooperation and the relationship between the company and the worker, which means that the “tolerance zone” is not the result of the mindset of one of the parties, but re-sults from the fact that the ownership by the com-pany of the physical assets, in this case, the truck, restricts the options of the contracted driver, which does not occur when a self-employed truck driver is subcontracted.
According to Chahad & Cacciamali (2005), al-though the truck is no longer owned by the com-pany, becoming an instrument of work of the truck driver, it represents the use of a more flexi-ble form of capitalization, the investment and maintenance of which it (the company) relayed to the truck driver.
The same authors affirm that the occurrence of different arrangements of organization of work in the sector of highway transportation, resulting from the search for higher efficiency and quality in the chain of this step of value in the production process, aiming at the construction of more com-petitive markets, imply covered employment rela-tionships, characterized by direct dependence on one single company or employer.
The change in work relationships clearly affects the issue of risk and insurance of cargo. The specializa-tion in the management of cargo insurance in trans-portation companies is a characteristic of a small number of companies. This ends up by being detri-mental to the sector, as regards the management of risk, in particular that of robbery, because compa-nies may not be using the proper coverage for each situation, or may not even be aware of the impor-tance of insurance in the current context (Gameiro and Caixeta Filho, 2002).
This lack of specialization, as one would expect, is more evident in smaller carriers which affirm that they have much difficulty in the management of cargo insurance. These companies, accordingly, may face offer problems when demanding insurance for the robbery of cargo as they do not have a proper risk management policy from the view of bro-kers/insurers (Gameiro and Caixeta Filho, 2002). The evaluation of the carriers in relation to the be-havior of shippers has also presented an interesting result as long as it shows that there would be a cer-tain lack of communication between the two parties (Gameiro and Caixeta Filho, 2002). According to carrier companies, most shippers are not using the insurance that is mandatory and higher liability, therefore, falls on the carriers (Gameiro and Caixeta Filho, 2002).
The robbery of cargo, when evidenced to have re-sulted from force majeure, is no longer character-ized as the carrier’s liability. In these cases, it is the insurance of the shipper that must indemnify it for the losses occurred. As this is a little used insurance, there is much pressure on the carriers for them to be held liable for the occurrence. On the other hand, if the liability of the carrier for the occurrence of the event is confirmed, it is its insurance that must be called (Gameiro and Caixeta Filho, 2002).
Besides such omission of the shippers, most carrier companies affirm that they are unaware of the fact that the cargoes that are being delivered to them for transportation are covered by the shipper’s insur-ance. This, in a certain way, illustrates the “lack of communication” between shippers and carriers, which should be reviewed by them in view of the imminent risks of the activity (Gameiro and Caixeta Filho, 2002).
There is also the issue of evaluating the cargoes transportation service as a whole. In research carried out by Gibson et al. (2002), where the shippers were mostly represented by manufacturers of parts of components and final products (68%), it was shown that cost is the highest importance item for shippers when they consider partnerships with carriers. The
research attributed to the price the highest impor-tance in relation to the satisfaction of the shipper. Both shippers and carriers present extremely low satisfaction in relation to the performance of the other party to control, reduce and remove the opera-tion costs, showing that this area needs attenopera-tion, once it is not possible that only one of the parties carry out all efforts to reduce the costs.
In turn, Hopkins et al. (1993) applied a questionnaire to shippers of several industries and transportation companies that use the main modals (airway, highway, railway and waterway). The article concluded that, in the transportation industry, a highly important factor for satisfaction is not the compliance with promises made by the carriers to the shippers.
In short, distinct segments of clients emphasize dif-ferent components in the quality of the logistic ser-vice (Mentzer et al., 2001). However, there are simi-larities through the clients segments. Thus, the lo-gistic managers must be able to develop processes that apply to all the segments. The quality of the personal contact had a positive impact on the per-ception of the service by all segments studied. The managers must evaluate which aspects are more relevant for the segments they serve. If there are common aspects, it is possible to optimize resources in an attempt to increase the clients’ satisfaction. In case the needs of the segments are different, they must try to customize their service to serve a spe-cific segment. This kind of procedure enables logis-tics to be seen not only as competitive advantage capable of improving efficiency by reducing costs, but also improving the efficiency of marketing through the customization of processes that generate higher profit for the companies.
2. Objectives and methodology
Observing the first purpose of this research that is to determine whether the shippers present common patterns of satisfaction with the service that is pro-vided to them by the highway carriers, we present the first question:
1. Do shippers of cargo for highway transportation present similar common patterns of satisfaction? In order to answer this question, the following null hypothesis was stated:
H0,1: There are no patterns of satisfaction that are common to the shippers of cargo for highway transportation.
Observing the second purpose, of determining whether it is possible to group the shippers based on these common satisfaction patterns, we present the following question:
2. Can groups be distinguished among them accord-ing to the tonnage transported on an annual basis and according to the percentage of transportation carried out with self-employed people, permitting the carriers to opt for a positioning to serve one of them and the consequent customization of their ser-vices?
In order to answer this question, the following null hypothesis was stated:
H0,2: The tonnage transported per year by highway modal and the percentage of transport carried out with self-employed people do not distinguish groups.
The universe of this survey is comprised by all shippers of cargoes for transportation through the highway modal. Due to the large number of panies that comprise this population, covering com-panies of the most different sizes, fields of activities and different administrative practices, it was neces-sary to limit the sample. In order to define the sam-ple, we started from the 379 shippers of highway cargo listed among the 1,000 largest companies in Brazil in the year of 2004, according to the list pub-lished by Exame magazine in the year of 2005. The survey was carried out in the period from May 1st to June 22nd, 2006. Before the sending of the questionnaires, telephone contact was made with the target companies, explaining the purposes of the survey and consulting the companies about their interest to take part in it. This procedure is justified, once the number of contacts, customized contacts and prior contacts were associated to the high rates of response in survey carried out by Internet (Cook et al., 2000). This way, 379 companies were willing to answer the questionnaire.
The questionnaire was prepared in a spreadsheet in Microsoft Excel software. It was sent attached to an e-mail with the guidance on the purposes of survey and the filling of the spreadsheet. During the period of the survey, several telephone calls were made to the companies aiming at increasing the rate of an-swers. By the end of the period, 113 questionnaires had been received. From these, two were discarded because they did not have their data validated. From the remaining questionnaires, six were eliminated because they did not have all answers that referred to the satisfaction with the carriers of cargoes through the highway modal, which would make the use of the questionnaires unfeasible for this survey. Thus, 105 questionnaires remained, totaling 27.7% of valid answers.
The use of surveys using correspondence as a form of collection of data is the subject of some criticism
in relation to the possibility of material differences between the profile of respondents and non-respondents and the best way to minimize this error is to keep the percentage of non-respondents below 30% (Armstrong and Overton, 1977). As the survey obtained a non-respondents rate above this value, we opted for comparing the known demographic characteristics of the universe to the characteristics of the sample. This was made by cross-tabbing the frequency of distribution by the different industries of the respondents in comparison with the same distribution in the universe of the survey. The tests were made by using Goodman and Kruskal’s Gamma, Kendall’s Tau-b and Kendall’s Tau-c (Rodrigues et al., 2004).
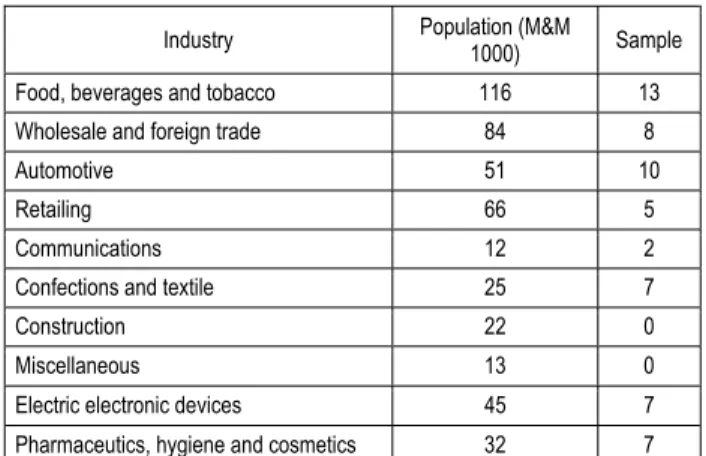
The distributions of the companies among the sev-eral industrial segments, both in the universe and in the sample, are presented in Table 2.
Table 2. Distributions of companies among the in-dustries
Industry Population (M&M
1000) Sample Food, beverages and tobacco 116 13 Wholesale and foreign trade 84 8
Automotive 51 10
Retailing 66 5
Communications 12 2
Confections and textile 25 7
Construction 22 0
Miscellaneous 13 0
Electric electronic devices 45 7 Pharmaceutics, hygiene and cosmetics 32 7
Cleaning 2 1
Construction material 26 5
Mechanics 16 1
Mining 16 1
Others 1 0
Paper and cellulose 19 8
Plastics and rubber 16 0
Chemicals and petrochemicals 87 12
Transportation services 38 0
Miscellaneous services 61 0
Public services 118 0
Steel and iron industry and metal work 69 13
Technology and computing 29 2
Telecommunications 36 3
Total 1000 105
Kendall’s Tau-b and Tau-c and Kruskal’s Gamma non-correlation tests are shown to be significant, assuring that the sample adheres to the population and that, this way, there are no material differ-ences between the distributions among the indus-tries found with the population and to the sample (cf. Table 3).
Table 3. Cross-tabbing between sample and population
Test Value Relevance
Kendall's Tau-b 0.398 0.011 Kendall's Tau-c 0.397 0.011
Gamma 0.424 0.011
Finally, the nomenclature of variables collected, the dimensions evaluated and the type of scale, with their description, are presented in Table 4.
Table 4. Variables collected and scales used
Dimension Variables Scale adopted Type of
scale Hypothesis 1
1. Average performance in relation to all carriers 1 (Lowest satisfaction) to 10 (Highest satisfaction)
Ordinal
Satisfaction in relation to the carriers
2. Availability of vehicles and equipment. 3. Price charged.
4. Conditions of vehicles and equipment. 5. Consistency in deadlines
6. Speed.
7. Integrity of the cargo. 8. Qualification of personnel. 9. Variety of services offered.
10. Solutions proposed for the improvement of activities. 11. Technological sophistication.
12. Geographic area of operation. 13. Availability of managerial information. 14. History of non-involvement in accidents. 15. History of non-involvement in robbery.
1 – Very High satisfaction 2 – High satisfaction 3 – Medium satisfaction 4 – Low satisfaction 5 – Very low satisfaction
Ordinal
Hypothesis 2
Volume of operation 16. Tonnage transported per year through the highway modal. 0 to 100 Ratio
Ownership of the fleet 17. Percentage of the highway cargo (in tons) transported by self-employed
3. Analysis of the results
3.1. Common satisfaction patterns. The first step was to verify whether the researched variable that dealt with the perception of average satisfaction of the ship-pers with the carriers (variable 1) was related to the perception of satisfaction with several aspects of the highway transportation service provided (variables 2 to 15). Kendall’s Tau-b non-parametric correlation test was used, as this is a more appropriate test permitting a more accurate correlation than the Spearman’s test (Field, 2005). As we seek to evidence whether the increase in satisfaction positively affects the perception of the performance of the carriers, a single-tail test was also used, called directional (Witte and Witte, 2005). The result of the Kendall’s Tau-b non-parametric correlation test presented significant correlations for all variables analyzed in relation to the perception of average performance of the carriers. The variable “Geographic area of operation” was shown to be significant at 0.05. The other variables showed to be significant at 0.01.
The significant correlations were treated statistically through the factorial analysis technique, trying to determine whether there were any relations among them and permitting the formation of satisfaction factors that were common to the shippers.
A type-R factorial analysis was performed trying to find the correlations between variables. The method used was that of main components, as this is a data exploratory research for generation of hypothesis (Field, 2005). Besides, this method presents more facility of processing in comparison to other avail-ables, and similar results are found in most of the cases in which there are over 30 variables or when common-alities exceed 0.60 for most variables (Hair et al., 2005). In order to determine the number of factors to be extracted, we opted for the scree test criterion. The scree test is used to determine the point at which the single variance of the factors starts to domain the common variance structure. This criterion was pre-ferred to the eigenvalue criterion due to the number of variables since, for less than 20 variables, as it is the
case of this research, the eigenvalue criterion results in a conservative number of factors.
Finally, in order to make this option more robust, the compliance with the variance percentage crite-rion was observed. The determination of the num-ber of factors by the quality of variance explained calculates the accumulation of variance for each factor extracted until a satisfactory level is reached. Thus, it was found whether the factors extracted by the scree test criterion had minimum variance of 60%, as recommended by the litera-ture (Malhotra, 1996).
After determining the number of factors, the data were rotated. This procedure is justified since, in most of the cases, it helps reducing ambiguities in the interpretation of the factors. As there was the option for oblique and orthogonal rotations, we opted for the latter due to the existence of disputes on the analytical procedures of oblique rotations, besides the fact that they are not yet well developed (Hair et al., 2005). Among the methods available for orthogonal rotation, Varimax was adopted because of its characteristic of trying to relate variables that have high loads in one single factor (Sharma, 1996). This results in factors the interpretation of which is simpler (Field, 2005).
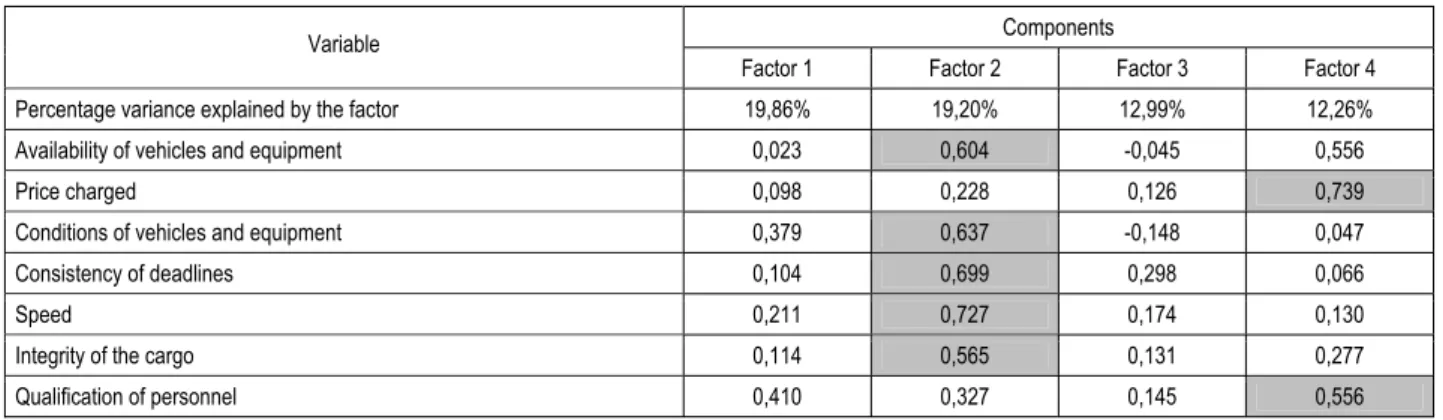
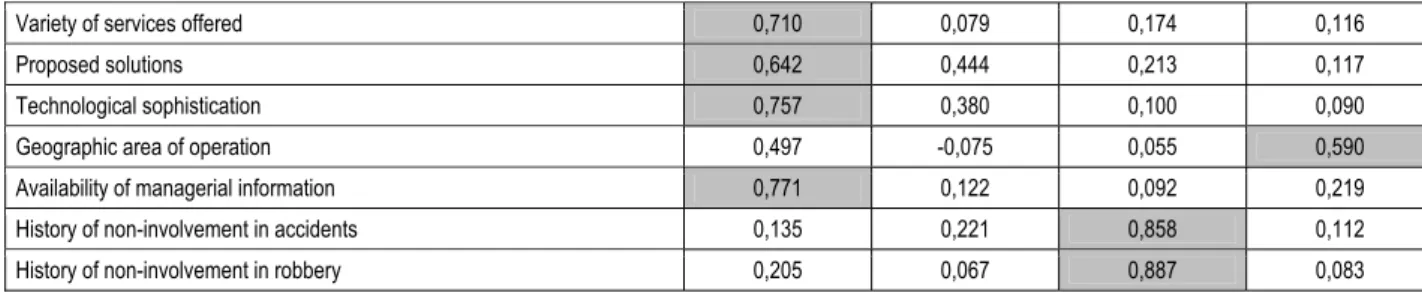
The four factors extracted explain 64.31% of the variance. The KMO test had as result 0.839 which is considered a remarkable result and evidences the possibility of generating distinct and reliable factors. Bartlett sphericity test, in turn, had significance below 0.000, rejecting the existence of an identity matrix and permitting the analysis. It must also be highlighted that out of the 14 variables analyzed, 10 showed commonalities higher than 0.6 evidencing the adequacy of the analysis of main components. Finally, all variables presented factor cargos higher than 0.55 in at least one factor. No factor was composed by only one variable. Thus, all variables were included in the analysis. The re-sults are presented in Table 5.
Table 5. Rotated matrix of components
Components Variable
Factor 1 Factor 2 Factor 3 Factor 4
Percentage variance explained by the factor 19,86% 19,20% 12,99% 12,26%
Availability of vehicles and equipment 0,023 0,604 -0,045 0,556
Price charged 0,098 0,228 0,126 0,739
Conditions of vehicles and equipment 0,379 0,637 -0,148 0,047
Consistency of deadlines 0,104 0,699 0,298 0,066
Speed 0,211 0,727 0,174 0,130
Integrity of the cargo 0,114 0,565 0,131 0,277
Table 5 (cont.). Rotated matrix of components
Variety of services offered 0,710 0,079 0,174 0,116
Proposed solutions 0,642 0,444 0,213 0,117
Technological sophistication 0,757 0,380 0,100 0,090
Geographic area of operation 0,497 -0,075 0,055 0,590
Availability of managerial information 0,771 0,122 0,092 0,219
History of non-involvement in accidents 0,135 0,221 0,858 0,112
History of non-involvement in robbery 0,205 0,067 0,887 0,083
Note: The variables highlighted correspond to the factors.
The 4 factors found were interpreted and named so as to indicate their meanings as follows:
i factor 1 – Synergy: comprises the activities of intelligence by the carrier, which offer the ship-per not only the transportation itself, but im-provements in its service;
i factor 2 – Reliability: characterized by the per-formance of the carrier in the direct execution of the contracted service;
i factor 3 – Risk management: consistency of the carrier to avoid that incidents cause loss to the shipper;
i factor 4 – Qualifiers: minimum requirements for the contracting offered by the carrier, without which the shipper does not accept to contract it. Factors 1, 2, 3 and 4 presented values for Cron-bach Alpha of 0.821, 0.764, 0.828 and 0.635, re-spectively. As all factors presented a Cronbach Alpha higher than 0.6, they were considered to be
validated. The inter-item correlations in factors 1, 2 and 3 were higher than 0.3. In factor 4, the relation between variables “Price charged” and “Geographical area of operation” was of 0.243, lower than 0.3. How-ever, as Cronbach Alpha value for the factor was ac-ceptable, the factor was considered to be validated. The last step of the factor analysis consists in the cal-culation of the factor scores. This procedure was im-portant, because the factor scores were used for the execution of an analysis of clusters (Malhotra, 1999).
3.2. Grouping of shippers. After the factor analy-sis, a clusters analysis was carried out to check whether the shippers, based on the factors extracted, present similar satisfaction patterns. The analysis of clusters by k-means method grouped the companies as follows: 48 (45.71% of the cases) in cluster A, 33 (31.43% of the cases) in cluster B, and 24 (22.86% of the cases) in cluster C. The corresponding cen-troids are presented in Table 6.
Table 6. Centroids of clusters
Factors A B C
Factor 1 – Synergy 2,47 1,65 2,38
Factor 2 – Reliability 1,60 1,31 1,68
Factor 3 – Risk management 1,73 1,43 2,84
Factor 4 – Qualifiers 1,71 1,38 1,79
According to the result of the Mann-Withney test, the centroids of cluster B distinguish from the other clusters in all factors. We also know, by the same test, that clusters A and C differ only in factor 3. The different levels of satisfaction presented by the clusters have a direct connection with the expecta-tions of the shippers that comprise them. A high value in satisfaction of each factor may be the result of a high level of service provided by the carrier or low expectation by the shipper.
3.3. Distinction of groups. According to Hair et al. (2005), in order to verify whether the variables selected in hypothesis 2 differentiate the groups, the Multiple discriminant analysis or the Multino-mial logistic regression may be used. Both of them are adequate when the depending variable is cate-gorical (with three or more groups) and the inde-pendent variables are metric.
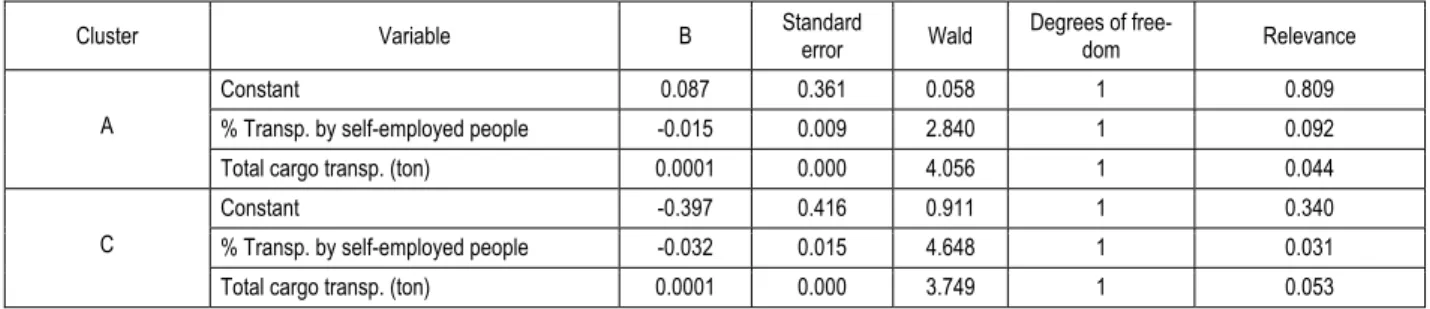
The same authors highlight that the use of the dis-criminant analysis depends on the existence of mul-tivariate normality and of equal variance-covariance matrices. When these assumptions are not met, the logistic analysis shows to be much more robust. Besides, it may accept non-metric variables, pro-vided that they are coded as dichotomous variables (dummy). These reasons justify the option for the multinomial logistic regression. The maximum sig-nificance adopted for the tests was of 0.10, as this is an exploratory study (Mentzer and Flint, 1997). The results of the analysis of multinomial logistic regression presented in Table 7 indicate that vari-ables Total weight of cargo transported by highway modal and Percentage of highway cargo in tons transported by self-employed people presented satis-factory significance (below 0.10), showing that they
discriminate the clusters. In fact, the verisimilitude ratio test for the final model presented significance of 0.014. This result evidences that the combination of variables analyzed (Total weight of cargo
trans-ported by highway modal and Percentage of high-way cargo in tons transported by self-employed people) and the clusters have a proper relation for the multinomial logistic regression.
Table 7. Multinomial logistic regression
Cluster Variable B Standard
error Wald
Degrees of
free-dom Relevance
Constant 0.087 0.361 0.058 1 0.809
% Transp. by self-employed people -0.015 0.009 2.840 1 0.092 A
Total cargo transp. (ton) 0.0001 0.000 4.056 1 0.044
Constant -0.397 0.416 0.911 1 0.340
% Transp. by self-employed people -0.032 0.015 4.648 1 0.031 C
Total cargo transp. (ton) 0.0001 0.000 3.749 1 0.053
Note: R-Nagelkerke’s square; 0.19; Reference cluster: B.
4. Discussion of the results
The factors analyzed cover both the cost and the characteristics of the services provided, factors that are crucial in the managerial decisions about trans-portation. They also cover the main dimensions of this kind of service: speed, consistency, qualifica-tion, availability and frequency.
Thus, the first factor, Synergy, relates to services provided by the carrier in line with the shipper, add-ing value to the activities of the latter. The competi-tion that characterizes the Brazilian market and makes these prices decrease does not leave any margin for the carrier to pay for its costs, perform these activities and still obtains some profit. Thus, we can conclude that the expectations of the ship-pers should be modest. This seems to occur in rela-tion to cluster B, once it is the cluster resulting as satisfied. Clusters A and C present a regular level of satisfaction. We can conclude that clusters A and C have higher expectations and consequently a lower tolerance zone in relation to this factor.
The second factor, Reliability, relates to basic indi-cators of the transportation service. As in the prior factor, the aggressive competition reducing prices causes the expectations for the level of services to be reduced. On the other hand, these indicators are easier to be reached, demanding lower expenditures of funds by the carrier, making it possible to get closer to shippers’ expectations. Thus, we see that clusters A and C present as satisfied and cluster B very satisfied. We can conclude that cluster B has lower expectations than clusters A and C.
The third factor, Risks management, has the same problems as the prior factors as a result of competi-tion, and the adoption of insurance to protect cargo is not usual in Brazil. As regards this factor, cluster B shows to be very satisfied, cluster A satisfied and cluster C with regular level of satisfaction. We can
conclude that cluster C is the one that has the high-est expectations, in relation to the risks management by the carrier.
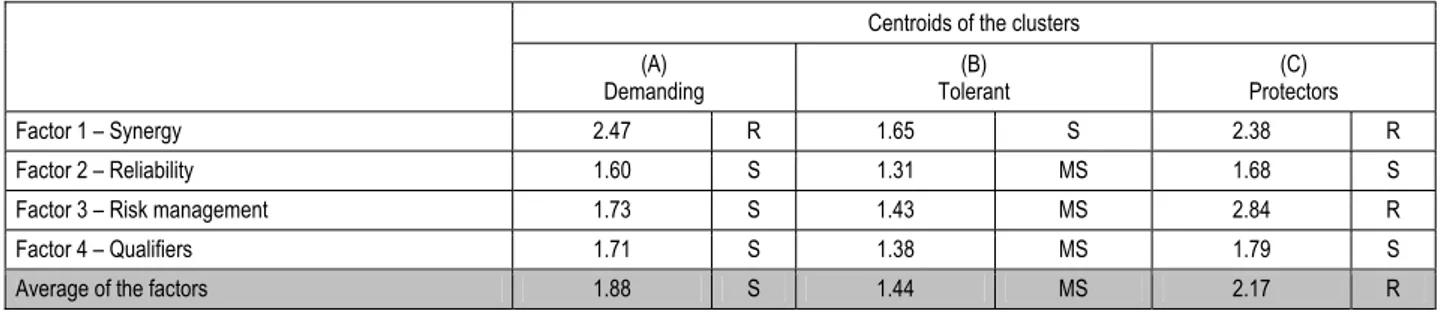
The fourth factor, Qualifiers, contains the indicators that, if they do not reach minimum values, prevent the provision of the services. In this case, clusters A and C are satisfied and cluster B is very satisfied. Specifically in relation to this factor, we conclude that cluster B pays lower values, which generates higher satisfaction. Clusters A and C must pay higher values. It is important to highlight that this factor refers to the cost of the freight, but does not directly approach other relevant costs in the choice of the transportation network such as costs of inven-tory, facilities, processing and level of service. The analysis of each factor permits us to conclude that cluster B receives the worst services and has the lowest cost remunerating carriers. However, as it has the lowest expectations in relation to the service, it presents the highest average satisfaction, and may be called Tolerant.
Cluster A has higher expectation in relation to tors 1, 2 and 3. Thus, satisfaction in these three fac-tors is lower in relation to cluster B. In order to meet the needs of the companies comprising this cluster, carriers need to demand a premium on the price, what makes satisfaction in relation to factor 4 also decrease. This cluster was called Demanding. Cluster C has a behavior similar to cluster A in rela-tion to factors 1, 2 and 4. The expectarela-tion of the companies of this cluster in relation to factor 3 is higher than in clusters A and B. These characteris-tics make satisfaction in relation to factor 3 decrease in a similar, however, more stressed manner than it occurs with cluster A. This cluster presents the worst average satisfaction. Considering the peculiar-ity of the cluster in relation to factor 3 and the likely higher demand in relation to this factor (Risk man-agement), it was called Protector.
Table 8. Interpretation of the satisfaction clusters
Centroids of the clusters (A) Demanding (B) Tolerant (C) Protectors Factor 1 – Synergy 2.47 R 1.65 S 2.38 R Factor 2 – Reliability 1.60 S 1.31 MS 1.68 S
Factor 3 – Risk management 1.73 S 1.43 MS 2.84 R
Factor 4 – Qualifiers 1.71 S 1.38 MS 1.79 S
Average of the factors 1.88 S 1.44 MS 2.17 R
Note: Interpretation of satisfaction: R = regular satisfaction, S = satisfied, MS = very satisfied.
Observing the results of multinomial logistic regres-sions, having the annual tons transported, we see that the Tolerant has, in comparison to the other clusters, higher probability of transporting cargoes up to 400 tons. This probability continues to de-crease until it approaches zero at around 12,000 tons. This cluster also has the lowest probability of using a small portion of self-employed people to transport its cargo. However, they present the highest probabilities when we have the proportion of about 90% to 100% of the cargo transported by self-employed people. The reasons that lead com-panies with lower volume of cargo transported to have lower expectations may be attributed to the low impact that the low tonnage transportation has in the total costs of the company. The higher the scale is, the higher is the cost and accordingly the concern about the activity. This absence of concern about the activity of transportation is also reflected in the use of self-employed people in large scale. Once the companies are not concerned about the level of service provided, they started to look for the lowest possible cost, which is found with the self-employed carriers.
The Demanding are the group that has the higher probability of transporting cargo starting on about 400 tons per year. As regards the use of self-employed people, the Demanding have the highest probability of using them provided that they are responsible for 0% up to about 90% of the cargo transported. As they have the highest probability of transporting high tonnages, making use of an analog reasoning as that used in the analysis of the Toler-ant, this group presents higher expectations in rela-tion to the highway transportarela-tion of cargo. The impact of this activity must be much higher in costs of these companies than in that of the others. It must be highlighted that, with the increase in volume, a point is reached at which the probability of a com-pany to belong to this group is of about 100%. The Protectors have the lowest probability of trans-porting very low tonnages (up to about 1600 tons per year). The chances of transporting a higher
vol-ume increase up to about 6,000 tons when they start to decrease. In relation to self-employed carriers, they present the lowest probabilities of having the participation of self-employed people starting on about 20% up to 100%. In spite of the several simi-larities that the Protectors have in relation to the Demanding, as regards their expectations, the dif-ferences between them permit us to reach interesting conclusions. Initially, the probability of belonging to the group of Protectors increases with the tonnage up to about 6,500 tons, when it starts to decrease. This represents a limitation in the transported vol-ume, may be because it has higher added value. Besides, this group is the one that has the lowest possibility of making use of self-employed people, probably because of the search for higher security for the transported cargo.
Finally, the highway cargo transportation market in Brazil follows a practice found in several countries of the world, namely: the use of self-employed people as a way to reduce costs when relaying them to the car-rier, avoiding the existence of more expensive em-ployment relationships and increasing the commitment of the driver when using an asset owned by himself. Although the reasons that lead companies to use self-employed people around the world vary a little, in Brazil, peculiarities such as the absence of barriers to the entry and large difficulties when trying to abandon the industry have created a peculiar situation in which a vicious circle has been affecting all the industry of transportation and reducing both the costs and the level of services provided, making our situation a different case. In spite of this market where the dispute for cost is so aggressive and the other modals do not represent a significant threat, this research demonstrated that not all shippers have the same expectations in relation to the service they receive and thus they behave in a dis-tinct manner.
Conclusions and suggestions for future research The results of the statistical analysis provide us with the information required to answer the first question of the research: Are shippers of cargo for highway transportation grouped according to similar patterns
of satisfaction? The results of the research indicate that the answer is yes. Based on the factors found in the research (Synergy, Reliability, Risk manage-ment and Qualifiers), the shippers are initially or-ganized into two groups: one in which the expecta-tions as regards the level of service to be provided by the carrier are modest and the other in which the expectations are higher. This second one is subdi-vided into two groups, which differ because one of them presents higher expectations in relation to the Risks management than the other group.
As regards the second question: Can groups be dis-tinguished among themselves according to the ton-nage transported on an annual basis and according to the percentage of transportation carried out with self-employed people, permitting the carriers to opt for a positioning to serve one of them and the
con-sequent customization of their services? As it oc-curred with the first question, the results indicate that the answer to the second one is also yes. The three groups found present distinct behaviors among themselves in relation to variables tonnage ported on an annual basis and percentage of trans-portation made with self-employed people. Let us analyze the behavior of each factor in the groups in order to better identify them.
As main limitation and suggestion for future studies, it must be mentioned that this research has not con-sidered other relevant demographic data such as type of industry, manufacturing process used or region where the company operates. The study of relations between the level of satisfaction and the service of transportation intended by different indus-tries would bring valuable results.
References
1. ANTT (Agência Nacional de Transporte Terrestre), RNTRC (Registro nacional de transportadores rodoviários de cargas) (2008a). Disponível em: <http://www.antt.gov.br/carga/rodoviario/rodoviario.asp>. Acesso em 02 mai, 2008. 2. ANTT, RNTRC em números (2008b). Disponível em: <http://appeantt.antt.gov.br/ rntrc_numeros/rntrc_total.asp>.
Acesso em 03 mai, 2008.
3. Armstrong, J.S.; Overton, T.S. Estimating nonresponse bias in mail surveys // Journal of Marketing Research, V-XIV, pp. 396-402, agosto, 1997.
4. Candido, J.C.X. O processo de decisão de compra de caminhões pesados. Dissertação (Mestrado em Administração) – Escola de Administração, Universidade Federal do Grande do Sul, 2004.
5. Centro de Estudos em Logística – CEL / COPPEAD. Transporte de carga no Brasil – Ameaças e oportunidades para o desenvolvimento do país, 2002. Disponível em http://www.centrodelogistica.org/new/fs-pesquisa.htm. Acesso em 02 mai, 2008.
6. Chahad, J.P.Z., Cacciamali, M.C. As transformações estruturais no setor de transporte rodoviário e a reorganização no mercado de trabalho do motorista de caminhão no Brasil. Revista da ABET – Associação Brasileira de Estudos do Trabalho, Ano 5, Vol. 2, ʋ 10, 2005.
7. Chopra, S., Meindl, P. Gerenciamento da cadeia de suprimentos: Estratégia, planejamento e operação. São Paulo: Prentice-Hall, 2006.
8. CNT (Confederação Nacional do Transporte), BECNT (Boletim Estatístico) (2007a) Disponível em: http://www.cnt.org.br/arquivos/downloads/bol_estatistico/ becnt_2007_11.pdf. Acesso em 02 mai, 2008.
9. CNT. Plano CNT de Logística (2007b). Disponível em: http://vm-sharepoint.sestsenat.org.br:9003/index.html Acesso em 02 mai,. 2008.
10. Cook, C., Heath, F., Thompson, R.L. A meta-analysis of response rates in web- or internet-based surveys // Educational and Psychological Measurement, Vol. 60, No. 6, pp. 821-836, Dezembro, 2000.
11. Field, A. Discovering statistics using. SPSS. 2ª. Ed., Londres: Sage Publications, 2005.
12. Fleury, P.F. Gestão estratégica do transporte. In: Figueiredo, Kleber. F., Fleury, Paulo. F., Wanke, Peter (Eds.). Logística e gerenciamento da cadeia de suprimentos: planejamento do fluxo de produtos e dos recursos. São Paulo: Editora Atlas, 2003a.
13. Fleury, P.F. Panorama do transporte de cargas no brasil. In: Figueiredo, Kleber. F., Fleury, Paulo. F., Wanke, Peter. (Eds.). Logística e gerenciamento da cadeia de suprimentos: planejamento do fluxo de produtos e dos recursos. São Paulo: Editora Atlas, 2003b.
14. Gameiro, A.H., Caixeta Filho, J.V. Administração de Seguros no Transporte de Cargas // RAE-eletrônica, V. 1, ʋ 1, jan-jun/2002.
15. Gibson, B.J., Rutner, S.M., Keller, S.B. Shipper-carrier partnership issues, rankings and satisfaction // International Journal of Physical Distribution & Logistics Management, 2002. – V. 32, ʋ 8. pp. 669-681.
16. Hair, J.F., Anderson, R.E, Tatham, R.L. Análise multivariada de dados. 5a. Ed., Porto Alegre: Bookman, 2005. 17. Hart, O., Moore, J. Property Rights and the Nature of the Firm // Journal of Political Economy, 1990. – ʋ 98. –
pp. 1119-1158.
18. Hopkins, S.A., Strasser, S.; Hopkins, W.E., Foster, J.R. Service quality gaps in the transportation industry: An empirical investigation // Journal of Business Logistics, 1993. – V. 14, ʋ 1, pp. 145-161.
19. ILO (International Labor Organization). The scope of the employment relationship. 91stSession, Report V, Fifth Item on the Agenda, International Labor Office, Geneve, 2003.
20. Malhotra, N.K. Pesquisa de marketing: Uma orientação aplicada. 3ª Ed., Porto Alegre: Bookman, 2001.
21. Mentzer, J.T.; Flint, D.J. Validity in logistics research // Journal of Business Logistics, 1997. – V.18, ʋ 1, pp. 199-216.
22. Mentzer, J.T., Flint, D.J., Hult, T.M. Logistics service quality as a segment-customized process // Journal of Marketing, 2001. – V. 65, ʋ 4. – pp. 82-104.
23. Nazário, P. Papel do transporte na estratégia logística In: Fleury, Paulo. F., Wanke, Peter, Figueiredo, Kleber. F. Logística empresarial: A perspectiva brasileira. São Paulo: Editora Atlas, 2000.
24. Nickerson, J.A.; Silverman, B.S. Why aren’t all truck drivers owner-operators? Asset ownership and the employment relation in interstate for-hire trucking // Journal of Economics & Management Strategy, 2003. – V. 12, ʋ 1, pp. 91-118.
25. PAC (Programa de Aceleração do Crescimento). Disponível em: http://www.brasil.gov.br/pac/infra_estrutura/. Acesso em 02 mai. 2008.
26. Rodrigues, A.M., Stank, T.P., Lynch, D.F. Linking strategy, structure, process, and performance in integrated logistics // Journal of Business Logistics, 2004. – V. 25, ʋ 2. – pp. 65-94.
27. Sharma, S. Applied Multivariate Techniques. – New York: John Wiley & Sons Inc., 1996.
28. Valente, A.M., Passaglia, E., Novaes, A.G. Gerenciamento de Transporte e Frotas. São Paulo: Pioneira, 1997. 29. Wanke, P., Arkader, R., Hijjar, M.F. Logistics sophistication, manufacturing segments and the choice of logistics
providers // International Journal of Operations & Production Management, 2007. – V. 27, ʋ 5. – pp. 542-559. 30. Witte, R.S., Witte, J.S. Estatística. 7ª Ed., Rio de Janeiro: LTC, 2005.