Fluid Milk in
School Meal
Table of Contents
Introduction ... 2
Overview ... 3
School Meals: From the Beginning to Today ... 5
Current Program Requirements ... 9
Dairy’s Role in the Diet ... 11
School Meals: Milk and Nutrition ... 14
Milk Requirements ... 17
Current School Milk Issues ... 18
Estimating Current Milk Consumption and Trends ... 21
Opportunities for Enhancing School Milk Consumption through Utilization of USDA Programs ... 25
Conclusion... 29
References ... 29
Acknowledgments
Special thanks to the following experts who provided valuable information and review of this report.
Tami J. Cline, PhD, RD, SNS
Owner, Cline Consulting Kansas City, Missouri
Dayle Hayes, MS, RD
President, Nutrition for the Future, Inc. Billings, Montana
Katie Wilson, PhD, SNS
Executive Director
National Food Service Management Institute University of Mississippi
About National Dairy Council
®National Dairy Council (NDC), the non-profit organization funded by the national dairy checkoff program, is committed to nutrition education and research-based communications. NDC provides science-based nutrition information to, and in collaboration with, a variety of stakeholders committed to fostering a healthier nation, including health professionals, educators, school nutrition directors, academia, industry, consumers and media. Established in 1915, NDC comprises a staff of registered dietitians and nutrition research and communications experts across the country. NDC has taken a leadership role in promoting child health and wellness through programs such as Fuel Up to Play 60. Developed by NDC and the National Football League (NFL), Fuel Up to Play 60 encourages youth to consume nutrient-rich foods and achieve at least 60 minutes of physical activity every day. For more information, visit www.NationalDairyCouncil.org.
NDC provides science-based dairy foods nutrition information to a variety of stakeholders, collaborating with them to foster a healthier nation. NDC’s
partners include health and wellness professionals, educators, school nutrition directors, academia and industry. Established in 1915, NDC comprises a staff of registered dietitians and nutrition research and communications experts across the nation. NDC is committed to helping improve child health and wellness through programs such as Fuel Up to Play 60, which encourages students in more than 73,000 schools to consume nutrient-rich foods and achieve at least 60 minutes of physical activity every day.
NDC’s nutrition education programs began as early as 1929, and the organization participated in the first White House Conference on Children and Youth in 1940. Today, NDC works with farmers, their cooperatives and dairy companies to encourage the consumption of nutrient-rich, delicious dairy products through the Innovation Center for U.S. Dairy.
NDC is a partner with the GENYOUth Foundation securing resources to improve nutrition and physical activity in schools, including its flagship program, Fuel Up to Play 60 to demonstrate how better nutrition and physical activity can improve academic
“the Learning Connection.” NDC also works with Feeding America and other partners to address the lingering issue of hunger in America. Of the 49 million Americans in food insecure households, 15.8 million are children. Children are particularly vulnerable to the consequences of food insecurity because of the association between food insecurity, health and cognitive development.1 This vulnerable population is
at risk for a nutrient gap for the nine essential nutrients that milk provides. Food insecure children rely on school meals and the milk provided with those meals to help their families address this gap. In 2015, NDC will mark 100 years of excellence in nutrition science, communication and education.
Throughout its history, NDC has had a special focus on child nutrition and health – largely through schools. School meals are an important channel to nourish and educate America’s young people. Throughout the history of school nutrition, milk has been part of the meal. This report examines the history of milk in schools, describes how milk’s unique nutritional package fits with other foods in federal school meal programs providing nourishment for students in almost 100,000 schools, and discusses the opportunities and challenges school milk faces today.
Fluid Milk in
School Meal
Programs
INTRODUCTION
National Dairy Council (NDC), a non-profit organization founded by U.S. dairy
farmers, is committed to nutrition research and education about health, wellness
and dairy’s role in the diet.
School meals are a unique example of public policy designed to meet a significant health need, combining federal, state and local resources, while evolving as public health challenges change. Milk, because of its unique nutrient profile has been a fundamental component of the school meal policy development every step of the way.
School meals began, in part, as a response to alarming rates of malnutrition among World War II recruits who had lived through the crushing poverty of the Great Depression.2 (p. 14-15 of full download), 3-4] As the decades passed,
food insecurity remained a challenge, but as the new millennium began, increasing rates of overweight and obesity among children raised the specter of poor nutrition habits. The association of chronic diseases, such as heart disease and type 2 diabetes with excess weight became an increasing worry. In 2004, Surgeon
General Richard Carmona spoke of today’s children as “the first generation that will be less healthy and have a shorter life expectancy than their parents.”5
Paradoxically, overweight and obesity sometimes co-exist among families with food insecurity and as a result, many Americans, including children, are overweight yet undernourished.
School meals have changed in response to these new concerns, as the Healthy, Hunger-Free Kids Act of 2010 put an even stronger emphasis on nutrition standards for school lunches, breakfasts and snacks. The milk served to the nation’s students has changed as well. Schools requested and received milk with lower fat levels, while milk companies reformulated their flavored milk offerings to significantly reduce added-sugar content.6, 7
OVERVIEW
For the greater part of a century, milk has been an integral part of school meals in
the United States – first in lunches, later in breakfasts, and suppers, as well as meals
provided in summer programs.
Milk is the number
one source of nine
essential nutrients
in the diets of
America’s children
and adolescents.
While lower in fat and added sugar, milk’s nutrient package remains unequalled. The central role that milk plays in school nutrition is a consequence of the unique nutrient contributions it makes to children’s diets. Milk is the number one source of nine essential nutrients in the diets of America’s children and adolescents.8 Milk not only provides essential
nutrients, but it provides many that are typically lacking in the diet. Of four nutrients identified by the Dietary Guidelines for Americans as under-consumed,9 milk
is the number one food source of three – calcium, potassium and vitamin D.8 School meals have
always been planned to help students achieve the most current nutritional goals, and milk has been a cornerstone of that effort.
Current federal dietary guidance advises three daily servings of milk or other dairy foods for children and adolescents 9 years and older.9 A 2014
recommendation from the American Academy of Pediatrics indicates that adolescents may need four servings a day for adequate bone development.10
Providing milk with each school meal is consistent with these recommendations, especially since total dairy foods consumption for most Americans falls short of the recommended amounts. Typically, only pre-school-aged children fully meet dairy recommendations. Dairy consumption, on average, falls below recommended amounts by 4 years of age, on average, and continues to decline with age.9, 11-12 As children move into
adolescence, they increasingly turn to less nutritious beverage choices instead of milk.12-14
Given the contrast between dairy food recommen-dations for school-aged children and their actual consumption, milk in schools serves two distinct but interrelated purposes. First, like other foods in school meals, it provides students with the nutrients they need in an amount appropriate to each eating occasion. Second, just as schools educate students about math, science and literature, school meals can provide education regarding appropriate dietary choices and eating patterns that help to build healthy habits for a lifetime.
The National School Lunch Program
and Its Predecessors
Efforts to serve milk in schools began even before federally-subsidized school lunches were widespread. Federally-supported milk programs began in Chicago and New York City in 1940, providing milk to schools located in low-income neighborhoods. The Great Depression’s legacy of poverty and malnutrition lingered, and public concern about inadequate milk consumption helped build support for supplying milk to needy areas. In the year that followed, several other cities, including Boston, Omaha, Birmingham, and Ogden, Utah, initiated similar programs.3, p. 35 During the same
period, school lunch programs began to receive federal reimbursements. What is now known as the National School Lunch Program (NSLP) was authorized in 1946. In a statute that has been amended frequently, it is
now formally known as the Richard B. Russell National School Lunch Act, after the longtime Georgia Senator who championed the program. President Harry Truman signed the 1946 law, noting the study that showed the biggest reason recruits had been rejected during World War II was for diet-related health reasons, including malnutrition. Within a year, lunches were served to about 7 million children each day.3, p. 18
The NSLP gradually expanded over the next decade. By 1959, almost half of U.S. schools had set up a food service operation with federal funds. Consolidating earlier efforts, Congress in 1954 authorized the Special Milk Program, which contributed (along with the growth in school lunches) to a 10-fold increase in school milk consumption between 1946 and 1969.15
SCHOOL MEALS:
Expansion in the 1960s
Congress enacted a range of new social programs during the 1960s, especially under the presidency of Lyndon Johnson. Americans became more aware of the poverty and hunger that remained in an outwardly prosperous nation. Books such as Michael Harrington’s The Other America influenced the John F. Kennedy administration, while documentaries such as CBS’s 1968 “Hunger in America” brought the issue to the attention of Americans.16
In 1966 Congress enacted a new statute called the Child Nutrition Act. This law helped school districts purchase kitchen equipment, increased funding to feed needy children and created a two-year pilot program to offer school breakfasts. This was the beginning of the School Breakfast Program (SBP), though it was not permanently authorized until 1975.2 At this point in
time, about three-quarters of school-age children were enrolled in schools offering the National School Lunch Program with about half of these children participating in the program on any given day.3, p. 26
Continuing concerns regarding hunger and malnutrition prompted President Richard Nixon to convene a White House conference on the subject in May 1969. This conference proved to be the genesis of long-lasting reforms, leading to uniform national standards that provided free or reduced-price meals to students who could not afford the full cost of a lunch. The concept of charging poor students less was not new, but the federal standards replaced previous inconsistent requirements that had been implemented in local schools.3, p. 28
In this decade, Congress also moved to provide meals and other foods outside the school setting and outside the school year. The predecessor to the current Child and Adult Care Food Program (CACFP) began in 1968, as did the first version of the Summer Food Service Program (SFSP).2, p. 7
Current federal
dietary guidance
advises three daily
servings of milk or
other dairy foods
for children and
adolescents 9
years and older.
Budget Concerns and Cutbacks
In the 1980s, growing concerns about the size of federal deficit spending and skepticism about government programs, contributed to scaling back subsidies of all kinds, including some aspects of school meal
programs.17 Budget-cutting legislation in the early 1980s
did not spare these programs, reducing reimbursement rates for free and reduced-price lunches while
modestly expanding the income eligibility range for free lunches. Congress also reduced the value of donated commodities and halted assistance for equipment acquisition by schools. Participation in school lunch programs fell 14% from 1980 to 1982 as schools raised meal prices in response.2, p.7 At the same time, schools
increasingly turned to outside vendors for meals as a way to reduce costs. In addition, competitive foods (i.e., foods and beverages sold a la carte in the cafeteria, or through vending machines) were a growing factor in the school food equation. Schools’ financial reliance on these competitive food sales increased, and the U. S. Department of Agriculture (USDA) lost in court when it tried to assert jurisdiction over school vending machines.18 It took an act of Congress years later, in
2010, to give USDA this authority.19
Dietary Concerns Take Center Stage
Not all the forces affecting school meals in this period had a fiscal basis. The first Dietary Guidelines for Americans were published in 1980.20 The Dietary
Guidelines were mandated by law in 1990 to be reviewed and revised every five years, assisted by expert advisory committees. The guidelines not only advised Americans about foods to eat to assure nutritional adequacy, but also reflected rising concerns that intake of some nutrients was excessive – with fat, saturated fat and cholesterol the subject of most attention during this time.9, 20
In 1991, the Department of Health and Human Services issued its Healthy People 2000 report, which included recommendations that 90% of school meals should meet the Dietary Guidelines recommendations.2
Two years later, the first in a series of School Nutrition Dietary Assessment (SNDA) reports was released. It found that while school meals generally met children’s nutritional needs, school lunches did not comply with dietary recommendations for total fat and saturated fat as a percent of calories. The following year, in 1994,
Congress reauthorized child nutrition programs and required that school lunches conform to the Dietary Guidelines by 1996. As part of this effort, USDA
launched the School Meals Initiative for Healthy Children (SMI) to support nutritional improvements in meals. SMI provided technical assistance, offered access to commodities with lower fat levels, and introduced a new system for planning school menus that provided guidance on meals’ content of fat, saturated fat and other nutrients. Team Nutrition, which continues today as the Department’s primary training and technical-assistance support to schools, was launched in 1995.2
The Obesity Crisis and School Meals
Beyond children’s consumption of fat and cholesterol, the 2000s began to focus on rising rates of overweight and obesity among the nation’s youth, along with related chronic diseases.21 Type 2 diabetes, previously
rare among children, began appearing with greater frequency. At the same time, school meals were moving toward greater compliance with the Dietary Guidelines, but were still above the then-current recommendation for total fat at 30% of calories. Fat levels in school lunches had fallen from 39% to 35% of calories between the first and second SNDA studies.22
During the 2004 reauthorization process for child nutrition programs again, Congress required schools to establish local “wellness policies” to address nutritional standards for all foods sold in schools, including those that competed with school meals, as well as goals and
policies for physical activity and nutrition education.2
Though the policies were mandatory for schools that offered federally-reimbursed meals, the content of the policies remained locally determined. In part, this reflected the continued lack of USDA authority to regulate competitive foods. Some local wellness policies encouraged the consumption of low-fat and fat-free dairy foods; at the time the policies were being developed and implemented, the 2005 Dietary Guidelines recommended three servings of low-fat or fat-free milk or milk products for most age groups.23
As the decade proceeded, concern about the connections between diet and health continued to grow with the nation’s waistline. Schools became a focus of efforts to prevent overweight and obesity at an early age. Policy makers were increasingly concerned about what children were getting from their schools’ vending machines, and the nutritional content of school meals came under more scrutiny. Acting on a series of requests from USDA for expert guidance, the Institute of Medicine (IOM) began to play a high-profile role in recommending standards for child nutrition programs. In highly-publicized reports in 2007 and 2009, the IOM recommended standards for both competitive foods and school meals. For the first time IOM recommended setting calorie maximums in addition to minimum calorie levels for reimbursable school meals, a longstanding practice. The reports also recommended low-fat and fat-free milk, and suggested that flavored milk sold in competition with the meal line should have no more than 22 grams of total sugars.24-25 In broad terms,
USDA adopted most IOM recommendations in regulations for the 2010 reauthorization law, the
Healthy, Hunger-Free Kids Act.19 All USDA child nutrition
programs are currently governed by this statute, which Congress is scheduled to renew and update in 2015.
The 2010 Healthy, Hunger-Free Kids Act
The Healthy, Hunger-Free Kids Act of 2010 included a number of provisions to encourage all stakeholders involved in education to move forward with creating healthy school environments throughout the entire campus. Additional reimbursement was provided to
schools that met nutrition standard requirements in the school meal programs. This new standard required that milk be consistent with the most recent Dietary Guidelines, mandating that school milk be low-fat (1%) or fat-free. For the first time, Congress also instructed USDA to set standards for all foods sold in schools during the school day, including competitive foods sold a la carte and in vending machines. To better serve low-income communities, the new law introduced a Community Eligibility Provision that allows schools to provide lunch and breakfast at no charge in high-poverty areas. After a phase-in period, all states are now eligible to implement this provision.19
The 2010 Dietary Guidelines came out in early 2011 and continued many themes of the 2005 version. Three servings of low-fat and fat-free milk and milk products for those 9 years and older continued to be a recommendation, and for children 5-8 years, the recommendations increased from two to 2 1/2 servings. Other recommendations were similar to those in prior Dietary Guidelines, including increasing consumption of fruits, vegetables and whole grains, and reducing consumption of sodium, saturated and trans fats and added sugars.9
Once the Healthy, Hunger-Free Kids Act was passed, USDA developed regulations to implement the new law’s requirements for school lunches, breakfasts and competitive foods. The new regulations were met with some controversy. Critics noted that average daily participation in the National School Lunch Program declined for the first time in many years, and some school nutrition officials expressed frustration with higher costs for fruits and vegetables as well as the difficulty of meeting some of the new requirements, especially those for whole grains and sodium.26 Supporters of the
regulations cited the continuing epidemic of overweight and obesity among children and said the changes to school meals were needed and even overdue.27 What
both critics and supporters shared was a sense of the importance of school meals to students’ overall nutrition, and a realization of the need to balance better nutritional content with student acceptance.
National School Lunch Program
The National School Lunch Program (NSLP) operates in the vast majority of all U.S. schools – nearly 100,000 public and non-profit private schools. In fiscal year (FY) 2013, the program served a total of 5.1 billion meals, down from 5.2 billion the year before. Each day, about 30.7 million students ate school lunches – again, a slightly lower participation rate than in 2012, when 31.6 million students took part.28, tables 3, 4
USDA regulations mandate the components of meal patterns by food group, quantity and grade level. For example, school lunches should supply 2 1/2 cups of fruit per five-day week for elementary and middle school students, with a minimum of ½ cup per day. Depending on the food group, there may be both a required amount to be offered during the week and a minimum amount to be offered each day, though not all meal components have daily requirements. Five days’ worth of meals are averaged to determine compliance with the weekly nutrition requirements, but daily food component requirements must be offered on each school day.29
The food groups are fruits; vegetables, including several categories such as dark green, dark red/orange, and legumes; grains; meats and meat alternates (which include cheese and yogurt); and milk. The requirement for fluid milk (which must be low-fat or fat-free) is 1 cup offered per day and 5 cups offered per week. Additionally, meals must be, on average for one week, within specified calorie ranges – for example, lunches for high-school students must provide at least 750 calories but no more than 850. Saturated fat content is to average at or below 10% of total calories for the week’s meals, while sodium content has maximum levels that vary by grade (e.g., 740 milligrams for high-school lunches at the final SY 2022-2023 level).
The sodium targets are scheduled to decline further in the years ahead, a prospect that some school nutrition professionals have said will be challenging.29
School Breakfast Program
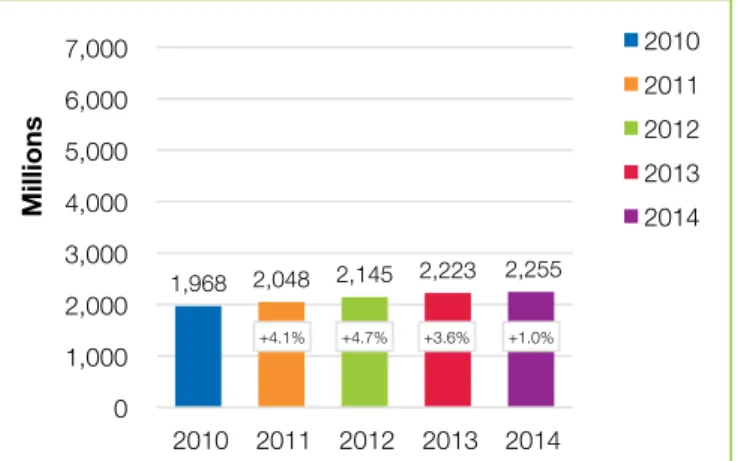
The School Breakfast Program (SBP) has been introduced in almost as many schools as the NSLP, but participation remains well below that for lunches, for a variety of reasons. These include time pressures in the school day, the limited adoption of more user-friendly options like Breakfast in the Classroom, and a perceived stigma in some schools. In 2013, schools served 2.2 billion school breakfasts, which in contrast to the NSLP was an increase from the year before. Average daily participation was 13.2 million students.28, table 8
The SBP, like the NSLP, has requirements for calorie ranges, sodium content and food groups that vary by grade level, along with the same <10% limit on saturated fat total calories. Milk is required to be offered, as are two fruits and at least one grain serving (which must be whole grain-rich); vegetables and meat/meat alternates are not required in contrast to lunch. Schools may substitute a meat/meat alternate for a grain once the daily grains minimum is met.30
Supper and Summer Programs
The Child and Adult Care Food Program (CACFP) is the federal government’s primary program to provide nutritious meals and snacks to children in day-care centers and similar institutions, as well as to some populations of adults with special needs. CACFP’s primary clientele is pre-school children, but the program also offers suppers to at-risk youth. Some of the supper programs are located at schools. In 2013, about 185 million suppers were provided through CACFP funds (most would have been provided in settings other than schools).28, table 13c
CURRENT PROGRAM REQUIREMENTS
To qualify for federal reimbursement, school meals and other USDA feeding
programs must meet nutritional standards as well as other requirements. This section
does not attempt to list all the standards but to summarize the most important ones.
All the programs described here are administered by the Food and Nutrition Service
(FNS) of the U.S. Department of Agriculture (USDA).
The Summer Food Service Program (SFSP) has been a priority for USDA in recent years, and program participation has grown in the low-income areas, the focus of this initiative. Some 151 million meals and snacks were served in 2013, and it appears that when final 2014 numbers are available, the total will exceed 160 million.28, table 16a SFSP meal requirements are less
complex than those for the NSLP and SBP but meals include the same general food groups: meats and meat alternates; vegetables; fruits; grains; and fluid milk.31
Special Milk Program
The Special Milk Program once provided milk to schools throughout the nation, but it no longer accounts for a large volume of milk consumption. For the past few decades it has been available only to students that do not have access to any of the other federal feeding programs. In 2012, about 4,500 institutions (schools, child care institutions and summer camps) received special milk, with federal reimbursements established on the same free, reduced-price and full-price schedule used in the federal meal programs. More than 61 million half-pints were served that year. Milk in this program is required to be low-fat or fat-free.32
Smart Snacks
Regulations that establish federal standards for competitive foods, a category that ranges from snacks and beverages sold in vending machines throughout the school or in school stores, to extra entrée items sold as alternatives to reimbursable lunches in the school cafeteria were mandated for the first time in the Healthy, Hunger-Free Kids Act. USDA calls these regulations “Smart Snacks” rules, and based them on a 2007 report and recommendations from the IOM.24
A major difference between regulations for the NSLP and SBP and the Smart Snacks regulation is that the latter establishes criteria for individual foods, whereas the school meal requirements generally apply either to meals as a whole (e.g., calorie caps) or to categories of foods (e.g., offering at least ½ cup of fruit or vegetable with each lunch). Most schools will be affected by the new rules – for example, the most recent SNDA study (SNDA-IV) showed that in 2009-2010, 85% of elementary schools, 95% of middle schools and 90% of high schools had a la carte offerings available for lunch.33, p.4
Vending machine offerings are also widespread, but the mix of products sold in vending had shifted even before the Smart Snacks rules as a result of public-health concerns and public and private initiatives like USDA’s HealthierUS School Challenge and the Alliance for a Healthier Generation’s Healthy Schools Program
recognition. Both voluntary programs reward schools for establishing and maintaining healthy standards in individual schools.
The Smart Snacks rules place limitations on items by calorie level, sodium and saturated fat content, and additional restrictions on allowable types of foods also apply. For some nutrient-dense products, there are partial exceptions to these limits – for instance, reduced-fat cheese is exempt from saturated fat limits but not sodium limits.
Only specified beverages are allowed in limited size containers to be offered. These vary by grade level between 8 ounces to 12 ounces. Low-fat and fat-free milk (fat-free, if flavored), water and 100% fruit and vegetable juices are allowed at all levels. High schools may sell some other beverages such as diet sodas, low calorie sports drinks and caffeinated beverages.34
Milk, because of
its unique nutrient
profile has been
a fundamental
component of the
school meal policy
development every
Nutrient contributions, health
benefits and Dietary Guidelines
recommendations for milk and
milk products
To build nutrient-dense dietary patterns, the 2010 Dietary Guidelines recommends increased consumption of low-fat and fat-free milk and milk products, fruits, vegetables and whole grains.9 Specifically, the Dietary
Guidelines recommends three servings of low-fat or fat-free milk and milk products daily for Americans 9 years and older, 2 ½ servings for children 4-8 years and two servings for children 2-3 years. Milk is the number one food source of three of the four nutrients of public health concern identified by the Dietary Guidelines – calcium, vitamin D and potassium.8 In addition to
meeting nutrient needs, the 2010 Dietary Guidelines states that the consumption of milk and milk products is associated with multiple health benefits, including better bone health, especially in children and adolescents, reduced risk for cardiovascular disease and type 2 diabetes, and lower blood pressure in adults.9
Many Americans do not meet
current dairy food and dairy
nutrient recommendations
Americans are not meeting current dairy food recommendations. On average, Americans 2 years and older consume 1.9 servings of dairy foods daily (see Figure 1).35 Children ages 2-5 years consume close
to the recommended amounts, but as children get older, their consumption of dairy foods declines (driven mostly by a decrease in milk consumption), and the gap widens into adulthood. Milk makes up about 2/3 of children’s total dairy food intake,35 and it is an important
source of many vitamins and minerals in children’s diets.8 Even at current intakes, of all the foods that
Americans (2 years and older) consume, dairy foods including milk, cheese and yogurt, contribute 58% of the vitamin D, 51% of the calcium, and important amounts of many other nutrients, but only 10% of the calories (see Figure 2).35 Soy and almond beverages
are not commonly consumed, with less than 1% of children drinking them, so they provide only minimal contributions to population nutrient intakes.12, 36
0 0.5 1 1.5 2 2.5 3 2-5
yrs 6-11yrs 12-19yrs 20-29yrs 30-39yrs 40-49yrs 50-59yrs 60-69yrs 70+yrs
Cup Equivalents of Dairy
Males Females
Figure 1: Milk and Milk Product Consumption in the U.S.
Source: What We Eat in America, NHANES 2009-2010, individuals 2 years and over (excluding breast-fed children), day 1 dietary intake data. Food Patterns Equivalents Database 2009-2010.
DAIRY’S ROLE IN THE DIET
In addition to milk being a required component of school meals since their inception,
milk and milk products (milk, cheese and yogurt) have been a basic food group in
the Dietary Guidelines since they were established in 1980. The Dietary Guidelines
is the nation’s nutrition policy, and the Healthy, Hunger-Free Kids Act stipulated that
the national school meal program standards must be consistent with the most recent
Dietary Guidelines.
Certain racial and ethnic groups have lower than average dairy food intakes. For example, Hispanics and non-Hispanic blacks consume fewer dairy foods than non-Hispanic whites (1.5, 1.2 and 1.9 servings per day, respectively).37 Compared with white children, black and
Hispanic children have higher intake of sugar-sweetened beverages and lower intake of low-fat and fat-free milk.38
There has been a noteworthy decline in children’s milk intake over the past several decades.12, 39-40 In
2007-2008, one quarter of children 2-12 years old and more than one half of adolescents and adults (13 years and
older) were not drinking any milk, a significant decrease from 1977-1978.14 Adolescents consumed only half
the amount of the milk in 2005-2006 compared to the amounts in 1977-1978.14 Even at current lower intakes,
milk is the leading food source of nine essential nutrients for children 2-18 years old. Of all the beverages
consumed by children, milk (including milk drinks) contribute approximately 7% of total calories, but 69% of vitamin D, 38% of calcium, 28% of vitamin A, 25% of B12, 24% of riboflavin, 22% of potassium, 21% of phosphorus, 16% of magnesium and 13% of protein.8
0 10 20 30 40 50 60 70 Vitamin D Calcium Phosphorus Vitamin A Vitamin B12
Saturated fats
Riboflavin Protein
Zinc
Potassium Total fat Cholesterol Magnesium
Total sugars Solium Calories Monounsaturated fats Thiamin Vitamin B6 Carbohydrates Polyunsaturated fats Added sugars
Folate (dietary eqiv)
Vitamin E
Iron
Dietary fiber Vitamin C
% of daily intake
Nutrients to encourage Nutrients to limit Other essential nutrients Calories
Figure 2: Dairy Foods Make Important Nutrient Contributions to U.S. Diets
Source: Miller GD, Auestad N. Towards a sustainable dairy sector: Leadership in sustainable nutrition Int. J Dairy Tech 2013; 66:307-316. (NHANES 2003-2006, ages 2 years and over).
Difficulty of meeting nutrient
recommendations without
3 servings of dairy
Because of milk’s unique nutrient composition, it is difficult for Americans 9 years and older to meet nutrient recommendations without consuming at least 3 servings of milk and milk products daily. The 2010 Dietary Guidelines Advisory Committee found that when foods from the dairy group were removed from USDA dietary patterns, calcium, magnesium, phosphorus, vitamin A and vitamin D dropped below 100% of goals in either some or all food patterns, and levels of potassium and choline (which were already below 100% of goal), declined even more.41
Substituting milk and milk products with other food sources of calcium may also change the overall nutrient profile of the diet, because the replacement foods are often not meaningful sources of dairy’s other nutrients.36
One modeling study found that meeting calcium needs while replacing dairy foods was possible with a composite of soy beverage, calcium fortified orange juice, leafy greens and bony fish, but the substitutions also resulted in a decrease in vitamin B12, riboflavin, phosphorus, and zinc among other changes.36 This
is also the case for school meals. A study examining the impact of flavored milk reduction or removal on the nutrient intakes of elementary school children found it would require 3-4 additional foods to replace the nutrient deficit from a decline in milk consumption.42
The replacement foods contained more calories and fat, and would increase costs up to $4,600 more per 100 students per year in the school district examined. Thus, replacing milk with other calcium-containing foods may require a significant change in dietary behaviors, and may cost more as well.43 On the other hand, adding
one more serving of dairy foods per day (to meet the 3 serving recommendation, because most only consume an average of about 2 servings per day) to the typical diet is a practical, cost effective way to help close or reduce nutrient gaps, including calcium, vitamin D and potassium.36
White and flavored milk are options to
help people meet recommended dairy
food servings
The Dietary Guidelines supports establishing the habit of drinking milk in young children, recognizing the importance of adopting healthy nutrition and physical activity behaviors at an early age. Health professional organizations, including the American Academy of Pediatrics (AAP) and the American Heart Association (AHA), recommend drinking low-fat and fat-free milk each day.10, 44-46 As children get older, they increasingly
turn to less nutritious beverage choices in place of milk.12, 37 Often, children who do not drink milk do not
meet recommended amounts of calcium, vitamin D and potassium, confirming that they are not getting these critical nutrients from other foods and beverages.41
Because current low milk consumption is due to decreased frequency of milk intake,14 encouraging milk
drinking from a young age, particularly with meals, could be a key strategy to improve nutrient intakes and help develop healthy habits.
Drinking white and flavored milk can help support meeting nutrient needs, and flavored milk is associated with improved diet quality in children. School-aged children who drink flavored milk do not have higher added sugar intakes compared to children who do not drink flavored milk.47 In addition, children who drink
flavored milk have higher total milk intakes compared to those who exclusively drink white milk, and total milk drinkers do not have higher Body Mass Indices (BMIs) compared to non-drinkers.48 Sweetened, nutrient-dense
foods such as milk, yogurt and cereals contribute to improved nutrient intakes.49 In adolescents, drinking
flavored milk at 12 years was found to be a “significant predictor” of higher dairy intakes at 12 and 17 years, and flavored milk drinkers were more likely to maintain dairy intakes above median levels.50 Flavored milk has
essentially the same nutrient profile as white milk.51
AHA recognizes the value of flavored milk in their 2009 scientific statement on Dietary Sugars Intake and Cardiovascular Health, “In addition, sugars add desirable sensory effects to many foods, and a sweet taste promotes enjoyment of meals and snacks. In fact, when sugars are added to otherwise nutrient-rich foods, such as sugar-sweetened dairy products like flavored milk and yogurt and sugar-sweetened cereals, the quality of children’s and adolescent’s diets improves, and in the case of flavored milks, no adverse effects on weight status were found.” 52
USDA evaluated school meal program participants versus non-participants based on SNDA-III data by examining food intake by participants and non-participants using a modified Healthy Eating Index 2005 score and found that diet quality of all children could be improved.55 All children (both participants and
non-participants) had low intakes of vegetables, whole grains and low-fat and fat-free milk, plus high intakes of sodium, solid fats and added sugars. However, NSLP participants scored higher on the milk component of the modified Healthy Eating Index 2005 score.55
Findings from SNDA-I (conducted 1991-1992) and SNDA-III (conducted 2004-2005) both indicate that overall children’s diets contain an excess of energy, fat, saturated fat and sodium.56-57 In 1991-1992, school
meal participation was associated with higher intakes of total fat, saturated fat and sodium, but by 2004-2005, school meal participation was associated with higher intakes of sodium, but not total fat or saturated fat.57
A change in the fat level of milks offered in schools may have been among several factors that contributed to this shift. Among NSLP participants who consumed milk, 71% chose whole or 2% milk in 1992, while in 2005, only 21% drank these higher fat milks.6 This shift
pre-dates the requirement for school milk to be low-fat or fat-free, which may be because USDA encouraged fat reduction through the School Meals Initiative.2, p.8
To build
nutrient-dense dietary
patterns, the 2010
Dietary Guidelines
recommends
increased
consumption of
low-fat and low-fat-free milk
and milk products,
fruits, vegetables
and whole grains.
SCHOOL MEALS: MILK AND NUTRITION
Children who participate in the federal school meals programs drink more milk than
non-participants.
53-55Children who participate in school meal programs also have
better nutrient intakes,
55-56including higher mean intakes of calcium and potassium.
57Milk consumption is positively associated with NSLP participation at
all school levels and for almost all milk varieties.
54Flavored milk is a minor
contributor to added sugars intake
In 2004-2005, 66% of the milk in schools was flavored,6
while at the same time, the leading contributors to intakes of added sugars were carbonated sodas and juice drinks, accounting for 30-55% of calories from added sugars for all groups of children.55 NSLP
participants and non-participants obtained far more added sugars from soda and fruit drinks than from flavored milk, though participants obtained slightly more of their added sugar intakes from flavored milk than matched non-participants. For example, NSLP participants from middle school obtained 42% of
added sugars from soda and fruit drinks, combined, and 5% from flavored milk, while non-participants obtained 55% added sugars from soda and fruit drinks and about 2% from flavored milk.
This pattern continues to be seen in 2007-2010 NHANES data. In recent years, Americans have begun to drink less soda, but carbonated sodas and fruit drinks still contribute 47% of calories from added sugars while flavored milk contributes only about 4% in the diets of children (see Figure 3).35 In addition, foods
like sweetened bakery products, desserts and candy contribute 28% of added sugars in children’s diets.35
Soft Drinks; 22.9 Fruit Juices; 13.9 Sweet Bakery Products; 11.9 Other Desserts; 8.6 Other; 7.1 Candy; 7.1 Ready-To-Eat Cereals; 5.5 Sugars; 4.5 Flavored Milk; 4.3 Coffee, Tea; 3.5 Sports & Energy Drinks; 2.8 Breads, Rolls, Tortillas; 2.2 Quick Breads, Bread Products; 1.6 Condiments, Sauces;1.4
Yogurt; 1.3 Dairy Drinks & Substitutes; 1.1
Percent of Total Added Sugars from Foods and Beverages Teaspoon Equivalents of Added Sugars
Soft Drinks... 4.4 Fruit Juices... 2.7 Sweet Bakery Products... 2.3 Other Desserts... 1.6 Other... 1.4 Candy... 1.4 Ready-To-Eat Cereal... 1.1 Sugars... 0.9 Flavored Milk... 0.8 Coffee, Tea... 0.7 Sports & Energy Drinks... 0.5 Breads, Rolls, Tortillas... 0.4 Quick Breads, Bread Products... 0.3 Condiments, Sauces... 0.3 Yogurt... 0.2 Dairy Drinks & Substitutes... 0.2
Figure 3: Total Added Sugars from Foods and Beverages
(Children 2-18 years)
Source: Dairy Research Institute®, NHANES 2007-2010. (Nutrition Impact, LLC analysis. Ages 2+ years). Data Source: U.S. Department of Agriculture, Agricultural Research Service. 2013. Food Patterns Equivalent Intakes from Food: Consumed per Individual, by Gender and Age, What We Eat in America, NHANES 2007-2008, 2009-2010. Available at: www.ars.usda.gov/ba/bhnrc/fsrg
Milk continues as a core
component in revised school
meal nutrition standards
In 2009, the IOM released a report entitled School Meals: Building Blocks for Healthy Children.25 SNDA-III
data was used to determine energy and nutrient intakes of school children. Concerns about child health and weight, and the contributions that school meals make to the overall diet, contributed to the revised standards for school meals outlined in the Healthy, Hunger-Free Kids Act.
The report found that, on average, school-aged children (including both school meal program participants and non-participants) under-consumed most of the food groups recommended in the 2005 Dietary Guidelines, including low-fat and fat-free milk and milk products, whole grains, fruits and vegetables. Students also exceeded daily recommendations for added sugars, saturated fat and total fat. Using this information, food-based recommendations were developed to provide appropriate levels of energy and nutrients for school breakfast and lunch meals.
Regarding milk, the report noted that if milk is not part of lunch, “the nutrient content is well under 80 percent of the target for calcium and phosphorus, and also leads to shortfalls in potassium and/or riboflavin, depending on the age-grade group. In addition, the vitamin D content of the meal would be very low.” The Committee recognized that flavored milk can help promote milk intake, and they recommended fat-free flavored milk because it contributes fewer calories than low-fat flavored milk. While the recommendations did not include specifics about sugar content of flavored milk, upper limits on calories for meals would favor lower sugar choices. USDA’s final rule recommended fat-free flavored and low-fat and fat-free white milk, recommendations that were implemented in schools during the 2012-2013 school year.
Does lowering the calories in flavored
milk in schools affect milk intakes and
therefore nutrition?
Steady progress has been made in reducing the sugar content of flavored milk offered in schools, as illustrated by an annual school survey conducted jointly by the
School Nutrition Association, Milk Processor Education Program (MilkPEP) and National Dairy Council.7 In 2013,
the average flavored milk serving in schools contained 10 fewer calories than the previous year, and 44 fewer calories than in 2007.7
Before the 2012-2013 changes, evaluation of lower calorie low-fat and fat-free flavored milks indicated reformulated milks continued to be popular among students.58-59 In these studies, the milks tested had
been reformulated to be either lower fat or lower sugar, but did not include flavored milks that were fat-free and lower sugar that would meet the standards put in place in 2012-2013.
In contrast, more recent studies indicate that when flavored milk is reduced or removed, children may drink less milk overall. In Boston schools, removal of flavored milk during 2012-2013 led to a 24% decrease in total milk selected during the second year after removal, and students consumed 10% less of the milk selected.60
Another study published in 2014 also found that when flavored milk is removed from schools, it may lead students to take less milk overall, drink less (waste more) of the white milk that is taken and no longer purchase school lunch.61
In 2013, the average
flavored milk serving
in schools contained
10 fewer calories
than the previous
year, and 44 fewer
calories than in
2007.
Requirement to Offer Milk
Historically, milk was the only specific food or beverage required to be offered with all school meals. The Healthy, Hunger-Free Kids Act regulations have introduced more prescriptive requirements for some other food groups, but milk’s place remains unique in that it is required as a product, not a food group – e.g., to meet the half-cup requirement for fruit at lunch, it does not matter whether schools offer apples or bananas; but the fluid milk requirement can only be met by fluid milk (or in limited cases a substitute beverage), not by juice or water.
Offer Versus Serve
For lunches and breakfasts, milk must be offered, but does not have to be served if the student declines to take it. This offer versus serve policy has been in effect for many years and must be implemented for high schools; local schools can decide whether to implement it for other grades. A similar policy applies for milk served as part of the SFSP (if provided by schools). Offer versus serve does not apply to the milk requirements under most CACFP meals.62 Analysis of SNDA-IV data showed
that students take milk with about 85% of school lunches and 76% of breakfasts, or an average of 83% of the time for both programs together.33
Requirement for Low-Fat and Fat-Free
Milk; Substitute Beverages
Under current regulations, which are based on the Dietary Guidelines for Americans as mandated by the Healthy, Hunger-Free Kids Act, milk in the NSLP and SBP can be low-fat (1%) or fat-free if unflavored, and must be fat-free if flavored. Although the requirement for school milk to be low-fat or fat-free is relatively new, many districts had in fact made major changes in fat varieties well before the new regulations. An analysis comparing two SNDA reports (SNDA-I and -III) showed a significant shift in milk consumption from the early 1990s to 2005.6 In the earlier period, about three-quarters of
students chose either whole or reduced-fat (2%) milk.
But by 2005, almost 80% of students chose low-fat or fat-free varieties. USDA encouraged fat reduction through the School Meals Initiative.6, p. 6; 2
Lactose-free milk is specifically permitted by law.29,30
Substitute beverages, such as those derived from soybeans, rice and other plants are available under certain circumstances. For children with a medical disability that precludes milk, schools must supply a substitute. In other situations where students have a need that does not rise to the level of a disability, schools may provide a substitute beverage but are not required to do so. If schools do offer substitutes, the beverages must contain levels of specified nutrients equivalent to those in milk, including vitamins A and D, calcium, protein and others. No substitutes may be made generally instead of milk; rather, the law and regulations require that they be available only to students with a medical or other special dietary need identified in writing, either by a medical professional or by a parent or legal guardian.63
No Restrictions on Milk Sales
An additional statutory provision dealing with milk is sometimes called the “anytime, anywhere” law. Schools may not restrict their ability to offer milk at any time or in any location on school grounds or at a school-sponsored event. This policy was enacted in 2004 in reaction to “exclusive sales contracts” that schools had formerly negotiated with major soft-drink providers. These contracts were occasionally interpreted to preclude schools from offering milk in certain situations (e.g., in vending machines). Though the vending landscape in schools has changed considerably in recent years, the “anytime, anywhere” policy continues to protect schools against any restrictions. The policy does not, of course, require schools to offer milk in any particular setting, other than what is required under the school meal regulations – it simply ensures that schools do not lose this option.63
MILK REQUIREMENTS
Previous sections of this paper described the major provisions of USDA’s
school-based nutrition programs, including regulations on foods and beverages sold
competitively, and described milk’s unique nutrient package as well as the evolution
of school milk standards in recent years. This section looks specifically at the current
requirements applicable to fluid milk in these programs.
Conversely, declines in milk consumption can have negative nutritional consequences, especially if milk is replaced by less-healthy beverages. In addition, work by National Dairy Council has shown that if milk can be made more appealing to kids, average daily participation in the lunch and breakfast programs will often
increase.64 This means that not only are more students
getting the nutritional benefits of milk, but they also have the opportunity to increase consumption of fruits, vegetables and whole grains through the reimbursable meals.64 Therefore, it is important to be alert to factors
that may reduce school milk consumption. Several such factors have drawn attention in recent years.
Declining Average Daily Participation
Although it is not clear whether the phenomenon will be long-lived, average daily participation in the NSLP fell 3% in 2013, a decline of approximately 1 million students each day. This decline followed the implementation of the new nutrition standards and the decline continued in 2014.28, 65 A vigorous
debate continues about this decline, but all interested parties agree on the importance of reversing it. In addition, when participation falls, school milk consumption is likely to decrease as well. Efforts to increase participation hold promise for improving milk consumption; conversely, if the lunch program continues to attract fewer students, milk consumption may fall.
Increasing participation could provide multiple nutritional improvements in the diets of children and adolescents. Two studies have shown that school lunches tend to be healthier than those brought from home, and home-packed lunches are much less likely to contain milk. In addition to increasing milk consumption, a higher participation rate would also give students access to a range of other healthy foods, especially vegetables.66, 67
Offer Versus Serve
The availability of offer versus serve to students in middle and high school (and some elementary students) means that even though milk must be offered with each meal, not every student will take it. As noted earlier, data from the most recent SNDA show that about 85% of students take milk with lunch, and about 76% with breakfast, for a blended average for both programs of approximately 83% (the higher rate for lunch weighs more heavily because the lunch program is larger).31, 68
However, SNDA-IV was conducted before the new nutrition standards – including new limits on low-fat milk, discussed below – were implemented. It is unknown whether the 83% “take rate” of milk at school meals has remained the same, fallen or increased.
CURRENT SCHOOL MILK ISSUES
When school milk consumption increases, students derive multiple benefits. First,
because milk is under-consumed by most age groups, increased consumption
of school milk will bring students closer to nutrient recommendations for calcium,
potassium, vitamin D and other key nutrients provided by milk.
8Declines in milk
consumption can
have negative
nutritional
consequences,
especially if milk is
replaced by
less-healthy beverages.
Water Availability
Offer versus serve interacts with another new
requirement in the Healthy, Hunger-Free Kids Act, which stipulates that schools must provide all students with free, easily accessible drinking water in the cafeteria.63 In
some schools, this is simply a water fountain; in others, the requirement is met through dispensers with cups or other service arrangements. This means that milk, while still required to be offered, is no longer the only easily-accessible beverage that a student can get without paying extra. Again, to date no studies have measured whether and to what extent the water requirement has affected milk’s “take rate.”
Fat Levels
As explained in a prior section, many schools made the transition to low-fat and fat-free milk well before USDA required it. In some cases, schools used lower-fat milk to help them meet the NSLP requirement that lunches derive no more than 35% of their calories from total fat. However, before the Healthy, Hunger-Free Kids Act, 2% milk was the primary fat variety offered and selected in children’s overall diets – in and out of school – 2% milk was reported as the most frequently consumed variety by the International Dairy Foods Association based on retail data.69, p.68 The popularity of 2% milk
has caused some concern that students’ in-school consumption may be adversely affected by the lower fat requirements. These requirements are; however, consistent with both the 2005 and 2010 editions of the Dietary Guidelines.
Lactose Intolerance and Maldigestion
Lactose intolerance has received substantial attention in recent years. Lactose intolerance refers to the gastrointestinal symptoms that can result from not completely digesting lactose, the sugar found naturally in milk. Lactose maldigestion is the decline in some individuals’ production of lactase, the enzyme that digests lactose. Many people who believe they have lactose intolerance are not maldigesters, and many people who are lactose maldigesters do not develop symptoms of lactose intolerance, so it is difficult to estimate precise prevalence rates.70
Some individuals, especially in members of minority populations in which the incidence of lactose maldigestion is higher, avoid or limit dairy foods. The potential nutritional shortfalls have alarmed medical societies such as the National Medical Association (NMA), the largest organization of African American physicians.37 A 2007 study of young adolescent girls
found that because of perceived lactose intolerance, many utilized self-imposed restrictions on dairy foods. This was associated with lower spinal bone mineral content, potentially increasing their risk for osteoporosis later in life.71 NMA as well as the American Academy
of Pediatrics (AAP) and other groups have encouraged strategies that will help most people with lactose intolerance to consume dairy without problems.37, 72
These strategies can involve mixing milk with other foods, such as soups and cereal so the solid foods can help slow digestion and allow the body more time to digest lactose. Consuming easy-to-digest yogurt with live and active cultures also helps to digest lactose.37, 72, p.1284
In the school setting, lactose-free cow’s milk is also an important alternative. Under the law, lactose-free milk satisfies the requirement to offer milk with school meals. It is typically more costly than regular milk, but not necessarily more expensive than substitute beverages made from soy or other non-dairy sources. Unlike these beverages, no written documentation is required for students to receive lactose-free cow’s milk.29
Flavored Milk
Recent debates over flavored milk were discussed earlier in this paper. In the context of the current school meal environment, flavored milk requirements have undergone a significant change. All flavored milk must be fat-free; schools continue to offer low-fat milk, but it must be unflavored. White fat-free milk is also allowed.29
The new requirement has led to concerns that fat-free flavored milk may not appeal to some students because of differences in mouth feel and taste profile. Since approximately two-thirds of all milk in the schools is flavored, consumption could suffer significantly if a large number of students responded negatively.
Enhancing the School Milk Experience
As nutritious as low-fat and fat-free milks are, they provide little benefit if students fail to consume them. National Dairy Council and the School Nutrition Association collaborated in the early 2000s on a pilot project that tested improvements in flavor variety, refrigeration, merchandising and packaging.64
The “New Look of School Milk,” eventually adopted by about 10,000 schools, demonstrated an ability to increase participation in meal programs and also reduce waste (students were more likely to finish the milk they took).64 In the pilot test, schools were assisted
to implement four basic improvements: (1) at least one additional flavor in addition to chocolate, (2) carefully monitored refrigeration at optimum temperature, (3) attractive merchandising typically displaying milk in a glass-front cooler similar to those found in convenience stores, and (4) re-sealable plastic bottles with attractive graphics.
On average, the schools participating in the pilot saw milk sales increase 15% in elementary schools and 22% in secondary schools. Students also drank more of the milk with a 35% increase in milk consumption in elementary schools and a 39% increase at secondary schools. Average daily participation in meal programs went up 1.5% in elementary schools and 4.8% in secondary schools.64 Expansion of this model has
been hindered due to the increased cost of the enhanced packaging.
The “New Look
of School Milk,”
demonstrated an
ability to increase
participation in
meal programs and
also reduce waste
(students were more
likely to finish the milk
The Challenge of Measuring Milk
Consumption in Schools
USDA publishes extensive and detailed statistics on school meals – the number served, the average daily number of students eating the meals, the number of institutions participating, and other information.26
USDA does not, however, directly track the specific food components of these meals, including milk. USDA, of course, has oversight of the meals’ content. Detailed regulations prescribe the food groups from which schools select menu items. Schools must certify that these regulations are met in order to receive federal reimbursements for the meals they serve. In addition, USDA has an established system for reviewing schools’ compliance with these and other requirements.27, 28
What USDA does not do is to track every food offered with every meal.
Milk is procured directly from fluid milk companies by individual school districts through a competitive bid process. The scores of milk companies serving more than 13,000 school districts means there is not a unified database that cumulates and reports school milk sales.10 Thus, neither the government nor the private
sector measures total school milk consumption directly. As noted, fluid milk is unique in that it must be offered with each school lunch and breakfast (as well as with SFSP and CACFP meals). However, because of the offer versus serve regulations, milk will not actually be taken by all students as they go through the meal line. A very high percentage of students do, in fact, take milk with their lunches or breakfasts, but it is always less than 100%. Data generated by the various School Nutrition Dietary Assessments (SNDA) can be used to estimate the “take rate” for milk in lunch and breakfast
programs, and NDC has done so in unpublished work. This work shows that for the 2009-2010 school year when the most recent SNDA surveys were conducted, 85% of students took milk with lunch, and 76% with breakfast.31, 68 These numbers are quite similar to
estimates derived from earlier SNDA studies and from other data.
Therefore, one way to estimate milk consumption in the NSLP and SBP is simply to multiply the number of meals served in a school year by the “take rate” for the respective programs. This is an imperfect method because if something has changed since SNDA-IV in students’ tastes and preferences for milk – thereby changing the “take rate” – then that change will not show up in the estimate. A change in the milk served in schools has in fact occurred during this period: Beginning in 2012-2013, new regulations have restricted flavored milk, accounting for around two-thirds of school consumption, to fat-free varieties.
An estimate on the basis of past “take rates” will not reflect changes in these rates, which may have occurred in the past few years.
Milk Consumption
in Light of Lower ADP
Despite these ambiguities, one thing is clear, all other things being equal: If average daily participation (ADP) in the meal programs goes down, so will school milk consumption. Therefore, examining ADP data makes it possible to estimate whether students are drinking less milk or more.
Milk consumption through the NSLP during SY 2011-2012, before new lunch regulations took effect, can be compared with each of the succeeding years. USDA reports the data by fiscal years although the various
ESTIMATING CURRENT SCHOOL MILK
CONSUMPTION AND TRENDS
Recent declines in school lunch participation, as well as the issues identified in the
previous section, raises questions whether school milk consumption is declining,
holding its own or increasing. Unfortunately, no direct measurements are available,
though reasonable estimates can be made. This section discusses such estimates
and reports the views of school nutrition directors.
regulations were effective at the beginning of school years, which run from July through June. Given low numbers of meals served during the summer months, fiscal years and school years will generally reflect the same trends.
In FY 2012, the NSLP served a total of 5,214,822,572 meals. At a “take rate” of 85%, this implies that students took about 4.433 billion half-pints (rounded to avoid giving an impression of greater precision than actually exists). In FY 2013, total NSLP meals fell to 5,097,746,603, a drop of 2.2%, and milk therefore fell to about 4.333 billion half-pints.65 In FY 2014, preliminary
data show that NSLP served a total of 4,993,085,135 meals.73 This further decline of 2.1% suggests students
took 4.244 billion half-pints in the most recent year. Thus, it appears that the fall in ADP has probably reduced the milk consumed in school lunches by 189 million half-pints since 2012, a cumulative two-year decline of about 4.3%.
Increases in consumption through other school-based nutrition programs may have largely offset the decline at lunch. Nevertheless, since the NSLP is by far the largest school feeding effort in the nation, attracting several times as many children as any of the other programs, a decline in milk consumption in the NSLP is cause for concern, since it likely means that fewer students are meeting Dietary Guidelines recommendations for dairy foods consumption. These students may be getting fewer essential nutrients than if they ate a school lunch with milk as the beverage. Their long-term nutritional adequacy and health could be compromised.
School Nutrition Directors’ Viewpoints
In the absence of direct nationwide measurements of milk consumption, expert viewpoints may be
informative. With this in mind, during the third quarter of 2014, NDC surveyed school nutrition directors in 112 school districts serving 7,104 individual schools in 41 states to obtain their views on current issues involving school milk.74
These directors believe that their students like school milk. Asked to rate students’ acceptance of milk on a 1-4 scale with 4 meaning “very favorable,” the directors gave milk an average rating of 3.3. Milk at lunch was rated slightly higher (3.4) than milk at breakfast (3.3).
When asked about factors that may have an impact on milk sales –
• 74% said the variety of milk available had a positive impact;
• 72% found a positive impact from the quality and taste of the milk;
• 71% and 67% felt the quality of accompanying food at breakfast or lunch (respectively) had a positive impact on milk consumption;
• 58% thought the location of milk in the cafeteria had a positive impact; and
• 38% felt the availability of other beverages in the cafeteria had a negative impact.
Asked further about other beverages, 93% reported they now served water, as required by USDA regulations. Almost as many, 91%, said they served juice, while 53% served sports drinks.
In open-ended comments, the directors brought up several factors that they felt would tend to enhance milk sales. The single factor mentioned most often was the availability of chocolate or other flavors. Also mentioned were plastic bottles, breakfast in the classroom,
appropriate refrigeration and promotional materials.
It appears that the fall
in ADP has probably
reduced the milk
consumed in school
lunches by 189 million
half-pints since 2012,
a cumulative two-year
decline of about 4.3%.
School Milk Taste Panels: Focus on
Fat-Free Chocolate Milk
USDA’s regulations to implement the Healthy, Hunger-Free Kids Act applied the 2010 Dietary Guidelines to the components of school meals, including milk. These regulations limited milk to low-fat (1%) or fat-free varieties, and further required that flavored milk must be fat-free. Prior to these regulations, low-fat flavored milk was the most frequently served in many schools, although other schools had already introduced fat-free flavored milk.6 Therefore, under the new regulations,
children and adolescents in a number of schools are being offered flavored milk that may be different from what they have previously received with their school meals in terms of taste, mouth feel and other sensory factors. In addition, this fat-free flavored milk is likely to be different from flavored milk that the students are accustomed to consuming from retail or food-service channels.75
This transition raises the question: how well do students like the fat-free flavored milks available in schools? This is relevant because above the primary grades (and in some cases even in these grades), students decide for themselves whether they will take milk with their reimbursable school lunches and breakfasts, and if they do not like the milk served, students might choose to take other beverages like water or juice.
Many characteristics of chocolate milk contribute to “liking,” including fat level, sugar level, type of chocolate flavor used, color and amount of dry dairy ingredients added (to enhance texture and nutrition). Packaging (plastic bottle or cardboard) and temperature can also affect “liking.” There are many milk companies who package milk for schools, and each develops their own proprietary formula to accommodate cost and ingredient parameters.
USDA has not indicated that it performed sensory testing, conducted taste panels or otherwise surveyed students prior to adoption of the new rules. To form some idea of how well-liked milks that meet the new rules are, NDC arranged for taste panels of students in grades 6-12, divided equally between males and females, in four significant urban markets in the Northeast, Southeast, Southwest and Midwest.