Theses, Dissertations and Capstones
2018
Impact of Educator Preparation Routes and
Teacher Characteristics on Student Academic
Achievement
Robert Hagerman
hagerman@marshall.edu
Follow this and additional works at:https://mds.marshall.edu/etd
Part of theCurriculum and Instruction Commons,Educational Assessment, Evaluation, and Research Commons, and theTeacher Education and Professional Development Commons
This Dissertation is brought to you for free and open access by Marshall Digital Scholar. It has been accepted for inclusion in Theses, Dissertations and Capstones by an authorized administrator of Marshall Digital Scholar. For more information, please contactzhangj@marshall.edu,
beachgr@marshall.edu.
Recommended Citation
Hagerman, Robert, "Impact of Educator Preparation Routes and Teacher Characteristics on Student Academic Achievement" (2018).
Theses, Dissertations and Capstones. 1198.
IMPACT OF EDUCATOR PREPARATION ROUTES AND TEACHER CHARACTERISTICS ON STUDENT ACADEMIC ACHIEVEMENT
A dissertation submitted to the Graduate College of
Marshall University In partial fulfillment of the requirements for the degree of
Doctor of Education in
Curriculum and Instruction by
Robert Hagerman Approved by
Dr. Samuel Securro, Committee Chairperson Dr. Lisa Heaton
Dr. Andy Whisman
Marshall University August 2018
iii
DEDICATION
I dedicate this dissertation to my wife Robyn and to my children Hailey and Kyle. I could not have done this without them. To my wife, for not letting me give up and for her unconditional support. To my children, for inspiring me and believing in me. Thank you for making this possible.
iv
ACKNOWLEDGMENT
I would like to give very special thanks to Dr. Securro for sticking with me and pushing me, and for his dedication to my success. You are an incredibly patient individual. To my Committee members Dr. Heaton and Dr. Whisman, thank you for your support, knowledge, willingness to assist me through this process, and for your kindness. In addition, I would like to thank the many faculty members at Marshall University for their guidance and my work
colleagues who never hesitated to guide me no matter what and who have been a constant source of encouragement.
v
TABLE OF CONTENTS
Acknowledgment iv
List of Tables ix
List of Figures xii
Abstract xiv
Chapter 1 1
Introduction 1
Statement of the Problem 6
Research Questions 6 Null Hypotheses 7 Operational Definitions 8 Limitations 11 Delimitations 12 Rationale 12 Summary 15 Chapter 2 16 Review of literature 16
Student Academic Performance and Teacher Preparation Route 16 Student Academic Performance and Teacher’s Years of Experience 19 Student Academic Performance and Type of State Teaching Licensure 21 Student Academic Performance and Highly Qualified Designation of Teachers 22
Summary 23 Chapter 3 25 Methods 25 Purpose 25 Design 25 Population 26
Research Questions and Data Analysis 26
Procedures 27
Data Request 27
Data Collection and Match 28
vi
IRB Protocol 28
Data Analysis 29
Summary 29
Chapter 4 31
Data Analysis and Results 31
Purpose 31
Data 31
Population/Sample 31
Research Questions and Data Analysis 33
Research Question #1 33 Summary 39 Research Question #2 39 English 5 40 Math 5 41 English 11 42 Math 11 43 Summary 45 Research Question #3 46 English 5 46 English 11 47 Math 5 49 Math 11 51 Math 11 51 Summary 52 Research Question #4 53 English 5 53 English 11 54 Math 5 56 Math 11 58 Summary 59 Research Question #5 60 English 5 60
vii Math 5 61 Math 11 62 English 11 63 Summary 65 Research Question #6 65 English 5 65 English 11 68 Math 5 70 Math 11 71 Summary 72 Research Question #7 73 English 5 73 English 11 75 Math 5 77 Math 11 78 Summary 80 Research Question #8 80 English 5 80 English 11 82 Math 5 83 Math 11 84 Summary 85 Chapter 5 87
Conclusions, Discussion and Recommendations 87
Overview 87
Research Questions 88
Findings 88
Conclusions and Discussion 90
Recommendations for Further Study 97
Summary 98
References 100
viii
Appendix B: Scale Score Range 109
ix
LIST OF TABLES
Table 1 Sample Sizes for Variable Factors Across Grade Levels and Content Areas 32 Table 2 Group Statistics Data for Alternatively or Traditionally Certified 5th Grade
Math Teachers
33
Table 3 Independent Samples T-Test for 5th Grade Math Teachers, Alternatively or Traditionally Certified
34
Table 4 Group Statistics Data for Alternatively and Traditionally Prepared 11th Grade Math Teachers
35
Table 5 Independent Samples T-Test for Alternatively and Traditionally Prepared 11th Grade Math Teachers
35
Table 6 Group Statistics Data for Alternatively and Traditionally Prepared 5th Grade English Teachers
36
Table 7 Independent Samples T-test for Alternatively and Traditionally Prepared 5th Grade English Teachers
37
Table 8 Group Statistics for Teacher Preparation Variable, 11th Grade English Teachers
38
Table 9 Independent Samples T-Test for Teacher Preparation Variable, 11th Grade English Teachers
38
Table 10 Percentages of Frequencies in Categorical Performance Levels across Grade and Content
45
Table 11 Descriptive Scaled Score Data for 5th Grade English, Teacher Experience Levels
46
Table 12 Analysis of Variance Data for 5th Grade English, Teacher Experience Levels
47
Table 13 Descriptive Data for 11th Grade English, Teacher Experience Levels 47
Table 14 Analysis of Variance Data for 11th Grade English Teacher Experience Levels
48
Table 15 Descriptive Data for 5th Grade Math, Teacher Experience Variable 49
Table 16 Analysis of Variance for 5th Grade Math, Teacher Experience Variable 49 Table 17 Descriptive Data for 11th Grade Math, Teacher Experience Levels 51 Table 18 Analysis of Variance Data for 11th Grade Math, Teacher Experience Levels 51
x
Table 19 Kruskal-Wallis Mean Ranks Data for Experience Levels of 5th Grade English Teachers
53
Table 20 Kruskal-Wallis Test of Significance Data for 5th Grade English, Teacher Experience
54
Table 21 Kruskal-Wallis Mean Ranks Data for Experience Levels of 5th Grade Mathematics Teachers
56
Table 22 Kruskal-Wallis Test Statisticsa,b of Years of Experience for 5th Grade Mathematics Teachers
56
Table 23 Mean Ranks Data for 11th Grade Math, Teacher Experience Variable 58 Table 24 Test Significance Data for 11th Grade Math, Teacher Experience Variable 58 Table 25 Descriptive Data for 5th Grade English Teachers, Certified Variable 60 Table 26 Analysis of Variance for 5th Grade English Teachers, Certified Variable 61 Table 27 Descriptive Data for 5th Grade Math Teachers, Certified Variable 61 Table 28 Analysis of Variance for 5th Grade Math Teachers, Certified Variable 62 Table 29 Descriptive Data for 11th Grade Math Teachers, Certified Variable 62 Table 30 Analysis of Variance for 11th Grade Math Teachers, Certified Variable 63 Table 31 Descriptive Data for 11th Grade English Teachers, Certified Variable 63 Table 32 Independent Samples T-Test of Significance for 11th Grade English
Teachers
64
Table 33 Mean Ranks English 5 65
Table 34 Group Statistics English 5 66
Table 35 Group Statistics Data for Certified and Noncertified 11th Grade English
Teachers Group Statistics
68
Table 36 Mann-Whitney U Test of Independence for Certified and Noncertified 11th Grade English Teachers Across the Categorical Levels
69
Table 37 Mean Ranks Data for Certified and Noncertified 5th Grade Math Teachers 70 Table 38 Mann-Whitney U Test of Independence for Certified and Noncertified 5th
Grade Math Teachers
70
Table 39 Descriptive Data for Highly and Non-highly Qualified 5th Grade English Teachers
xi
Table 40 Independent Samples T-Test for Highly Qualified and Non-highly Qualified 5th Grade English Teachers
74
Table 41 Independent Samples T-Test for Highly Qualified and Non-highly Qualified 11th Grade English Teachers
75
Table 42 Independent Samples T-Test for Highly Qualified and Non-highly Qualified 11th Grade English Teachers
76
Table 43 Group Statistics Data for Highly Qualified and Non-highly Qualified 5th Grade Math Teachers
77
Table 44 Independent Samples T-Test for Highly Qualified and Non-highly Qualified 5th Grade English Teachers
77
Table 45 Group Statistics Data for Highly Qualified and Non-highly Qualified 11th
Grade Math Teachers
78
Table 46 Independent Samples T-Test of Scaled Scores for Highly Qualified and Non-highly Qualified 11th Grade Math Teachers
xii
LIST OF FIGURES
Figure 1 Visual and numerical data comparing categorical rankings and performance levels among alternatively and traditionally prepared 5th grade English teachers
40
Figure 2 Visual and numerical data comparing categorical rankings and performance levels among alternatively and traditionally prepared 5th grade math
teachers
41
Figure 3 Visual and numerical data comparing categorical rankings and performance levels among alternatively and traditionally prepared 11th grade English teachers
42
Figure 4 Visual and numerical data comparing categorical rankings and related student performance levels among alternatively and traditionally prepared 11th grade math teachers
43
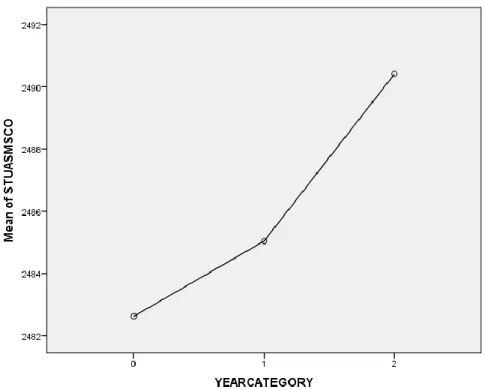
Figure 5 Line Plot of Experience Nodes for 0-3; -4-9 and 10> for Teacher Experience
50
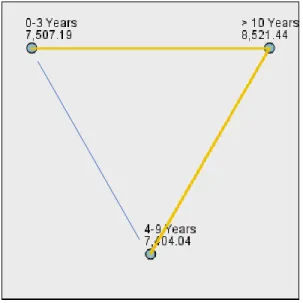
Figure 6 Teacher Experience Levels and Mean Scaled Scores for 11th grade
Mathematics
52
Figure 7 Visual and numerical data for staff years for 11th Grade English Teachers 55 Figure 8 Visual and Numerical Data for 5th Grade Math Teacher Experience 57 Figure 9 Visual and Numerical Data for Experience Nodes of 11th Grade Math
Teachers
59
Figure 10 Median Ranks Data for Effects on Type of Licensure for Certified and Noncertified 5th Grade English Teachers
67
Figure 11 Mann-Whitney U Numerical and Graphic Data for Certified and Noncertified 5th Grade Math Teachers
72
Figure 12 Mann-Whitney U Median Ranks Descriptive and Inferential Data for Effects on Categorical Rankings Among Qualified and Nonqualified 5th Grade English Teachers
81
Figure 13 Mann-Whitney U Median Ranks Descriptive and Inferential Data for Effects on Categorical Rankings Among Qualified and Nonqualified 11th Grade English Teachers
82
Figure 14 Mann-Whitney U Median Ranks Descriptive and Inferential Data for Effects on Categorical Rankings Among Qualified and Nonqualified 5th Grade Math Teachers
xiii
Figure 15 Mann-Whitney U Median Ranks Descriptive and Inferential Data for Effects on Categorical Rankings Among Qualified and Nonqualified 11th
Grade Math Teachers
xiv ABSTRACT
This study investigated the effect of traditional and alternative teacher preparation, years of service, and type of licensure held and teacher quality on English language arts and mathematics summative assessment scaled scores and performance levels among West Virginia students in grades 5 and 11. Specifically, this research analyzed theexisting assessment data in West Virginia’s 55 counties, regarding teacher preparation routes, teacher experience, teacher
licensure, and the teacher’s Highly Qualified (HQ) designation to determine the effect on student achievement. The study was designed with the aforementioned variables and applied a
standardized summative content assessment outcome to the two grade levels and two content disciplines. Data analysis indicated that the majority of teacher quality variables had a statistically significant impact on student achievement. As with every aspect of education, various socio-economic variables and teacher and student characteristics not measured in this study, and not known, may impact the standardized achievement results of the students.
1 CHAPTER 1 INTRODUCTION
Since the beginning of formal public education in the 1600s, there has been an ongoing debate arguing the best way to prepare teachers to positively impact student outcomes (Boyd, Grossman, Lankford, Loeb, & Wyckoff, 2008). Education constituencies, including teachers, administrators, higher education faculty, and policy makers,have advocated for teacher preparation that includes more time in the classroom as candidates learn the content they will teach. Others within these constituencies believe individuals who have mastered the content knowledge and have succeeded in professions other than education are better poised to serve P-12 students as more effective teachers. Many of these same individuals profess that a field-based program such as alternative education where candidates are in the classroom as the teacher of record from day one is more effective. As a result of teacher shortages and critical needs, states offer a variety of pathways and often define these very differently (Mader, 2013). Some of these pathways continue to exist while others, such as the Transition to Teaching program in West Virginia, are defunct.
According to a report by the Office of Innovation and Improvement at the U.S.
Department of Education (2004), states have created alternative programs where that state claims the field should allow other professionals to enter the profession laterally and decrease the
entrance requirements. The majority of states across the country have an alternate route for teacher certification compared to the traditional four-year route. As a result of the turn-over rate and lack of qualified applicants, local education agencies and school district administrators advocate to recruit professionals from industry and other fields, including military veterans, to become teachers. Because there is a large number of vacancies in schools across the country,
2
states are considering less restrictive and potentially less rigorous pathways to becoming a
qualified teacher. Their opposing counterparts, institutional faculty and many practitioners, argue that more restrictions, requirements and rigor should be introduced to improve the quality that teacher education students receive (Walsh, Joseph, & Lewis, 2016).
The majority of the research on teacher quality within the context of educational policy is inconclusive (Rice, 2003) and has been conducted to investigate two aspects of the teacher’s quality: either preparation or experience. These approaches limit the scope of the findings and place the main focus on elements of either the preparation process or general years of experience rather than on the outcome of such preparation as demonstrated by student achievement. Most studies have taken place in a single district, school or city, rather than in whole states or across multiple districts (Boyd et al., 2008; Robinson, 2011; Suell and Piotrowski, 2006;). The focus
has been on the difference between alternative programs and traditional routes (Gimbert, Bol, &
Wallace, 2007; Suell and Piotrowski, 2006). Through the years, available research examined the
relationship between teachers prepared in alternative programs to teachers prepared in traditional programs. A main intent of the current study is to determine if the different preparation routes, and how teachers implement related teaching practices and standards, impact the academic achievement of students.
According to the No Child Left Behind Act (U.S Department of Education, 2004) all students must be taught by highly qualified educators. Within this mandate there are very specific measures of growth at the student and school levels. These growth measurements and benchmarks include student performance on the state-adopted assessments at a prescribed percentile or a pre-determined amount of student and school growth. These levels of
3
measures of growth are directly related to funding and to the continuation of programs and initiatives. These initiatives include student support programs such as after school tutoring, funding for additional teachers for interventions, and instructional resources and technology to support school and student improvement.
Considering the federal landscape in recent years, states are under rigorous public and governmental scrutiny regarding the performance of their P-12 students and the effectiveness of their teachers measured by how students score on standardized achievement tests. In West Virginia, the state accountability system includes rigorous measures in order to produce
performance data at both student and school levels. At the student level the measure is an annual standardized content test (math, science, English language arts, social studies) referred to as the West Virginia summative assessment. At the school level, the measure is the overall
performance of the students in that school on the West Virginia summative assessment and other academic benchmarks for non-tested subject areas and the growth of these students through the years. Not meeting these benchmarks may result in sanctions that range from additional
oversight by the state and the federal government to the loss of funding.
Schools in need of improvement (priority schools) must follow the US Department of Education Turnaround Principles. If these principles are not met, districts come under strict scrutiny and monitoring by the US Department of Education. With the new A-F grade
accountability system, schools that receive an F grade for two consecutive years can potentially be taken over by the state. Without compliance, the state would potentially lose millions of dollars in federal monies that provide essential services to its students. These services include Title I, II, and III services and many other programs and initiatives. More states have shifted to new educator evaluation systems and many are tying these systems to teacher tenure, hiring
4
practices, and salaries (Springer et al., 2010). Colorado, Florida, Idaho, and Indiana have systems where teacher compensation is tied to performance (Behrstock-Sherratt & Potemski, 2013).
Because funding is instrumental for providing and supplementing many educational programs, states have adopted more stringent requirements when licensing teachers for their public schools. Federal funding is now requiring states to have rigorous systems in place addressing teacher effectiveness. These systems must ensure that teacher preparation programs adhere to strict accountability measures. Both school districts and institutions of higher education are required to produce data connecting teacher effectiveness to students’ academic achievement. Many states are connecting new teachers and their performance to the institution from which they completed their preparation. For example, North Carolina, Louisiana, and Tennessee are among states that now have teacher preparation student performance data models. These models use student performance data to evaluate preparation programs. North Carolina matches student data to specific educator preparation programs and not just to the institution as a whole (NCTQ, April 2013)
In recent years, considerable research has been conducted in the area of teacher quality and student achievement. The majority of it has focused on specific programs or routes such as Teach for America and the Florida Alternative Program. Identifying high-quality and effective teachers continues to be a major goal for researchers as well as for policy makers throughout the country. When considering the same students, highly qualified and effective teachers have shown to increase student achievement from the 50th percentile to, in some cases, the 95th percentile. Highly qualified teachers are defined as those who demonstrate content mastery via the state’s allowable pathways. Effective teachers are defined as those whose students after a year of their instruction show growth. In addition, students who were taught for three years by high
5
performing teachers scored on average at the 96th percentile on summative assessments. Those who were taught by low-performing teachers for three years performed at the 44th percentile (Tucker & Stronge, 2005).
For the last 10 years, teacher accountability for student growth as required in the No Child Left Behind Act of 2001 has been a topic of great concern for states and the target of several initiatives such as Race to the Top designed to prompt states to implement education reforms to receive financial incentives. Some of the available funding for states and districts to provide student-related services and programs is now linked to teacher performance and student progress (No Child Left Behind Act and Teacher Accountability, FindLaw, 2009). Millions of dollars have been infused into national and local educational systems attempting to define, capture, and measure student growth. Student growth is commonly measured by how students score on summative standardized achievement tests implemented statewide from year to year. If a student achieves higher on the assessment on subsequent years it is an indication of growth. Often, how well students score on such standardized assessments is perceived to be a result of how effectively the teachers perform.
Based on the accountability measures West Virginia can receive funding for areas such as School Improvement Grants (SIG). To meet legislative mandates, it is imperative to examine the perceived impact on students’ standardized test scores related to teacher preparation, years of service, type of licensure held, and teacher quality. Depending on the effect these variables might have on student achievement, West Virginia’s ability to implement educational reform in these areas could significantly impact student achievement outcomes.
In order to enhance teacher preparation programs, shape policy regarding licensure, and determinethe needed changes in teacher induction models currently in place, states, including
6
West Virginia, should investigate the relationship between these variables. Access to some funding streams is linked to how students perform. Some areas of the country tie teacher
performance evaluations and merit pay to student performance and student growth. Therefore, it is critical to identify factors that will have a positive impact on these measures (Rosales, 2014; Springer et al., 2010). In order to inform the policy-making process and implement any needed changes and/or scale-up local initiatives, it is important to determine what will influence teacher performance and the quality of teaching as it relates to student outcomes.
There are a variety of methods and pathways available to certify public school educators. An understanding of preparation routes and methods and the impact teachers prepared under each have on the achievement of public school students in West Virginia can help identify best practices for student success.
Statement of the Problem
The purpose of the study is to determine the effect of teacher preparation, years of service, type of teacher licensure and teacher quality, on English language arts and mathematics West Virginia summative assessment scaled scores and performance levels (Levels l, 2, 3, and Level 4) in grades 5 and 11. Specifically, this research will analyze theexisting assessment data in West Virginia’s 55 counties, regarding teacher experience and the types of license held including initial Professional Licenses and Alternative licenses. What might be the effect, if any, on student academic achievement that may be moderated by these variables?
Research Questions
1. What are the differences between the West Virginia summative assessment scaled scores in English language arts and mathematics among West Virginia students in grades 5 and 11, taught by teachers trained in traditional and alternative teacher preparation programs?
7
2. What are the differences in categorical rankings (levels 1, 2, 3, and 4) on the West Virginia summative assessment in English language arts and mathematics among West Virginia students in grades 5 and 11 taught by teachers trained in traditional and alternative teacher preparation programs?
3. What is the effect of teacher experience on West Virginia summative scaled scores in English language arts and mathematics among West Virginia students in grades 5 and 11?
4. What is the effect of teacher experience on West Virginia summative assessment categorical rankings (levels 1, 2, 3, and 4) for mathematics and English language arts, among students in grades 5 and 11?
5. What is the effect of the type of teacher licensure (certified/noncertified) on West Virginia summative scaled scores in English and mathematics among West Virginia students in grades 5 And 11?
6. What is the effect of type of licensure (certified/noncertified) on categorical rankings in math and English, among students in grades 5 and 11?
7. What is the effect on math and English scaled scores by 5th grade math and English teachers with highly qualified status or non-highly qualified status?
8. What is the effect of highly and non-highly qualified teacher status on categorical rankings in English and mathematics among students in grades 5 and 11?
Null Hypotheses
1. There are no differences in West Virginia summative assessment scaled scores in English language arts and mathematics and related categorical rankings (levels 1, 2, 3 and 4) among West Virginia students in grades 5 and 11 taught by highly qualified teachers compared to their peers taught by non-highly qualified teachers.
8
2. There are no differences in West Virginia summative assessment scaled scores in English language arts and mathematics and related categorical rankings (levels 1, 2, 3 and 4) among West Virginia students in grades 5 and 11 taught by traditionally prepared teachers compared to their peers taught by alternatively prepared teachers.
3. There are no differences in West Virginia summative assessment scaled scores in English language arts and mathematics and related categorical rankings (levels 1, 2, 3 and 4) among West Virginia students in grades 5 and 11 taught by beginning teachers compared to their peers taught by experienced teachers.
4. There are no differences in West Virginia summative assessment scaled scores in English language arts and mathematics and related categorical rankings (levels 1, 2, 3 and 4) among West Virginia students in grades 5 and 11 taught by teachers holding a
Professional Teaching Certificate compared to their peers who are noncertified teachers. Operational Definitions
Highly Qualified Teacher.
a. A teacher who holds a bachelor’s degree or higher and meets state certification requirements, including those certified through a West Virginia Board of Education (WVBE) approved alternative certification program. The teacher has an endorsement(s) in the core academic subject(s) and has successfully passed the state competency test in the content area. b. A teacher is also Highly Qualified who has a minimum of a bachelor’s degree with an
academic major or advanced credential(s) in the core subject taught.
c. A teacher is also Highly Qualified who satisfied West Virginia’s Highly Objective Uniform State Standard of Evaluation (HOUSSE), an optional method of documenting subject matter competency in a core academic subject(s) via classroom observations by the school
9
administrator and provided the individual previously held the appropriate license to deliver instruction in the core academic subject.
Non-Highly Qualified Teacher.
a. A teacher who holds a bachelor’s degree or higher and who is notyet fully certified. A teacher is also non-highly qualified if he/she holds a Professional Teaching Certificate endorsed in the appropriate content area but who has not yet passed the state competency test –Praxis II in the content area.
b. A teacher who holds full certification endorsed in the appropriate content areas but does not have an academic major or advanced credential in the subject taught and who has not satisfied the West Virginia’s Highly Objective Uniform State Standard of Evaluation (HOUSSE) definition.
Traditionally Prepared Teacher – A teacher who has completed a traditional baccalaureate preparation program at a West Virginia institution of higher education, and who has completed a student teaching experience and who has passed all West Virginia required Praxis exams and holds full certification in the appropriate content area.
Alternatively Prepared Teacher – A teacher with a baccalaureate degree who has completed an alternative program, and who completes student teaching on the job and who is employed as a teacher while completing the program.
Beginning Teacher – A teacher who has between 0 and 3 years of full-time teaching experience in the core subject taught.
Experienced Teacher – A teacher who has a combined total of 5 or more years of full-time teaching experience in the core subject taught.
10
Teaching License – The license issued by the West Virginia Board of Education held by the teacher. These are:
Initial License – The first license valid for a period of three years issued to a teacher who meets all licensure requirements in West Virginia.
Five-Year license – A license issued to a teacher who has a minimum of two years of teaching experience and who has completed a beginning teacher internship.
Temporary Teaching License – A non-renewable, one-year license issued to a teacher who completed an out-of-state teacher preparation program but who has not yet
successfully completed the Praxis I series or Core Academic Skills for Educators basic skills test and the state’s Praxis II competency tests in the content area.
West Virginia summative Assessment Achievement Levels – Level 1, Level 2, Level 3, and Level 4.
For Grade 5
Level 1 – The student has not met the achievement standard and needs substantial improvement to demonstrate the knowledge and skills in mathematics needed for likely success in future coursework.
Level 2 – The student has nearly met the achievement standard and may require further development to demonstrate the knowledge and skills in mathematics needed for likely success in future coursework.
Level 3 – The student has met the achievement standard and demonstrates progress toward mastery of the knowledge and skills in [content area] needed for likely success in future coursework.
11
Level 4 – The student has exceeded the achievement standard and demonstrates advanced progress toward mastery of the knowledge and skills in [content area] needed for likely success in future coursework.
For Grade 11
Level 1 – The student has not met the achievement standard and needs substantial improvement to demonstrate the knowledge and skills in [content area] needed for likely success in entry-level credit-bearing college coursework after high school.
Level 2 – The student has nearly met the achievement standard and may require further development to demonstrate the knowledge and skills in [content area] needed for likely success in entry-level credit-bearing college coursework after high school.
Level 3 – The student has met the achievement standard and demonstrates progress toward mastery of the knowledge and skills in [content area] needed for likely success in entry-level credit-bearing college coursework after completing high school coursework. Level 4 – The student has exceeded the achievement standard and demonstrates the knowledge and skills in [content area] needed for likely success in entry-level credit-bearing college coursework after high school.
Limitations
A teacher’s Highly-Qualified designation may vary based on the regulations in place at the time the designation was received making it difficult to differentiate how different teachers with the same designation achieved such Highly Qualified designation.
Candidates may have additional out-of-state years of teaching experience not captured by the data management system utilized throughout West Virginia. This out of state experience may potentially place these individuals in an incorrect bracket regarding years of experience.
12
Results of the West Virginia standardized summative assessments in English and mathematics may be affected by certain social and economic circumstances of the students. There are teacher and student characteristics that could affect student achievement; however, this study’s scope was limited to only certification status, teacher experience, highly qualified status, and preparation pathway.
Delimitations
The study included a selection of a statistically significant sample of WV teachers prepared by traditional routes and alternative routes. In addition, it included West Virginia summative assessment performance levels from all 5th and 11th grade students taught by the
selected sample of teachers for the 2015-16 academic year.
Research was conducted within the context of a specific area, West Virginia, and a
specific set of teacher quality variables that included teacher preparation, licensure, Highly
Qualified status, years of experience, and grade levels. Within this study, learning and growth are
referenced as the results of standardized test scores in mathematics and English language arts.
Rationale
Depending on the results, the outcome of this research may address specific teacher certification needs in West Virginia and help inform local policy as well as explore potential funding implications. As West Virginia currently has over 700 teacher vacancies, the findings would assist state and local education agencies as well as teacher preparation programs to tailor traditional and alternative preparation programs to address best practices identified that may have a significant impact on student achievement. In order for legislators and local and state education agencies to implement effective strategies and to scrutinizethe characteristics that may produce
13
the necessary growth in student learning, it is vital to identify the factors which influence teacher effectiveness and which have the most potential positive impact on such learning.
The information obtained from the results may help determine if the teacher quality variables in question do directly influence student learning and growth as evidenced by the related standardized test results in mathematics and English language arts. These results may show if the standardized achievement results for students in West Virginia are significantly impacted by how their teachers are prepared, by what type of licensure their teachers hold, and by their Highly Qualified designation and how the teachers achieved such designation. No matter the results, all involved at the state or local level would be better able to revise their hiring
policies, teacher assignments to specific vacancies, and tailor further professional development for their teachers. Additionally, the findings may help legislators guide state statutes regarding educator preparation and teacher evaluation and compensation.
If the results for the effect of teacher quality are significant, then the state could implement those qualities as requirements for all new teachers and teacher education programs would need to make revisions accordingly. Preparation programs could also provide related professional development for in-service teachers not meeting the designation. If such results are not significant or inconclusive, then the state could reconsider these designations and potentially develop a new set of characteristics.
If the results show significance for either type of teacher preparation program—alternative or traditional—then that pathway can continue to be developed and refined, particularly for addressing critical shortage areas. If these pathways are inconclusive, then the state could
deemphasize alternative preparation or design newer approaches and may assist financially given the existing structures of traditional programs.
14
If teacher experience is a significant effect, favoring the experienced teacher, then the state could consider enhancing teaching or mentoring models where experienced teachers are paired with new teachers in either a professional development model or a tiered compensatory teaching model. If not significant, then the current model can be continued with the beginning teacher induction program. Additionally, if there is no significance on student test scores, then the state might consider alternative assessments that are performance based, with repeated measures, rather than a one-time measure that significantly affects policy.
If significance is found for one content test area rather than the other, and for one grade level than the other, then administrators and curriculum developers could study such results in depth and make relevant revisions to either the standards and/or design school-based curriculum strategies for enhancing the relevant content. Also, the state could begin to examine the
seriousness with which, for example, high school and middle school students approach test taking to determine if optimal scores are being obtained. Often these scores are related to school compliance measures and the state and the public should be assured that these kinds of decisions are being made with reliable and valid data.
If type of licensure is significant and favors, e.g., the professionally certified teacher, then the state can be confident about the requirements of this model for certifying teachers and about structuring the existing requirements for temporarily certifying teachers, but perhaps
strengthening these and/or creating a more closely supervised context for these teachers. Finally, the results of this study might help contextualize the ranking West Virginia receives in national publications such as the National Council on Teacher Quality (NCTQ) and the National Assessment of Educational Progress (NAEP) in order to better position policy
15
makers and state education agencies to seek both private and public competitive funding opportunities.
Summary
In closing, current research shows that issues of teacher quality and its effects on student
achievement are in flux nationally and being promulgated heavily by enactments of the federal government and its various policies as well as by private entities who provide public rankings of states and teacher preparation programs. Literature supports the need for further research
regarding student academic achievement and teacher qualities. These qualities need to be very
specifically defined and filtered to account for variables that may interfere with usable findings.
Finally, such information and data, no matter the results, are important contributions to a
state and a national database on the relationship between teacher qualities and student
16 CHAPTER 2
REVIEW OF LITERATURE
This study will expand upon existing research as it relates to academic achievement and its relationship to teacher licensure, preparation pathway, years of experience, and highly qualified designation. It will examine the variables separately and then how these connect or overlap. Furthermore, it will identify the factors that have shown to have an impact on academic achievement as well as those that did not significantly impact it. Overall, this review is organized by four areas: student academic performance and teacher preparation route, student academic performance and teacher years of experience, student academic performance and state teacher licensure, and student academic performance and highly qualified designation of teacher.
The studies selected focused on a number of variables related to student learning and the characteristics of their teachers. These studies included the quality of the teacher, the type of teacher preparation program and its resulting type of licensure. Additionally the effect of teacher experience on student achievement was reviewed, including the effects on students at the middle and high school levels.
Much of the existing research on teacher quality and preparation pathways has been aimed at particular school districts or contexts in rural and urban areas, rather than being
statewide or national investigations. The majority of the studies were quantitative investigations although several had qualitative components as well. The studies selected were conducted between 1999-2015, with the majority completed between 2000-2009.
Student Academic Performance and Teacher Preparation Route
When researching what makes an effective teacher, many point to the initial preparation of the teacher as having the most impact on their effectiveness (Darling-Hammond, 2000;
17
Peterson and Nadler, 2009). Teachers are often said to be the most critical factor when it comes to student learning. In addition, there are other background characteristics such as ethnicity, socio-economic status, and parental influence and background that have a large impact on learning. However, available research has not yet provided a direct link between variance in student achievement and any particular background characteristic. The major portion of variance in achievement has been directly linked to the impact of the teacher (Sawchuk, 2011).
Goldhaber and Brewer (1999) discuss the fact that not all subject areas are equal when it comes to the degree of influence the teacher has when it comes to how students score on
achievement assessments. The authors further found that all the combined variables affecting achievement resulted in 21% of the variation in mathematics achievement. Additionally he noted that about 8.5% of such variance was directly attributed to the teacher’s influence. It is important to note that there are other areas which have not been studied as much that also would have an impact on students such as administrative involvement and influence of the principal and other administrators. Also, how district initiatives are interpreted and implemented by the teachers can have a significant impact on achievement (Rothstein, 2010).
Teacher preparation and accomplishments are also viewed asvery influential variables regarding student academic performance. The National Commission on Teaching & America’s Future (2016) reports that teachers who complete rigorous programs including performance-based processes such as the National Board Certification help students make gains comparable to as much as 2 months of learning. Academic achievement may also be impacted by current
teacher shortages and teacher preparation enrollment decline across the country. As indicated in the Title II reports by the U.S. Department of Education (2015a), during 2013-14 teacher preparation completion ratesdropped by over 123,000 across the United States. Such shortages
18
create situations where students are potentially taught by a variety of teachers within the same year. These teaching scenarios could range from having a short-term or long-term substitute or someone pursuing alternative certification being the teacher of record. When a more permanent teacher is hired into one of those classrooms, it would be difficult to determine the level of success of any of the individual teachers who taught in that classroom.
Mentorship during the pre-service and in-service period needs to be considered. Some of the differences between preparation routes are the type and amount of mentorship teacher candidates receive. Teachers who have more mentorship and/or induction perform more
effectively (Ingersoll & Strong 2015; Snyder & Bristol, 2015). Some alternative pathways have required mentorship embedded throughout the program as candidates complete their programs while on the job. Hence there isthe need to separate the different pathways of teacher
preparation when looking at impact on student achievement.
When considering programmatic levels, Clofelter, Ladd, and Vigdor (2010), studied the impact teacher credentials had on student achievement at the high school level. One of the most significant findings showed that the type of credential held by the teacher affected how students achieved. The impact was significant enough to result in state policy changes. At the elementary level across the country, in the areas of mathematics and reading, students who were taught by certified teachers outperformed their peers who were taught by teachers who were not certified (Riordan, 2009).
It is evident that much of this effort to understand and identify what best promotes academic achievement reaches beyond the United States. Many studies have been conducted across the world trying to address these same questions. Recently, as indicated by the Program for International Student Assessment (PISA, 2015), well-prepared teachers and how they are
19
prepared have a significant impact on achievement. Countries with high performing schools and students have well-prepared and highly-skilled teachers (Schleicher, 2013). When reviewing the literature nationally and internationally, it is evident that additional research is needed that tie together many of these variables that impact student achievement. As Ingersoll, Merrill, & May (2014) concluded, teacher education preparation is directly and significantly related to how well students achieve.
Student Academic Performance and Teacher’s Years of Experience
Experience is often viewed as desirable and at timesarequired element under most circumstances. Experience is required for most jobs, trades, and even volunteering opportunities. Education and teaching are also held to such beliefs.Experience factors into such aspects of the workforce including salary, tenure, and benefits. The belief is that experience improves
effectiveness, which delivers better results (Rice, 2010). Existing research indicates that experience alone and amount of experience are not the only or greatest determining factors of effectiveness and quality. To determine impact significance one must look in greater detail and at additional factors that influence the outcome as well (Clotfelter, Ladd, & Vigdor 2007). This study will look in greater detail how and if such compounding factors have an impact on the academic performance of students.
Many have examined additional factors that potentially influence student achievement. Budding & Zamarro (2009) reported that how teachers score on licensure tests and advanced degrees has noimpact on achievement; however, teacher experience does. Often those with greater experience also hold advanced degrees but the researchers report that degrees alone have no statistical significance. When looking at some of these variables differently, Clotfelter, Ladd,
20
& Vigdor(2007a) concluded that teacher licensure scores have a significant impact on
mathematics achievement but teacher experience is a constant by having impact across all areas. Rice (2003) describes experience being a key element but further indicates that greater significance occurs at the secondary level rather than at theelementary level. Across the country these results differ. In Ohio for example, according to Carr (2006), teacher experience was not statistically significant for impacting student achievement. Huang & Moon (2009) and Harris & Sass (2007, 2013) on the other hand, found that teacher experience only had a significant impact on particular grade levels but not across different grade levels. Ladd & Sorensen (2014)
reviewed teachers’ years of experience across a longitudinal study in North Carolina and concluded that teacher experience had a clear impact on how students scored on tests but also looked and identified other positive effects such as improvement in student behavior and a significant reduction in absenteeism.
One other factor often cited and described in the available literature is the relationship between instructional approaches and the teacher’s years of experience and the impact on teacher effectiveness (Smith, Lee, & Newmann, 2001). Many of the conclusions provided in the
literature, including longitudinal studies, have focused on a particular grade level or content area. Wiswall (2013) found that 5th grade classroom teachers do not produce better results in student achievement after the initial first few years of teaching regardless of their years of experience. Such findings demonstrate how narrow the focus traditionally is when looking at justindividual or few variables. It is imperative to consider the cumulative effects the aforementioned variables have on student achievement in their different permutations.
21
Student Academic Performance and Type of State Teaching Licensure
Darling-Hammond (2000), reports that teacher certification and licensure have a direct impact on increased student achievement. She also found that the NAEP scores in some areas such as mathematics are lower for students taught by non- fully certified teachers. Several studies also point to the importance of the type of teacher credentialing and how those impact achievement. Darling-Hammond (2007) found that not all teacher credentials have equal impact on achievement. She describes certain credentials such as alternative certification as having a negative impact on student achievement. This negative impact may be partially attributed to the turnover of some of the alternatively certified teachers. Perhaps if the alternatively certified teacher stayed longer, over time, they would have greater impact on the academic achievement of students. Others (Kane, Rockoff, & Staiger, 2008, Goldhaber & Brewer, 2000) argue that there is no significant difference on achievement levels when linked to teacher certification type.
Licensure is one of the key factors and primary requirementstates use throughout the country to uphold and justify the quality of their teachers. States differ when it comes to
licensure requirements, programs leading to licensure, number of hours required and the types of licensure issued (Goldhaber & Brewer, 2000). Wenglinsky (2000) analyzed data from NAEP and reported that teachers who had a major or minor in the content area they taught had a greater impact on achievement rather than licensure. Some argue that teacher quality is a significant factor but it is not related to the type of licensure teachers hold (Koedel & Betts, 2007). In a study by Aaronson, Barrow, & Sander (2007) the authors found that the teacher has a significant impact on student achievement but individual characteristics including certificate type do not.
Many studies do not separate all types of credentials and advanced credentials equally. Cowan and Goldhaber (2015) indicate that when looking at individual characteristics, National
22
Board Certification has a greater impact on student achievement when compared to any other characteristic. The authors also found that teachers who perform better on the National Board Certification assessments have greater effectiveness ratings. Based on these collective findings, it appears that further clarification when studying certification type needs to be provided. Such clarification should include more details on the actual certification type either initial, advanced, or nationally such as the National Board for Professional Teaching Standards certification. As stated in the purpose of this study, including specific state teacher certification in combination with other teacher characteristics may provide greater data on its impact on student achievement. Student Academic Performance and Highly Qualified Designation of Teachers
Since its inception with the No Child Left Behind Act in 2001, the debate over what is a highly qualified teacher continues. This piece of legislation set out to staff a highly qualified teacher in every classroom by 2006. Inclusion of such a requirement in the legislation implies the federal government is confident that there is a strong correlation between highly qualified and teacher quality (Holloway, 2007). According to Rothman (2009), even eight years after its inception, even though most teachers across the country have met the HQ definition, there is no significant evidence that the quality of teachers changed. The discrepancies over such goals and claims are many. HQ status may vary from state to state. The legislation provided a large range of flexibility in how states defined the Highly Qualified (HQ) status of a teacher. The provided flexibility may vary from a prescribed number of academic hours in a particular content area to designations given by the school principal based on classroom observations (U.S. Department of Education, 2004; Holloway, 2007).
A primary criterion of the Highly Qualified designation is proper certification in the content area taught. Goe (2007) and Betts and Frost (2000) indicate that teachers licensed in the
23
content area they teach show greater impact on how students achieve. Furthermore, Nyankori (2005) and Cronigner, Rice, Rathun, & Nishio (2003) argue that teacher certification has an indirect impact on achievement;however, the authors focused more on the impact of the
combined characteristics of teachers for the entire school and the related impact on achievement. It is evident that many of the studies have focused on how the combination of several of these variables impact achievement. When it comes to the HQ status of teachers, most available research analyzes separate variables that collectively result in an HQ designation but not at the designation asawhole.
As indicated in this review, there is a need for further research in this specific area as it connects to HQ status. Specifically, the area of focus should be on the impact that designation of HQ as a whole has on achievement. Several contradicting bodies of research including Darling-Hammond (2000a), Darling-Darling-Hammond and Sykes (2003) and Ryan (2004), indicate that the Highly Qualified designation as a whole may not be an accurate measure of effectiveness and quality. These authors concluded that more careful attention to individual teacher characteristics would be more beneficial to policymakers and school systems when determining teacher
effectiveness and any potential impact it may have on student achievement. It is the purpose of this study to analyze in greater detail how these unique variables impact student achievement. Summary
Academic achievement is one of the most difficult outcomes to measure because it has a very large number of variables affecting it. Several of the education constituencies including federal and state government, and local school districts believe that measuring academic achievement via standardized testing is the most reliable way to provide data regarding the efficacy of education (Gawthrop, 2014). Sanders (1998) stated that the most important factor
24
impacting academic achievement and growth is teacher effectiveness. Such findings are found throughout the now reauthorized Every Student Succeeds Act (U.S. Department of Education, 2015) and its previous version the NCLB Act (U.S. Department of Education, 2014).
Considerable emphasis has been placed on these variables trying to find the right combination in order to impact student achievement as well as to better prepare teachers. Academic achievement is also used as a measure of school district success. Consequently, the variables related to such achievement are under continuous scrutiny (Brinkman, 2014). The characteristics of educators are the focus of a large body of research to determine the impact on student achievement (Sanders & Rivers, 1996). Therefore, there is great need to further explore the literature relevant to how these variables impact student achievement.
A consistent and clear message across all research is that a common meaning of teacher quality has not been reached but teacher quality is without a doubt the most cited factor
impacting student achievement (Goe, 2007). The preponderance of the available research in this area often only addresses individual variables primarily across one of the programmatic levels: elementary, middle, or secondary. Much of the research focuses on particular school districts or particular characteristics of an area such as urban or rural. There is a gap in how the same
variables and factors impact achievement across these programmatic levels considering variables such as teacher licensure, preparation pathway, years of experience, and highly qualified
25 CHAPTER 3
METHODS
This chapter will initially describe the purpose of the study and its major treatment and outcome variables. Additionally, it outlines its major components including design, population and subject selection, research questions, major procedures, and data analysis.
Purpose
The purpose of the study is to determine the effect of traditional and alternative teacher preparation, years of service, type of licensure held and Teacher quality on West Virginia English language arts and mathematics summative assessment scaled scores and performance levels among students in grades 5 and 11. Specifically, this research will analyze theexisting assessment data in West Virginia’s 55 counties, regarding teacher experience, the types of license held including professional licenses and alternative licenses, and the teacher’s Highly Qualified (HQ) designation. What might be the effect, if any, on student achievement that can be attributed to the teacher quality variables noted previously?
Design
This study collected licensure, employment, and assessment data to examine the level of impact on grade level standardized tests in mathematics and English language arts moderated by the kind of teacher preparation, years of teacher service, type of licensure held and highly qualified status. The major outcome variables are English language arts and mathematics scaled scores and related categorical rankings on the summative, year-end assessment in West Virginia.
26 Population
The study includes all mathematics and English teachers who werecurrently employed in a WV public school in all 55 counties during academic year 2015-2016 in grades 5 and 11. These subjects were obtained from an encrypted statewide database at the West Virginia Department of Education (WVDE). The data were received and approved through a formal data request
submitted to the WVDE.
There are two sub-populations in the design: all 3,589 mathematics and English
classroom teachers in grade levels 5 and 11, in West Virginia’s 55 counties during the 2015-16 school year, and their respective numbers of English/language arts and mathematics students in grades 5 and 11 for a total of 34,528. However, 155 teachers were omitted because their
preparation pathway could not be clearly identified as traditional or alternative. In all, there were 3,434 included in the population.
It is recognized that within the sample there is an overlap in the variables and factors of the study. For example, teacher experience encompasses all participants in the study no matter the variable (certified, noncertified, highly qualified, non-highly qualified, alternatively prepared and traditionally prepared).
Research Questions and Data Analysis
The following research questions overarch and guide this study. Data analysis will include a combination of descriptive and inferential statistical techniques. Each of these are noted below and aligned with the study’s respective research questions.
1. What are the differences between the West Virginia summative assessment scaled scores in English language arts and mathematics among West Virginia students in grades 5 and 11, taught by teachers trained in traditional and alternative teacher preparation programs?
27
2. What are the differences in categorical rankings (levels 1, 2, 3, and 4) on the West Virginia summative assessment in English language arts and mathematics among West Virginia students in grades 5 and 11 taught by teachers trained in traditional and alternative teacher preparation programs?
3. What is the effect of teacher experience on West Virginia assessment summative scaled scores in English language arts and mathematics among West Virginia students in grades 5 and 11?
4. What is the effect of teacher experience on West Virginia summative assessment categorical rankings (levels 1, 2, 3, and 4) for mathematics and English language arts, grades 5 and 11? 5. What is the effect of the type of teacher licensure (certified/noncertified) on West Virginia summative assessment scaled scores in English and mathematics among West Virginia students in grade 5 And 11?
6. What is the effect of type of licensure (certified/noncertified) on categorical rankings in math and English, grades 5 and 11?
7. What is the effect on math and English scaled scores for 5th grade math and English teachers with highly qualified status or non-highly qualified status?
8. What is the effect of highly and non-highly qualified teacher status on categorical rankings in English and mathematics for grades 5 and 11?
Procedures
Data Request
The data was requested from the West Virginia Department of Education by following a data request protocol established by the agency. A written request was submitted to the Office of Data Governance through the Zoom WV portal. The request included the description of the data
28
including year, grades, type of licensure held, years of experience, and highly qualified status. The data was provided at the aggregate level for each grade band requested as an Excel spreadsheet (assessment_data_suppressed_Hagerman.xls) suppressed and de-identified to remove all identifiable information. The approval copy is available in Appendix A.
Data Collection and Match
WVDE staff matched the category of teachers requested to the students they taught. After the match was completed, all identifiable information was removed and data was grouped by categories and variables. All data including teacher licensure, years of experience, and Highly Qualified designation were provided at the aggregate level so no identifiable information for both teachers and students was provided. As a result, the database did not require any secured features or permissions to be accessed. However, the data was kept in a password protected external drive known only to the researcher.
Data Import
The data was imported to SPSS, Version 24 from the Excel spreadsheet for analysis. Other than having to name the variables at the Data Screen, the input into SPSS is ready to perform the various kinds of analyses needed. Before and after the analysis process the data were stored in a password protected external drive as well as at the Output database on SPSS. All data were analyzed in the aggregate form and no names or identifiable information will be available.
IRB Protocol
The research prospectus was submitted to the candidate’s doctoral committee and approved by the committee. Subsequently, it was submitted to the Marshall University
Institutional Review Board (IRB) for approval. The IRB Research (Protocol) Application, Form #2 (Social/Behavioral) was submitted to the Marshall University Institutional Review Board for
29
review and approval. Following these reviews, the data was analyzed in SPSS, Version 24, for the appropriate statistical models.
Data Analysis
Based on the existing research questions for the investigation, analysis will be obtained by a combination of descriptive and inferential statistical methods. Descriptively, data included aggregate mean score data for the various variables and groupings, with related standard
deviations and standard error scores. Inferential analysis included one-way analysis of variance, t-tests for independent samples and nonparametric models including Kruskal-Wallis and Chi-Square tests of independence. These data will also be supported with various graphic details and representations.
In each case, the test of significance will be set apriori at a p-level < or equal to .05 and related effect size measures will be obtained for results that are statistically significant.
English language arts and mathematics scaled scores will initially be analyzed descriptively by obtaining means of the scaled scores, standard deviations, and measures for skewness and normality. Data will be inferentially analyzed using a combination of t-tests for independent samples and analysis of variance. Related categorical rankings will be analyzed using a combination of nonparametric tests: Chi-Square Goodness of Fit and Kruskal-Wallis. Summary
The central purpose of the investigation is to determine how student achievement in mathematics and English/Language Arts might be distinguished by a set of teacher
characteristics. These include how the teachers were academically trained, vis a`vis traditional teacher preparation programs or alternative pathways to certification. Additionally, does the experience of the teacher interplay with one’s type of academic preparation and level of formal
30
teacher certification? Notwithstanding these purposes, it was of prime importance to know something about the quality of the teacher, with the belief by many that this variable is strongly correlated to student achievement. While the several research questions posed will be examined as separate effects, the combined effects of the variables as a whole may be more revealing. The significance of the results, once known, may potentially shed some light on the connection of WV teachers and their professional profiles to their students and their achievement status.
The entire data set associated with the respective variables will be obtained from a large, fully protected, encrypted database from a state agency. Consequently, the investigation will avoid some of the pitfalls of real time sampling: bias selection, mortality, and inadequate sample sizes, and lacking compliance for security and confidentiality.
31 CHAPTER 4
DATA ANALYSIS AND RESULTS Purpose
The purpose of the study is to determine the effect on English language arts and mathematics scaled scores and related categorical performance levels on the West Virginia summative assessment among students in grades 5 and 11, moderated by traditional and
alternative teacher preparation, years of experience, type of licensure held, and Highly Qualified designations. Specifically, this research will analyze the existing assessment data in West Virginia’s 55 counties to determine what might be the effect, if any, on academic achievement that can be attributed to these teacher variables.
Data
The data for the study included scaled test scores and categorical ranked median scores for mathematics and English language arts among a statewide sample of students in grades 5 and 11. Test score data were obtained from the WVDE, housed at the state level in the West Virginia Zoom Data Warehouse. The data for the warehouse were collected through the WV Education Information System (WVEIS), a secure database and system within the WVDE servers. Population/Sample
The population for this study included 3,589 5th and 11th grade English/language arts and mathematics teachers in the state of WV. These are WV teachers assigned as a teacher of record in the master schedule for all schools in WV that contain a 5th grade and an 11th grade classroom. The population was comprised of 1,777 5th grade teachers that included 868 math teachers and 909 English/language arts teachers and 1,657 11th grade teachers that included 789 math teachers and 868 English/language arts teachers. These were pulled from the master schedules for every
32
school meeting the criteria (5th and 11th grades with math and English/language arts teachers). Because their preparation route was unable to be determined, 155 teachers were omitted from the sample.
The student population for this study included every student assigned to every 5th and 11th
grade teacher in the above sample, who took the assessment in the 2015-2016 academic year. The student sample included 17,546 students in mathematics for grade 5, and 17,495 students in English/language arts 5th grade, 15,502 mathematics 11th grade students, and 16,116
English/Language arts students for grade 11. Of note, students within the same grade band (5 or 11) may appear in both the math and English language arts groupings.
Because several of the groupings for each variable of the study varied in size and were disproportional, random sampling was obtained for each of the variables shown in Table 1. Table 1
Sample Sizes for Variable Factors Across Grade Levels and Content Areas
ELA 5th ELA 11th Mathematics 5th Mathematics 11th Alternatively
Certified 416 1,355 263 1,378
Traditionally
Certified 364 1,446 348 1,418
ELA 5th ELA 11th Mathematics 5th Mathematics 11th
Certified 364 3,218 348 642 Non-Certified 287 3,005 242 797 ELA 5th Grade ELA 11th Grade Mathematics 5th Grade Mathematics 11th Grade Highly Qualified 120 814 115 487 Non-Highly Qualified 108 737 95 460
33 Research Questions and Data Analysis
Research Question #1:
“What are the differences between the West Virginia summative assessment scaled scores in English language arts and mathematics among West Virginia students in grades 5 and 11, taught by teachers trained in traditional and alternative teacher preparation programs?”
This question addressed differences in scaled scores on the West Virginia summative assessment in mathematics and English among 5th and 11th graders taught by teachers trained in traditional compared to alternative teacher preparation programs. In each case an independent samples t-test was obtained to statistically test the significance of these variables. Table 2 shows the group statistics test data for math scaled scores among 5th graders moderated by the teacher preparation variable.
Table 2
Group Statistics Data for Alternatively or Traditionally Certified 5th Grade Math Teachers
Alt/Trad N Mean Std. Deviation Std. Error Mean
STUASMSCO 0 = Trad 348 2489.71 80.446 4.312
1 = Alt 263 2447.42 99.820 6.155
Numerical data in the group statistics table 2 shows a difference of approximately 42 scaled score points favoring traditionally prepared, 5th grade Math teachers. Additionally, an effective difference in the variability of the standard deviation scores occurred for alternatively prepared teachers sample sizes were effectively equitable.