Advances in Environmental Biology
ISSN:1995-0756 EISSN: 1998-1066Journal home page: http://www.aensiweb.com/aeb.html
Corresponding Author: Murat Korkmaz, Fırat University, School of Physical Education and Sports Box.23119.Elazığ. Turkey.+904242370000-5730. E-mail: alsetu_23@hotmail.com. asyucel@firat.edu.tr.
Negative Effects of Mobbing on Work Performance and Efficiency of Personnel
Working in Public and Private Medical Institutions, An Applied Turkey Example
1Murat Korkmaz, 2Bülent KILIÇ, 3Ali Serdar Yücel, 4Hayrettin Gümüşdağ, 5Muzaffer AKSOY
1Güven Group Inc. Finance Manager, İstanbul, Turkey. 2Orthopedist, Tekirdağ, Turkey.
3Fırat University School of Physical Education and Sports (BESYO), Elazığ, Turkey. 4
Hitit University School of Physical Education and Sports (BESYO), Çorum, Turkey. 5ABC International Bank Plc Chief Representative, İstanbul, Turkey.
A R T I C L E I N F O A B S T R A C T
Article history:
Received 23 January 2014 Received in revised form 19 April 2014
Accepted 26 April 2014 Available online15 May 2014
Key words:
Mobbing, Work Performance, Efficiency, Medical Institution
The purpose of this study is to examine the negative effects of mobbing on work performance and efficiency, which is implemented on the personnel working in public and private medical institutions. A total of 2500 employees working in different branches of public and private medical institutions in Istanbul participated in the research. A two-part questionnaire was prepared for the participants. Data obtained from the research were put through reliability test and Cronbach Alpha coefficient was found 0.99. Data obtained were evaluated with t-test and one-way variance analysis, and significant differences were found with tukey test. Following the research, it has been concluded that mobbing affects the participants’ health negatively and this effect differentiates according to the demographic characteristics. Moreover, it has been found that mobbing has a negative effect on work performance and efficiency of the participants and this effect differs again according to the demographic characteristics.
© 2014 AENSI Publisher All rights reserved. To Cite This Article: Murat Korkmaz, Bülent KILIÇ, Ali Serdar Yücel, Hayrettin Gümüşdağ, Muzaffer AKSOY., Negative Effects of Mobbing on Work Performance and Efficiency of Personnel Working in Public and Private Medical Institutions, An Applied Turkey Example. Adv. Environ. Biol., 8(5), 1183-1195, 2014
INTRODUCTION
The mobbing is a serious occupational health and safety risk which is commonly seen in hospitals and at a level that requiremeasures to be taken for the health care workers. It is quite important to ensure the awareness of the problem for the measures to be takenand the arrangements to be made with respect to both the management and the employees in the workplaces [15, 5].
In this study, the negative effects of mobbing on work performance and efficiency of the personnel working in public and private medical institutions is analyzed. The theoretical framework has been created by carrying out the literature review about the subject.
Status of problem:
The intimidation behaviors that are called mobbing in today’s world cause negative results both for the individual and the organization. This situation is specifically observed in health sector. The individuals exposed to intimidation behaviors get stressed and they may have crucial health problems. Mobbing can cause many health problems and also may lead to a decrease in individual’s work performance and efficiency. Job satisfaction of the individual decreases, s/he doesn’t enjoy her/his job and organizational loyalty reduces. By taking into account that mobbing is an important problem today both for the individual and the organization and this problem will reach to a serious condition in the future, the study was carried out regarding the negative effects of mobbing on work performance and efficiency of the individuals working in health sector.
Literature Review and Theoretical Framework:
Today, employees in many countries and various sectors experience some undesired behaviors. Finding the behaviors highly affecting the work performance and efficiency of employees and solving them or taking the required measures has significant importance. Another matter among the ones having a negative effect on working life is psychological intimidation (mobbing) [17].
As a psychological intimidation of employees of different organizations, such behaviors as psychological or emotional harassment, verbal assault, threat, and direct physical attack are observed to be frequently experienced [16]. Psychological intimidation can be discussed as the abstract form of violence and it is more dangerous than physical violence [43]. Psychological intimidation is a psychological concept which emerges as a result of negative behaviors, sneakily intimidates and isolates people by taking them under the direct psychological influence [27].
“Mob” literally means disorganized crowd committing illegal violence. “Mobbing” concept deriving from the word “Mob” means gang, punk group, and crowd resorting to extreme violence in English [23].
Various definitions were made about the mobbing concept in the literature. Mobbing means all kinds of maltreatment, threat, violence, humiliation applied to employees by their seniors, juniors or other equal employees in a systematic way [15,21]. According to another definition, mobbing is stated as deterrence, intimidation, killing the victim’s ego, isolation from social periods [34]. World Health Organization defines mobbing as attitudes and behaviors which harm the physical, mental, ethical and social developments of individuals or groups by means of using force [2].
Although mobbing-related health problems are faced in many work places, they are not taken into consideration, measures are not taken, and studies for improvement are not carried out. However, many studies proved that some physical and mental illnesses are seen in intimidated people [9, 30, 33, 36, 40, 41, 45].
The mobbing problem (psychological violence) which emerges with disturbing behaviors for employees causes many negative results if not solved and they are frequently faced recently. Therefore, researches regarding mobbing are gradually increasing and become the subject of many studies [7]. As a result of the studies conducted in this subject, it is highly important that the necessary information should be provided to managers and employees of the organization concerning the negative effects of mobbing on the organization and employees, legal regulations about the subject should be revised and the required measures should be taken.
Both the rapid changes in health care and the deficiencies in the legal practiceleave gaps in prevention of the violence and in securing the safety of the medical human resources [4]. The mobbing, which takes precedence even over the sexual harassment in the developed countries is being mostly applied by the employees working at the upper levels of management and is seen as occupational disease of the senior managers [44].
Various studies indicate that the risk of being exposed to mobbing is higher for health care personnel than in other sectors. Due to the peculiar psychological conditions of hospitals, it is suggested that the risk of being exposed to violence for medical personnel is 16 times more than other service sectors [32].
Intense workload, irregular and unclear working conditions in medical workplaces where public services are commonly offered are the leading reasons which increase the risk of medical personnel’s being subjected to psychological violence [24].
Intimidation behaviors bring out negative results in terms of both sufferer and the organization of which the sufferer is a member. Employees subjected to intimidation behavior may come across stress, be worn out mentally and they may even have critical health problems [31].
Moreover, psychological harassment applied with such tactics as repression, suppression, ply, intimidation, siding against someone and threatening affects the communication, social relations, prestige, life quality, professional position and most importantly health of the individual subjected to it and it also leads to job dissatisfaction, organizational conflict and inefficiency [8, 11, 35, 39, 42, 47].
Furthermore, such results as loss of self-confidence, decrease in performance caused by the feeling of being left out, even being unable to work, being obliged to leave the job and having suicidal ideation-despite being rare-are observed [38]. Mobbing in workplace may cause ignoring the job, decrease in performance [10, 13], increase in job dissatisfaction, negative attitudes and behaviors towards the workplace [13]. Aksoy (2008) states that psychological violence may cause inefficiency by negatively affecting the individual’s morale and motivation as one of the stress factors in workplace [3].
In recent years, mobbing caught attention outside Europe and it was attempted to be discussed. Until today, researches conducted in some countries from Northern Europe such as Sweden, Norway and Germany (Leymann, [37]; Einarsen and Skogstad, [22]; Zapf, [48]; Hubert and Veldhoven, [29]; Dick and Wagner, [19]; Hoel et al., [28] examined the mobbing as a case with different aspects and tried to manifest the negative effects of mobbing on employee and business life. In this study, the purpose is to determine the negative effects of mobbing on performance and efficiency level of people working in health sector regarding their business life.
Problem Sentence ad Hypotheses of the Research:
Problem Sentence of the Research:
Does mobbing applied to the personnel working in public and private medical institutions have negative effect on work performance and efficiency?
Does the exposed mobbing cause health problems?
By whom is the personnel working in public and private medical institutions exposed to mobbing?
Limitations of the Research:
In this study, the negative effect of mobbing, which is applied on the personnel working in public and private medical institutions, on work performance and efficiency was analyzed, so analyses and evaluations were carried out regarding the 3 sub-dimensions in the scale (overcapacity work, not enjoying the job, decrease in work efficiency /performance).
Hypotheses:
Alternative hypotheses of quantitative research chapter in accordance with the research problem are as below.
H1: Sex variable does not make difference on “overcapacity work” factor H2: Sex variable does not make difference on “not enjoying the job” factor H3: Sex variable does not make difference on “decrease in work efficiency” factor H4: Age variable does not make difference on “overcapacity work” factor
H5: Age variable does not make difference on “not enjoying the job” factor H6: Age variable does not make difference on “decrease in work efficiency” factor H7: Marital status variable does not make difference on “overcapacity work” factor H8: Marital status variable does not make difference on “not enjoying the job” factor H9: Marital status variable does not make difference on “decrease in work efficiency” factor H10: Educational background variable does not make difference on “overcapacity work” factor H11: Educational background variable does not make difference on “not enjoying the job” factor H12: Educational background variable does not make difference on “decrease in work efficiency” factor H13: Branch variable does not make difference on “overcapacity work” factor
H14: Branch variable does not make difference on “not enjoying the job” factor H15: Branch variable does not make difference on “decrease in work efficiency” factor H16: Duration of work variable does not make difference on “overcapacity work” factor H17: Duration of work variable does not make difference on “not enjoying the job” factor H18: Duration of work variable does not make difference on “decrease in work efficiency” factor H19: Type of institution variable does not make difference on “overcapacity work” factor H20: Type of institution variable does not make difference on “not enjoying the job” factor H21: Type of institution variable does not make difference on “decrease in work efficiency” factor H22: Working in the same institution variable does not make difference on “overcapacity work” factor H23: Working in the same institution variable does not make difference on “not enjoying the job” factor H24: Working in the same institution variable does not make difference on “decrease in work efficiency” factor
H25: The position in the institution variable does not make difference on “overcapacity work” factor H26: The position in the institution variable does not make difference on “not enjoying the job” factor H27: The position in the institution variable does not make difference on “decrease in work efficiency” factor
Research Methodology:
Method and Scope of the Research:
In this research, whether the employees working in hospitals experience mobbing was questioned, and the effects of exposed mobbing on work performance and efficiency were analyzed. In this context, a two-part questionnaire form was implemented on a total of 2500 participants. In the first part of the questionnaire, 54 questions about mobbing were directed to the participants and their views were questioned with 5 likert scale. In the second part, personal information of the participants (age, sex, marital status, their department at work etc.) were questioned with classifier scale as demographic variables. Cronbach’s alpha analysis was applied with the purpose of testing the reliability of the created scale.
Independent sample t test was preferred in analyses regarding the variables composed of two independent groups, and one-way ANOVA was chosen for the comparisons with three or more groups. The above-stated tests were analyzed with PASW Statistic 18 package program.
Data Analysis:
The data set obtained as a result of the questionnaire were analyzed in PASW Statistic 18 (SPSS- Statistical Package for Social Sciences) package program. Reliability analysis, frequency tables, descriptive statistics, independent sample t test, one-way variance analysis and Tukey tests were used within the scope of the analysis. Cronbach’s alpha analysis was applied with the purpose of testing the reliability of the created scale and it was found 0.99.
Findings:
Demographic Statistics:
Data concerning the demographic characteristics of the participant individuals are presented in this part. The majority of the participants is female (57.5%). Regarding the age distribution of the participants of the questionnaire, it is observed that the 21-29 aged youth ranks first with a rate of 48.6%. Then the rate of 30-39 and middle aged participants is 32.5%. It is seen that a large part of the participants are married with a rate of 43.3% and they have one child with a rate of 48.3%. 61.6% of the participants have master or higher degree. Undergraduate education rate is 26.8%. Concerning the branches of the participants, most of them work in surgical sciences with a rate of 26.4%. Internal medicine comes second with a rate of 23.4%. When the working hours of the participants are concerned; while the total duration of work under 5 years is 22.1%, it was determined that a most participants have been in business life for 5 years and more. When the quality of the hospital of work is in question; more than half of the participants work in private hospitals. It has been ascertained that more than half of the participants have been working in their current institution for less than 5 years. When the profile of the participants is analyzed, nurses predominate with a rate of 37.5%. The rates of specialists are considerably high following nurses. Specialists correspond to 34.9% of total participants.
When the answers given to the questions of “Did mobbing cause health problem?” and “In whom did you
see mobbing behavior?” were discussed, it was determined that the ones being exposed to mobbing experience depression (40.6%) and stress (22.2%). Panic attack (10.5%) is mostly seen following these problems. It can be uttered that this condition negatively affects the work performance and efficiency of the participants. On the other hand, the participants exposed to mobbing stated that they saw this behavior mostly from the managers (50.6%). After the managers, the ones applying mobbing behavior mostly have been stated as the people working in senior positions (33.4%).
Factor Analysis:
Within the scope of factor analysis, likert scaled questions were directed and 54 statements were put to examination. After various attempts, all articles were seen to positively and directly affect as a result of being in the analysis. Accordingly, the decision was to continue the analysis with 54 statements. The analysis results are summarized below;
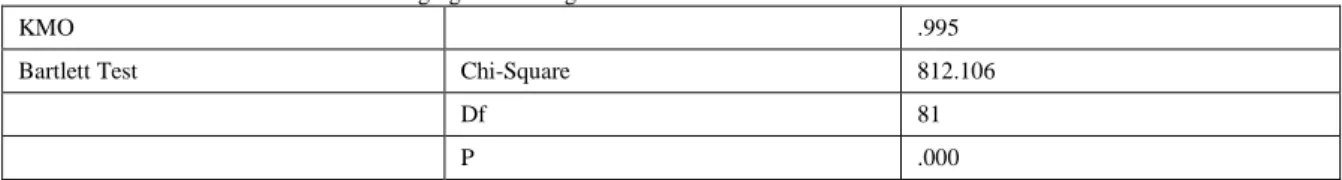
Table 1: KMO and barlett test results belonging to mobbing scale
KMO .995
Bartlett Test Chi-Square 812.106
Df 81
P .000
In order to ascertain the suitability of factor analysis, a factor analysis was carried out and the above-stated results were obtained. Accordingly, KMO criterion which measures the suitability of sample for the factor analysis was found to be 0.995>0.6. This indicates that the sample is suitable for the analysis. As Barlett criterion which is the measure of globalization is Sig (0.000)<0.05, it indicates the existence of correlation between the variables and factor analysis can be applied. When the total variance explanation table is discussed, the obtained 10 factors explain 72% of the total variance.
Table 2: factors and question groups
Question Group (Variables) Name of the Factor
Being forced to job/communication of poor quality Factor 1
Subjected to mental violence Factor 2
Isolation Factor 3
Being mocked/criticized Factor 4
Tending to bad habits Factor 5
Restriction of expression opportunities Factor 6
Physical violence Factor 7
Overcapacity work Factor 8
Not enjoying the job Factor 9
When Table 2 is analyzed, it is seen that the question group which measures the same criterion corresponds to the same factor.
Table 3: factor loads of factors and variables included in the research
8 9 10
I don’t find myself sufficient. As I am not as successful and productive as I used to be. .692
I am given overcapacity work on purpose. .692
My work place and house is given damage. .685
I am obliged to compensate pecuniary injury. .562
My self-confidence for me and my job has seriously decreased due to the mobbing applied. .675
I never enjoy my job, as I don’t feel the excitement for my job. .612
I lost my self-respect because of mobbing. .578
A decrease occurred in work performance and efficiency because of mobbing. .800
I feel that my energy has fallen because of mobbing. .789
I can’t get pleasure in life because of mobbing. .654
As can be seen in the Table, questions in 8th factor create the sub-dimension of “overcapacity work”, questions in 9th factor create the sub-dimension of “not enjoying the job” and questions in 10th factor create the sub-dimension of “decrease in work efficiency /performance”.
Table 4: t-test directed to the relation between sex and factors
Dependent Variables Groups N Sd t P
Overcapacity work Female 1438 2498 4.048 .000
Male 1062
Not enjoying the job Female 1438 2498 -1.237 .216
Male 1062
Decrease in work efficiency /performance Female 1438 2498 -3.644 .000
Male 1062
H1: Sex does not make difference on being given overcapacity work factor. H2: Sex does not make difference on not enjoying the job factor
H3: Sex does not make difference on decrease in efficiency factor
Results:
It is seen that sex statistically makes difference on factor of being given overcapacity work. Males are exposed to this situation more.
It is seen that sex does not statistically make difference on factor of not enjoying the job.
It is seen that sex statistically makes difference on factor of decrease in work efficiency. Males are exposed to this situation more.
Table 5: anova test directed to the relation between age and factors
Sum of Squares df Average of Squares F p Significan t Difference
Overcapacity work Between
-groups 14.575 3 4.858 4.881 .002 There is difference Within-group 2484.425 2496 .995 Total 2499.000 2499
Not enjoying the job Between
-groups 6.052 3 2.017 2.020 .109 There is no difference Within-group 2492.948 2496 .999 Total 2499.000 2499 Decrease in work efficiency/performance Between -groups 27.543 3 9.181 9.272 .000 There is difference Within-group 2471.457 2496 .990 Total 2499.000 2499
H4: Age does not make difference on factor of being given overcapacity work H5: Age does not make difference on factor of not enjoying the job
H6: Age does not make difference on factor of decrease in work efficiency
Results:
It is seen that age statistically makes difference on factor of being given overcapacity work. 50+ age group is exposed to this situation more.
It is seen that age does not statistically make difference on factor of not enjoying the job.
It is seen that age statistically makes difference on factor of decrease in work efficiency. 40-49 age group is exposed to this situation more.
Table 6: anova test directed to the relation between marital status and factors Sum of Squares df
Average of
Squares F p
Significant Difference
Overcapacity work
Between-groups 51.718 2 25.859 26.385 .000 There is difference Within-group 2447.282 2497 .980 Total 2499.000 2499
Not enjoying the job
Between-groups 33.983 2 16.991 17.212 .000 There is difference Within-group 2465.017 2497 .987 Total 2499.000 2499 Decrease in work efficiency/performance Between-groups 16.436 2 8.218 8.266 .000 There is difference Within-group 2482.564 2497 .994 Total 2499.000 2499
H7: Marital status does not make difference on factor of being given overcapacity work H8: Marital status does not make difference on factor of not enjoying the job
H9: Marital status does not make difference on factor of decrease in work efficiency
Results:
It is seen that marital status statistically makes difference on factor of being given overcapacity work. Single individuals and not married ones are exposed to this situation more.
It is seen that marital status statistically makes difference on factor of not enjoying the job. Single individuals and not married ones are exposed to this situation more.
It is seen that marital status statistically makes difference on factor of decrease in work efficiency. Single individuals and not married ones are exposed to this situation more.
Table 7: anova test directed to the relation between education and factors
Sum of Squares df Average of Squares F p Signifi cant Difference
Overcapacity work
Between-groups 13.246 3 4.415 4.434 .004 There is difference Within-group 2485.754 2496 .996 Total 2499.000 2499
Not enjoying the job
Between-groups 34.411 3 11.470 11.617 .000 There is difference Within-group 2464.589 2496 .987 Total 2499.000 2499 Decrease in work efficiency/performance Between-groups 41.769 3 13.923 14.143 .000 There is difference Within-group 2457.231 2496 .984 Total 2499.000 2499
H10: Education does not make difference on factor of being given overcapacity work H11: Education does not make difference on factor of not enjoying the job
H12: Education does not make difference on factor of decrease in work efficiency
Results:
It is seen that educational background statistically makes difference on factor of being given overcapacity work. Graduates with associate degree are exposed to this situation more.
It is seen that educational background statistically makes difference on factor of not enjoying the job. Graduates with associate degree are exposed to this situation more.
It is seen that educational background statistically makes difference on factor of decrease in work efficiency. Graduates with associate degree are exposed to this situation more.
Table 8: anova test directed to the relation between branch and factors Sum of Squares df
Average of
Squares F p
Significant Difference
Overcapacity work
Between-groups 181.624 4 45.406 48.886 .000 There is difference Within-group 2317.376 2495 .929 Total 2499.000 2499
Not enjoying the job
Between-groups 48.435 4 12.109 12.328 .000 There is difference Within-group 2450.565 2495 .982 Total 2499.000 2499 Decrease in work efficiency/performance Between-groups 13.616 4 3.404 3.417 .009 There is difference Within-group 2485.384 2495 .996 Total 2499.000 2499
H13: Branch does not make difference on factor of being given overcapacity work H14: Branch does not make difference on factor of not enjoying the job
H15: Branch does not make difference on factor of decrease in work efficiency
Results:
It is seen that branch statistically makes difference on factor of being given overcapacity work. Employees in medical biological sciences are exposed to this situation more.
It is seen that branch statistically makes difference on factor of not enjoying the job. Employees in basic medical sciences are exposed to this situation more.
It is seen that branch statistically makes difference on factor of decrease in work efficiency. Employees in basic medical sciences are exposed to this situation more.
Table 9: anova test directed to the relation between working life and factors Sum of Squares df
Average of
Squares F p
Significant Difference
Overcapacity work
Between-groups 361.342 10 36.134 42.073 .000 There is difference Within-group 2137.658 2489 .859 Total 2499.000 2499
Not enjoying the job
Between-groups 69.453 10 6.945 7.115 .000 There is difference Within-group 2429.547 2489 .976 Total 2499.000 2499 Decrease in work efficiency/performance Between-groups 118.207 10 11.821 12.358 .000 There is difference Within-group 2380.793 2489 .957 Total 2499.000 2499
H16: Duration of being in working life does not make difference on factor of being given overcapacity work
H18: Duration of being in working life does not make difference on factor of decrease in work efficiency
Results:
It is seen that duration of being in working life statistically makes difference on factor of being given overcapacity work. Employees working for four years are exposed to this situation more.
It is seen that duration of being in working life statistically makes difference on factor of not enjoying the job. Employees working for four years are exposed to this situation more.
It is seen that duration of being in working life statistically makes difference on factor of decrease in work efficiency. Employees working for one year are exposed to this situation more.
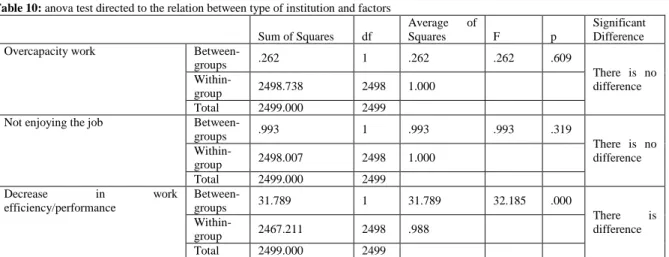
Table 10: anova test directed to the relation between type of institution and factors Sum of Squares df
Average of
Squares F p
Significant Difference
Overcapacity work
Between-groups .262 1 .262 .262 .609 There is no difference Within-group 2498.738 2498 1.000 Total 2499.000 2499
Not enjoying the job
Between-groups .993 1 .993 .993 .319 There is no difference Within-group 2498.007 2498 1.000 Total 2499.000 2499 Decrease in work efficiency/performance Between-groups 31.789 1 31.789 32.185 .000 There is difference Within-group 2467.211 2498 .988 Total 2499.000 2499
H19: Type of institution does not make difference on factor of being given overcapacity work H20: Type of institution does not make difference on factor of not enjoying the job
H21: Type of institution does not make difference on factor of decrease in work efficiency
Results:
Type of institution does not statistically make difference on being given overcapacity work.
Type of institution does not statistically make difference on not enjoying the job.
Type of institution is observed to statistically make difference on decrease in work efficiency. Employees of public hospitals are exposed to this situation more.
Table 11: anova test between duration of working in the same institution and factors Sum of Squares df
Average of
Squares F p
Significant Difference
Overcapacity work
Between-groups 236.511 10 23.651 26.019 .000 There is difference Within-group 2262.489 2489 .909 Total 2499.000 2499
Not enjoying the job
Between-groups 47.518 10 4.752 4.824 .000 There is difference Within-group 2451.482 2489 .985 Total 2499.000 2499 Decrease in work efficiency/performance Between-groups 73.698 10 7.370 7.563 .000 There is difference Within-group 2425.302 2489 .974 Total 2499.000 2499
H22: Duration of working in the same institution does not make difference on factor of being given overcapacity work
H23: Duration of working in the same institution does not make difference on factor of not enjoying the job H24: Duration of working in the same institution does not make difference on factor of decrease in work efficiency
Results:
It is seen that duration of working in the institution statistically makes difference on factor of being given overcapacity work. Employees working for ten years are exposed to this situation more.
It is seen that duration of working in the institution statistically makes difference on factor of not enjoying the job. Employees working for eleven years are exposed to this situation more.
It is seen that duration of working in the institution statistically makes difference on factor of decrease in work efficiency. Employees working for ten years are exposed to this situation more.
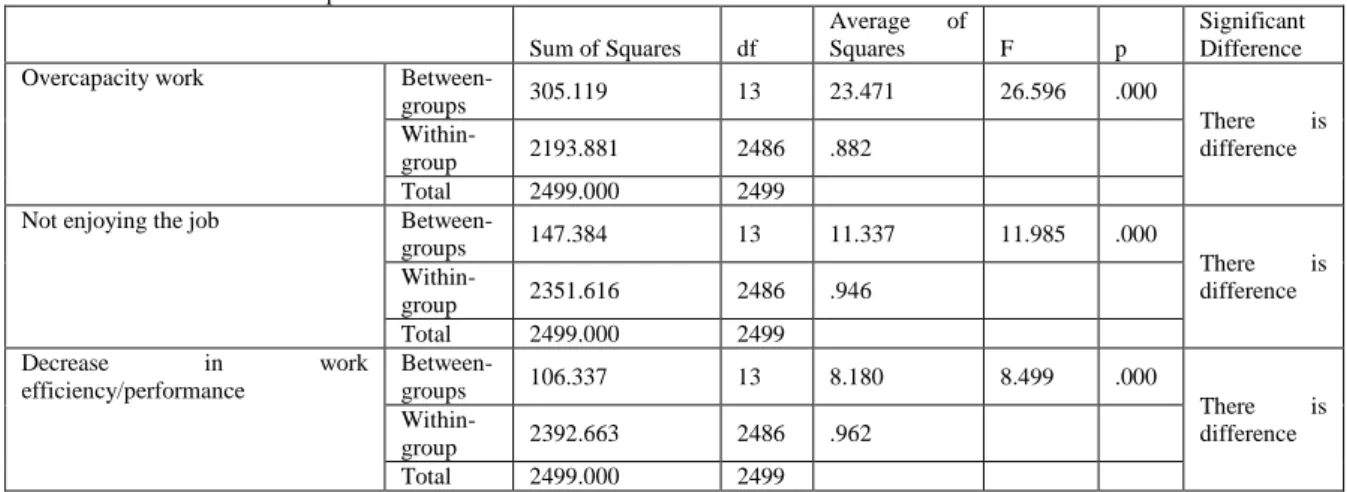
Table 12: anova test between the position in the institution and factors Sum of Squares df
Average of
Squares F p
Significant Difference
Overcapacity work
Between-groups 305.119 13 23.471 26.596 .000 There is difference Within-group 2193.881 2486 .882 Total 2499.000 2499
Not enjoying the job
Between-groups 147.384 13 11.337 11.985 .000 There is difference Within-group 2351.616 2486 .946 Total 2499.000 2499 Decrease in work efficiency/performance Between-groups 106.337 13 8.180 8.499 .000 There is difference Within-group 2392.663 2486 .962 Total 2499.000 2499
H25: The position in the institution does not make difference on factor of being given overcapacity work H26: The position in the institution does not make difference on factor of not enjoying the job
H27: The position in the institution does not make difference on factor of decrease in work efficiency
Results:
It is seen that the position in the institution statistically makes difference on factor of being given overcapacity work. Employees working as janitor are exposed to this situation more.
It is seen that the position in the institution statistically makes difference on factor of not enjoying the job. Employees working in hospitalization/discharge department are exposed to this situation more.
It is seen that the position in the institution statistically makes difference on factor of decrease in work efficiency. Employees working as clinic chief are exposed to this situation more.
Conclusion And Evaluation:
2500 personnel working in private and public hospitals were questioned regarding their opinions about the problems in their institutions, particularly mobbing behavior. Accordingly, the below results summarize the study.
- It is seen that the participants whose opinions about mobbing have been questioned are exposed to mobbing mostly from managers and they mostly suffer from such passive destructive complaints as depression and stress. The disorders like panic attack which is the next stage are at the third rank.
And one of the negative factors that causes stress in the people in the workplaceis the repression and the violence applied on the employees. The psychological violence is one of the stress factorsin the workplace and can lead to inefficiencies by adversely affecting the spiritsand motivation [3]. In our study, the depression and the stress come first among the disturbances seen as the result of mobbing. In addition, the mobbing, which adversely effects the working life, significantly lowers the business success and productivity due to the facts such asstress, depression and absenteeism it causes [46].
The mobbing, which takes precedence even over the sexual harassment in the developed countries is being mostly applied by the employees working at the upper levels of management and is seen as occupational disease of the senior managers (www.tbmm.gov.tr). Geçici and Sagkal (2011) in their study on nurses, have detected that the participants have shown the managers at second place (32.8%) as the occupational group that were exposed to mobbing [26]. Dilman (2007) in his study, pointed out that the nurses who were exposed to mobbing, have been more exposed to mobbing by the managers. In a study conducted by the ANF (Avustralian Nursing Federation)in Australia on 99% registered nurses (n=442), the nurses have identified primarily the managers and the supervisors as the real culprits of mobbing, then their colleagues,clients and employers [20].
In their study Çarıkçı and Yavuz (2009), have found out that theparticipants (41.2%) were moreexposed to mobbing bythe managers [14].
- It is seen that sex statistically makes difference on factor of being given overcapacity work. Men are exposed to this situation more.
- It is seen that sex does not statistically make difference on factor of not enjoying the job.
- It is seen that sex statistically makes difference on factor of decrease in work efficiency. Men are exposed to this situation more.
It is being estimated that all kinds of violence behaviors that are being experienced in the health institutions are experience more by women compared to men [25]. On the other hand, it is being stated that the physical violence is seen more frequently at the work places where men are majority, whereas in workplaces where women are the majority, the psychological violence is more prevalent, however, women exhibit passive-aggressive behaviors especiallyagainsttheir gender [12]. In our study the impact of the mobbing on genderwith different factors has been surveyed and it was found that mobbing was more effective on men in terms of giving a work over one’s capacity and decreasing the work efficiency.
- It is seen that age statistically makes difference on factor of being given overcapacity work.50+ age group is exposed to this situation more.
- It is seen that age does not statistically make difference on factor of not enjoying the job.
- It is seen that age statistically makes difference on factor of decrease in work efficiency. 40-49 age group is exposed to this situation more.
- It is seen that marital status statistically makes difference on factor of being given overcapacity work. Single individuals and not married ones are exposed to this situation more.
- It is seen that marital status statistically makes difference on factor of not enjoying the job. Single individuals and not married ones are exposed to this situation more.
- It is seen that marital status statistically makes difference on factor of decrease in work efficiency. Single individuals and not married ones are exposed to this situation more
- It is seen that educational background statistically makes difference on factor of being given overcapacity work. Graduates with associate degree are exposed to this situation more.
- It is seen that educational background statistically makes difference on factor of not enjoying the job. Graduates with associate degree are exposed to this situation more.
- It is seen that educational background statistically makes difference on factor of decrease in work efficiency. Graduates with associate degree are exposed to this situation more.
- It is seen that branch statistically makes difference on factor of being given overcapacity work. Employees in medical biological sciences are exposed to this situation more.
- It is seen that branch statistically makes difference on factor of not enjoying the job. Employees in basic medical sciences are exposed to this situation more.
- It is seen that branch statistically makes difference on factor of decrease in work efficiency. Employees in basic medical sciences are exposed to this situation more.
- It is seen that duration of being in working life statistically makes difference on factor of being given overcapacity work. Employees working for four years are exposed to this situation more.
- It is seen that duration of being in working life statistically makes difference on factor of not enjoying the job. Employees working for four years are exposed to this situation more.
- It is seen that duration of being in working life statistically makes difference on factor of decrease in work efficiency. Employees working for one year are exposed to this situation more.
- Type of institution does not statistically make difference on being given overcapacity work. - Type of institution does not statistically make difference on not enjoying the job.
- Type of institution is observed to statistically make difference on decrease in work efficiency. Employees of public hospitals are exposed to this situation more. In their study, Desley, Plank and Parker (2003), pointed out that the nurses working in the private sector experienced less mobbing compared to the other sectors [18]. According to the results of some studies applied on the health workers in our country with regard to the concept of mobbing, it was found out that the employees at the state hospitals and at the health services of the first grade, encountered with mobbing [6].
- It is seen that duration of working in the institution statistically makes difference on factor of being given overcapacity work. Employees working for ten years are exposed to this situation more.
- It is seen that duration of working in the institution statistically makes difference on factor of not enjoying the job. Employees working for eleven years are exposed to this situation more.
- It is seen that duration of working in the institution statistically makes difference on factor of decrease in work efficiency. Employees working for ten years are exposed to this situation more.
- It is seen that the position in the institution statistically makes difference on factor of being given overcapacity work. Employees working as janitor are exposed to this situation more.
- It is seen that the position in the institution statistically makes difference on factor of not enjoying the job. Employees working in hospitalization/discharge department are exposed to this situation more.
- It is seen that the position in the institution statistically makes difference on factor of decrease in work efficiency. Employees working as clinic chief are exposed to this situation more.
- The employee is forced to overcapacity work and s/he is left to be overwhelmed with this heavy workload.
- The employee who lost her/his self-confidence and will as a result of mobbing is alienated from the job and tasks.
- S/he has lost her/his performance and efficiency because of mobbing.
- In terms of the factor of being given overcapacity work, males, 50+ age group, graduates with associate degree and the personnel working in the institution for a long time experience more problems. Apart from that, the employees working in the medical biological sciences for a short time are forced to work with overcapacity. - It is seen that graduates with an associate degree or the employees working in basic medical sciences, the ones being in working life for a short time or the ones working in the same institution for a long time, and hospitalization/discharge departments are seen to have more problems regarding not enjoying the job.
- Regarding work efficiency, males between 40-49 age range working in public hospitals and graduates with an associate degree have more problems. Employees working in basic medical sciences and clinic chiefs are the groups with less efficiency in comparison to other groups.
- In case of being exposed to mobbing, sex does not have an effect on causing a health problem. 21-29 age group has less health problems than other age groups. The group apart from married and single ones, graduates with an associate degree, employees of surgical medical sciences working in public hospitals experience more health problems than other groups.
- Sex does not have an effect on the group that directs mobbing. In terms of age, 21-29 age group is different from other groups. Apart from these, the group apart from married and single ones, graduates with an associate degree, employees of surgical medical sciences, employees of public hospitals experience problems about this subject mostly.
- Work efficiency and performance of 83% has decreased. The studies carried out showed that mobbing caused job dissatisfaction, depression, excitement, and even may cause to leave work [3]. Akbaş (2009) in his study states that there is a negative relationship in general, between the psychological violence and the job satisfaction [1]. It can be said that the job dissatisfaction would bring a decline in business performance and the efficiency.
- 75% of them have experienced serious loss in their self-confidence. - %89 of them have lost their attitude and respect towards the job.
- Most of the participants have stated that they don’t enjoy their job and lost the interest for the job. - %86 of them have stated that they do not find themselves sufficient anymore.
REFERENCES
[1] Akbaş, S., 2009. İşyerinde Psikolojik Şiddet (Mobbing) ve İş Tatmini İlişkisi - Sağlık Çalışanları Üzerine Bir Uygulama, Master’s Thesis, Erzurum: Atatürk University, Institute of Social Sciences.
[2] Akgeyik, T., M. Güngör., Ş. Uşen and U. Omay, 2009. İşyerinde Psikolojik Taciz Olgusu: Niteliği, Yaygınlığı ve Mücadele Stratejisi, İstanbul University Journal of Social Politics Conferences, 56: 98. [3] Aksoy, F., 2008. Psikolojik Şiddet’in (mobbing) Sağlık Çalışanlarına Etkisi, Ph.D. Thesis, Marmara
University, Institute of Health Sciences, İstanbul, pp: 4,10.
[4] Annagür, B., 2010. Sağlık Çalışanlarına Yönelik Şiddet: Risk Faktörleri, Etkileri, Değerlendirilmesi ve Önlenmesi. Psikiyatride Güncel Yaklaşımlar, 2(2): 161-173.
[5] Atalay, İ., 2010. Mobbing’in Örgütsel Bağlılık Üzerindeki Etkisi “Kamu Sektöründen Bir Örnek”. Master’s Thesis, Ankara: Atılım University, Institute of Social Sciences.
[6] Ayrancı, Ü., Ç. Yenilmez, Y. Günay and C. Kaptanoğlu, 2002. Çeşitli Sağlık Kurumlarında ve Sağlık Meslek Gruplarında Şiddete Uğrama Sıklığı, Anadolu Psikiyatri Dergisi, 3: 147- 154.
[7] Aydın, Ş., N. Şahin and D. Uzun, 2007. Örgütlerde Yaşanan Psikolojik Şiddet Sorunlarının Konaklama İşletmeleri Açısından Değerlendirilmesi, Çukurova University Institute of Social Sciences Journal, 16(2): 61-74.
[8] Baldry, A.C., and D.P. Farrington, 2000. Bullies and Delinquents: Personal Characteristics and Parental Styles. Journal of Community and Applied Social Psychology, 10: 17-31.
[9] Balducci, C., V. Alfano and F. Fraccaroli, 2009. Relationships Between Mobbing at Work and MMPI-2 Personality profile, posttraumatic stress symptoms and suicidal ideation and behavior. Viol and Vict, 24(1): 52-67.
[10]Barling, J., A.G. Rogers. and E.K. Kelloway, 2001. Behind Closed Doors: In-home Workers’ Experience of Sexual Harassment and Workplace Violence. J Occup Health Psychol, 6(3): 225-269.
[11]Bennet, E., 1997. Commentary II. Journal of Community and Applied Social Psychology, 7: 245-247. [12]Björkqvist, K., 2001. Social Defeat as A Stressor in Humans. Physiology & Behavior, 73: 435-442.
[13]Budd, J.W., R.D. Arvey and P. Lawles, 1996. Correlates and Consequences of Workplace Violence. J Occup Health Psychol, 1(2): 197-210.
[14]Çarıkçı, İ.H., and H. Yavuz, 2009. Çalışanlarda Mobbing (psikolojik şiddet) Algısı: Sağlık Sektörü Çalışanları Üzerine Bir Araştırma, Süleyman Demirel University, Journal of Institute of Social Sciences,
2(10): 59.
[15]Davenport, N., R.D. Schwartz and G.P. Elliott, 2003. Mobbing: Emotional Harassment in Workplace, (Translated by O.C. Önertoy), Istanbul, Sistem Publishing.
[16]Davis, S.L., 2006. Development and Evaluation of a Workplace Violence Prevention Plan, Ph. D. Thesis, Nova Southeastern University.
[17]Demirel, Y., and A.M. Yoldaş, 2008. Sağlık Kuruluşlarında Karşılaşılan Psikolojik Yıldırma Davranışlarının Türkiye ve Kazakistan Açısından Karşılaştırılması, Journal of International Human Sciences, 5 (2): 4.
[18]Desley, H., A. Plank and V. Parker, 2003. Workplace Violence in Nursing in Queenisland, Australia: Aself Reported Study. International Journal of Nursing Practice, 9: 261-268.
[19]Dick, R., and U. Wagner, 2001. Stress and strain in teaching: A structural equation approach. British Journal of Educational Psychology. (71): 243- 259.
[20]Dilman, T., 2007. Özel Hastanelerde Çalışan Hemşirelerin Duygusal Tacize Maruz Kalma Durumlarının Belirlenmesi. Master’s Thesis, Marmara University, Institute of Health Sciences, Hemşirelikte Yönetim Anabilim Dalı, İstanbul.
[21]Einarsen, S., 2000. Harassment and Bullying at Work: a Review of The Scandinavian Approach, Aggression and Violent Behavior, 5(4): 379-401.
[22]Einarsen, S., and A. Skodstad, 1996. Bullying at Work: Epidemiological Findings in Public and Private Organizations. European Journal of Work and Organizational Psychology, 5(2).
[23]Eliot, A., D.W. Timoth and M.A. Robin, 2005. Social Psychology by Pearson Education Inc. New Jersey pp: 475-503.
[24]Eurofound., 2007. Quality Report of The 4th European Working Conditions Survey. Dublin, European Foundation for the Improvement of Living and Working Conditions, p: 38.
[25]Fronteira, I., I. Craveiro, A.R. Antunes, C. Conceiçao, I. Flores and O. Santos, 2003. Patterns of Perceptions of Workplace Violence in The Portuguese Health Care Sector Human Resources for Health, 1: 1-11. [26]Geçici, Bahçeci, N. and T. Sağkal, 2011. Ödemiş’te Çalışan Hemşirelerin Mobbinge Maruz Kalma
Durumlarının incelenmesi, Maltepe Üniversitesi Hemşirelik Bilim ve Sanatı Dergisi, 4(1): 56.
[27]Girardi, P., E. Monaco, C. Prestigiacomo, A. Talamo, A. Ruberto and R. Tatarelli, 2007. Personality and Psychopathological Profiles in Individuals Exposed to Mobbing. Violence and Victims, 22: 172-188. [28]Hoel, H., B. Faragher and C. Cooper, 2004. Bullying is Detrimental to Health, but All Bullying Behaviors
Are not Necessarily Equally Damaging. British Journal of Guidance & Counseling, 32(3): 367-387.
[29]Hubert, A., and M. Veldhoven, 2001. Risk Sectors for Undesirable Behavior and Mobbing. European Journal of Work and Organizational Psychology, 10(4): 415-424.
[30]Josipovic-Jelic, Z. E. Stoini and S. Celic-Bunikic, 2005. The Effect of Mobbing on Medical Staff Performance. Acta Clin Croat. 44: 347–352.
[31]Kırel, Ç., 2008. Örgütlerde Psikolojik Taciz (Mobbing) ve Yönetimi, Eskişehir: Anadolu University Publications, No.1806.
[32]Kingma, M., 2001. Workplace Violence in The Health Sector: A Problem of Epidemic Proportion, International Nursing Review, 48(3): 129-130.
[33]Kivimaki, M., M. Virtanen, M. Vartia, J.V. Elovainio and L. Keltikangas-Jarvinen, 2003. Workplace Mobbing and The Risk of Cardiovascular Disease and Depression. Occup Environ Med. 60: 779-783. [34]Lewis, D., 2003. “Voices in The Social Construction Of Bullying at Work: Exploring Multiple Realities in
Further and Higher Education”, International Journal Management and Decision Making, 4(1): 65-81. [35]Leyman, H., 1990. Mobbing and Psychological Terror in Workplaces: Violence and Victims, 5: 119-126. [36]Leymann, H., and A. Gustafsson, 1996. Mobbing and The Development of Posttraumatic Stress Disorders.
[37]Leymann, H., 1996. The Contend and Development of Mobbing at Work. European Journal of Work and Organizational Psychology, 5(2): 165-184.
[38]Mercanlıoğlu, Ç., 2010. Çalışma Hayatında Psikolojik Tacizin (mobbing) Nedenleri, Sonuçları ve Türkiye’deki Hukuksal Gelişimi, Journal of Organizasyon ve Yönetim Bilimleri, 2(2): 41.
[39]Namie, G., 2000. U.S. hostile workplace survey 2000, Labor Day Meeting, Benicie September, (Online) http://www.bullybusters.org, (04.05.2008).
[40]Niedhammer, I., S. David and S. Degionanni, 2006. 143 Occupational Physicians. Association between Workplace Bullying and Depressive Symptoms in The French Working Population. J Psychosom Res. 61: 251-259.
[41]Niedhammer, I., J.F. Chastang and S. David, 2008. Importance of Psychological Work Factors on General Health Outcomes in The National French SUMER survey. Occup Med. 58: 15-24.
[42]Niedl, K., 1996. Mobbing and Well-being: Economic and Personnel Development Implications. European Journal of Work and Organizational Psychology, 5: 239-249.
[43]Paksoy, N., 2007. İşyerinde Psikolojik Taciz-Yıldırma (mobbing), Kahramanmaraş Sütçü İmam University Institute of Social Sciences Department of Business Administration, Master’s Thesis, Kahramanmaraş. [44]TBMM: Kadın Erkek Fırsat Eşitliği Komisyonu Yayınları No:6 İşyerinde Psikolojik Taciz (Mobbing) ve
Çözüm Önerileri Komisyon Raporu Nisan 2011.http://www.tbmm.gov.tr/komisyon/kefe/docs/ komisyon_rapor_no_6.pdf Erişim tarihi: 29.12.2011
[45]WHO., 2003. Occupational and Environmental Health Program, Raising Awareness of Psychological Harassment at Work. Protecting Worker’s Health Series, No. 4. Geneva, Switzerland, WHO.
[46]Yıldız, S., and S. Yıldız, Eliş, 2009. Bullyıng ve Depresyon Arasındaki Ilişki: Kars İlindeki Sağlık Çalışanlarında Bir Araştırma, İstanbul Ticaret Üniversitesi Sosyal Bilimler Dergisi, Year: 8(15): 134. [47]Yılmaz, A., D. Ergun, Özler and N. Mercan, 2008. Mobbing ve Örgüt İklimi İlişkisine Yönelik Amprik Bir
Araştırma. Journal of Electronical Social Sciences, 7(26): 334-357.
[48]Zapf, D., 1999. Organizational, Work Group Related and Personal Causes of Mobbing /Bullying at Work. International Journal of Manpower, 20: 70-85.