Medical Faculty Mannheim, University of Heidelberg (Director: Prof. Dr. med. Heike Allgayer, MD, PhD)
Understanding the role of miR-122-5p in colorectal cancer liver
metastasis
Inauguraldissertation
zur Erlangung des medizinischen Doktorgrades der
Medizinischen Fakultät Mannheim der Ruprecht-Karls-Universität
zu Heidelberg
by Sha Guan
From Hubei, the P. R. China 2017
1
ABBREVIATIONS ... 3
1
INTRODUCTION ... 4
2
AIM OF PROJECT ... 12
3 MATERIALS AND METHODS ... 13
3.1 Materials ... 13 3.1.1 ... 13 3.1.2 ... 13 3.1.3 ... 13 3.1.4 ... 16 3.1.5 ... 16 3.1.6 ... 16 3.2 Methods ... 17 3.2.1 ... 17 3.2.2 ... 17 3.2.3 ... 18 3.2.4 ... 18 3.2.5 ... 19 3.2.6 ... 19 3.2.7 ... 19 3.2.8 ... 21 3.2.9 ... 21 3.2.10 ... 22 3.2.11 ... 23 3.2.12 ... 24 3.2.13 ... 24 3.2.14 ... 25
2 3.2.17 ... 26 3.2.18 ... 27 3.2.19 ... 27 3.2.20 ... 28 3.2.21 ... 28
4
RESULTS ... 29
4.1 ... 29 4.2 ... 30 4.3 ... 32 4.4 ... 32 4.5 ... 34 4.6 ... 35 4.7 ... 36 4.8 ... 37 4.9 ... 38 4.10 ... 39 4.11 ... 435
DISCUSSION ... 45
6
CONCLUSION ... 45
7 REFERENCE ... 55
8
CURRICULUM VITAE ... 63
9
ACKNOWLEDGEMENTS ... 64
3
B2M Beta-2 microglobulin
CDKN1A/P21 Cyclin-dependent kinase inhibitor 1A CRC Colorectal Cancer
DTC Disseminated Tumor Cell FBS Fetal Bovine Serum GDP Guanosine diphosphate
GIT1 G protein-coupled receptor kinase interacting ArfGAP 1 GRB7 Growth factor receptor-bound protein 7
GTP Guanosine triphosphate HCV Hepatitis C virus ITGAL Integrin, alpha L miRNA microRNA
PBS Phosphate Buffered Saline PCR Polymearase Chain Reaction Pri-miRNA Primary microRNA
Pre-miRNA Preliminary microRNA
qPCR/RT-PCR real-time quantitative polymerase chain reaction RABL6/C9orf86 RAB, member RAS oncogene family-like 6 RIMS1 Regulating synaptic membrane exocytosis 1 RIPA Radioimmunoprecipitation assay (buffer) RNU6-2 U6 small nuclear 2 RNA
RRN18S 18S ribosomal RNA SNO68 Small nucleolar RNA 68
4
1
INTRODUCTION
Colorectal Cancer (CRC) is the third most frequently diagnosed cancer and fourth leading cause of cancer death in males worldwide, and remains the second and third in females, respectively (Torre et al., 2015). The incidence and mortality have varied gradually over past decades. Some areas with historically low incidences like Western Asia and Eastern Europe are witnessing an increase, while the trend is declining in the United States, probably due to the increased use of screening (Siegel et al., 2017; Torre et al., 2015). However, there are still approximately 1.4 million cases and more than 0.6 million deaths every year (Jemal et al., 2011; Torre et al., 2015). Metastasis is the leading cause of CRC deaths and the liver is the most common metastasis site. Nearly 50% - 60% CRC patients are diagnosed with synchronous metastases, 80% of which have liver metastases (Stangl, Altendorf-Hofmann, Charnley, & Scheele, 1994; Yoo, Lopez-Soler, Longo, & Cha, 2006). Surgery is still advocated even in the absence of liver metastasis and 5-year survival rates are lower in patients with liver metastasis not undergoing surgery (Van Cutsem et al., 2006). Besides surgery, for disseminated CRC, there are systemic therapies including various drugs, either in combination or as single agents. Although these methods have prolonged patients’ survival, outcomes are still far from desirable (Bosset et al., 2014). Tumor heterogeneity occurring throughout the progression and dissemination processes account for the low response rates of single drugs (Wolpin & Mayer, 2008). The process is made more complex by the various molecular regulators that are involved.
The Metastasis cascade
Metastasis is multistage process with an orderly sequence of basic steps comprising local invasion, intravasation, survival in the circulation, extravasation, formation of micrometastasis and colonization (Poste & Fidler, 1980; Steeg, 2006). These steps are often broken down into two main phases; that of the physical dissemination of tumor cells from the primary tumor to distant tissues, and that of the adaptation of these cells to foreign microenvironments resulting in successful colonization (McGowan, Kirstein, & Chambers, 2009; Peinado, Lavotshkin, & Lyden, 2011; Talmadge & Fidler, 2010). Considerably, evidence has recently surfaced indicating that cells can disseminate remarkably early, dispersing from seemingly noninvasive premalignant lesions in both mice and humans (Coghlin & Murray, 2010; Klein, 2009). Contrary to earlier assumptions, oncogenic transformation on its own is insufficient to confer metastatic competence, as demonstrated by
5
the observation of patients with disseminated tumor cells (DTCs) that do not develop overt clinical metastasis and that of many oncogene driven mouse models of cancer that failed to establish distant metastasis (Klein, 2003; Minna, Kurie, & Jacks, 2003). Furthermore, failure or insufficiency at any of the steps is a potential rate limiting step and could stop the entire cascade (Nguyen, Bos, & Massague, 2009).
Metastasis begins with a loss of cell-cell adhesion, which is the prerequisite for dissociation of tumor cells from the primary tumor. Thereafter, local invasion and migration into the surrounding tissue occurs via the proteolytic degradation of the extracellular matrix. After intravasation into the peripheral blood circulation, the cells must first escape the immune defenses, adhere to a vessel wall somewhere in the body, and finally invade into the tissue and establish a secondary tumor (Coghlin & Murray, 2010; Jiang, Puntis, & Hallett, 1994). Induction of neoangiogenesis ensures the growth of the metastasis and the sufficient supply of nutrients (Carmeliet & Jain, 2011).
The proteolytic degradation of extracellular matrix structures and basement membranes during metastasis is carried out by various tumor-associated protease systems, such as serine, aspartate, cysteine and threonine metalloproteinases (Blasi & Carmeliet, 2002; Geho, Bandle, Clair, & Liotta, 2005; Kessenbrock, Plaks, & Werb, 2010). These enzymes do not differ from those that control physiological processes such as wound healing, inflammation, embryogenesis or angiogenesis (Dvorak, 1986; Kessenbrock et al., 2010). Rather, the overexpression of these enzymes is the defining characteristic of the invasive phenotype of malignant cells.
Metastatic colonization
A prominent feature of metastasis is the ability of different tumor types to colonize the same or different organ sites, but interestingly, different tumor types tend to metastasize to specific organ sites with certain tumor types showing a limited range of target tissues. In the initial phases, most disseminated tumor cells are likely to be poorly adapted to the microenvironment of the tissue in which they have settled. An acclimatization to this new environment needs to occur requiring colonization programs that are often tumor specific and dependent on the nature of the ‘would be’ colonized tissue microenvironment. Organ specific colonization functions in the case of bone metastasis are relatively well established, and for example, the ability of breast cancer cells to form typical osteolytic metastasis requires the
6
production of osteoclast activating factors PTHRP, IL-11, IL-6, TNFα and GM-CSF. GM-CSF directly promotes osteoclastogenesis while the rest of the cytokines induce osteoclast formation via the induction of RANKL, a nuclear factor-κβ ligand. The expression of these secreted factors would be unlikely to provide a selective advantage in another metastatic site or in the primary tumor but are essential to the development of osteolytic lesions. The mediators of colonization in other organ microenvironments such as the brain and liver remain unknown (Nguyen et al., 2009).
The liver is a common metastasis site for several solid tumors, especially that of the gastrointestinal tract. In addition, the liver is also colonized by hematogenous tumors such as myelomas and leukemias. Its unique biology and anatomical location renders the liver particularly receptive to circulating disseminated tumor cells. The two sources of its unique dual blood supply (80 percent deoxygenated blood via the portal vein and 20 percent oxygen-rich blood via the hepatic artery) come together at the point of entry into the sinusoids, and the mixed blood supplies the liver parenchymal cells before draining via the centrilobular veins. Circulating tumor cells can enter the liver through both vascular entry ports.
The normal liver actually displays inherent architectural and functional features which favor metastasis. These features include: (a) a liver-specific microcirculation with its unique sinusoidal cell population, (b) perivascular mesenchymal cells including hepatic stellate cells (HSCs), (c) a morphologically and metabolically heterogeneous parenchymal cell compartment, and (d) the hepatic regional immunity (Kruger, 2015). The distinctive circulatory network in the hepatic sinusoids positively contributes to the retention of disseminated tumor cells in the liver (Figure 1).
7 Figure 1. Inherent features of hepatic sinusoids favor metastasis (red arrows): Connection of sinusoids and primary tumour sites via the blood circulation and entry of TCs via the portal triad; perivascular portal tract fibroblasts and HSCs secrete prometastatic factors; slow blood flowing in microcirculation promoting attachment of TCs to HSECs; metabolically heterogeneous parenchymal cells and oxygen gradient; regional immune suppression by interactions of MDSCs with other immune cells and activated HSC (black arrows). Invasion of mature neutrophils (Dotted arrow). Fibr portal tract fibroblasts, Hep hepatocyte, HSC hepatic stellate cells, actHSC activated hepatic stellate cells, KC Kupffer cells, MDSC myeloid-derived suppressor cells, NK natural killer cells, NΦ neutrophil granulocytes, O2conc
oxygen concentration, SoD space of Disse, TC tumour cell, T T lymphocyte. Figure adapted from (Kruger, 2015).
Four major phases have been described in the progression of liver metastasis: (1) the microvascular phase, including tumor cells arrest in the sinusoidal vessels, can lead to tumor cell death or extravasation; (2) the extravascular, pre-angiogenic phase, during which avascular micrometastases appear via recruitment of host stromal cells ; (3) the angiogenic phase, during which endothelial cells are initiated and the tumors become vascularized via interactions with the microenvironment; and (4) the growth phase, which leads to the establishment of ‘clinical’ metastases (Van den Eynden et al., 2013).
8 MicroRNAs
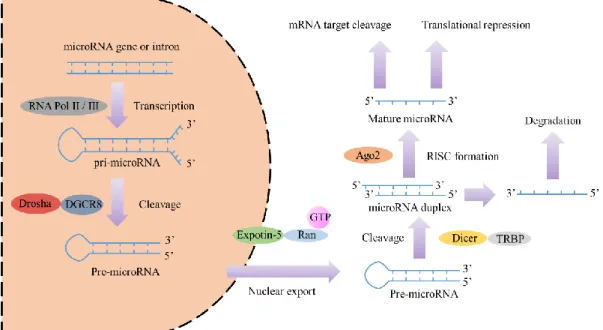
MicroRNAs (miRNAs) are small non-coding RNA molecules (18-22 nucleotides) that regulate gene expression (Ambros, 2004). The human genome encodes over 1000 miRNAs (Bentwich et al., 2005), which appear to target about 60% of the protein coding genes (Lewis, Burge, & Bartel, 2005). miRNA genes are usually transcribed by RNA polymerase II. The resulting transcript is a spliced stem-loop precursor with a 5’ cap and a poly (A) tail called primary miRNA (pri-miRNA) (Lee et al., 2004). A single pri-miRNA may contain one to six miRNA precursors. A pri-miRNA is cut by the DiGeorge Syndrome Critical Region 8 (DGCR8), and Drosha enzymes, resulting in the formation of a precursor-miRNA (pre-miRNA) (Conrad, Marsico, Gehre, & Orom, 2014). These are then exported out of the nucleus and cut by the RNase enzyme, Dicer. The final product is a mature miRNA about 18~22 nucleotides in length (Lund & Dahlberg, 2006) (Figure 2).
Figure 2. Schema of microRNA biogenesis. Figure adapted from (Winter, Jung, Keller, Gregory, & Diederichs, 2009).
miRNAs function in cell regulation. A miRNA is complementary to a part of one or more messenger RNAs (mRNAs). Animal miRNAs are usually complementary to the 3’ UTR (X. J. Wang, Reyes, Chua, & Gaasterland, 2004) in a manner that is usually imperfect. miRNAs normally inhibit the protein translation of target mRNAs (Williams, 2008) but some miRNAs augment the degradation of mRNAs (Eulalio et al., 2009).
9
Most miRNAs are located within cells but some of them can be found in the extracellular environment like culture media and function in cell-cell signaling (Turchinovich, Weiz, & Burwinkel, 2012).
MicroRNAs in Cancer and Cancer Metastasis
Several miRNAs have been linked to cancer. MicroRNAs are deregulated in an array of solid cancers, as well as hematological malignancies (Lu et al., 2005). The finding that miRNAs have a role in cancer is reinforced by the fact that about 50 percent of miRNA genes are located in cancer associated genomic regions, or in fragile sites. The list of cancer-associated miRNAs is growing very rapidly. The deregulation of certain miRNAs has been shown to cut across several cancer types, for instance miR-21 is commonly up-regulated in breast, colon, lung, pancreas, prostate, stomach, cervical, ovarian, hepatobilliary and head and neck cancers as well as in B-cell lymphoma and chronic lymphocytic leukemia (Lu et al., 2005; Volinia et al., 2006).
A significant number of miRNAs have been identified to be linked with CRC, such as miR-10b (Baffa et al., 2009), miR-451 (Bitarte et al., 2011), miR-135b (Gaedcke et al., 2012), miR-224 (Ling et al., 2016), et al. In some of the published reports, the affected target proteins and implicated pathways identified were linked to the prediction and prognosis of metastasis in CRC. Since metastasis is the main cause of mortality, a lot of research has been focused on the difference between primary cancer and metastases like liver metastases. For instance, let-7i and miR-10b were significantly downregulated in liver metastases compared with primary CRC (Hur et al., 2015).
The Allgayer group has done a considerable amount of work on miRNAs and colorectal cancer metastases (Asangani et al., 2008; Ceppi et al., 2010; Kumarswamy et al., 2012; Laudato et al., 2017; Mudduluru et al., 2011). The group identified an exclusive miRNA signature that is differently expressed in metastases. Three of these miRNAs were identified as key drivers of an EMT-regulating network acting through a number of novel targets including SIAH1, SETD2, ZEB2 and especially FOXN3, which suppress the transcription of N-cadherin. The modulation of N-cadherin impacted on the migration, invasion and metastasis of cancer cells (Mudduluru et al., 2015). Similarly, the group found the miRs-134 and -370 to be potential tumor suppressor miRNAs that could suppress colorectal cancer tumorigenesis by regulating the EGFR signaling cascade (El-Daly, Abba, Patil, & Allgayer,
10
2016).
miR-122
miR-122 is highly abundant and specific to the liver and this microRNA plays a critical role in liver homeostasis by regulating the expression of a large number of target mRNAs and also by suppressing non-hepatic genes (Fu et al., 2005; Landgraf et al., 2007). It is normally known to be involved in the regulation of numerous transcripts encoding a variety of hepatic processes, like cholesterol and lipid metabolism (Esau et al., 2006), mitochondrial function (Burchard et al., 2010), polyploidy regulation (Hsu et al., 2016), hepatitis C virus replication (Jopling, Yi, Lancaster, Lemon, & Sarnow, 2005), and liver tumor suppression (Tsai et al., 2009). Hepatic and circulating levels of miR-122 are a prognostic marker in patients with hepatocellular carcinoma (Coulouarn, Factor, Andersen, Durkin, & Thorgeirsson, 2009).
Several liver-enriched transcription factors, e.g. C/EBPα, HNF1α, HNF3β, and HNF4α (Coulouarn et al., 2009; Xu et al., 2010) and HNF6 (Laudadio et al., 2012) were shown to activate miR-122 gene expression in hepatic cell lines. Furthermore, miR-122 has been identified to regulate a large set of target genes. In fact, the first miR-122 target identified was the gene cationic amino acid transporter 1 (CAT-1) or Slc7a1 (J. Chang et al., 2004), which is expressed in many other adult tissue types and strongly expressed in fetal liver, yet under normal un-stressed circumstances, is repressed in adult hepatocytes (Krutzfeldt et al., 2005). As a tumor suppressor, miR-122 suppresses c-Myc transcription by targeting E2f1, a transcriptional activator, and Tfdp2, a co-activator. Whereas c-Myc suppresses miR-122 expression directly by binding to its promoter region and indirectly by downregulating several liver enriched transcription factors (B. Wang et al., 2014). There are other oncogenes identified as its targets, such as cyclin G1, involved in G2/M arrest in response to DNA damage (S. Wang et al., 2012), RhoA, a member of the Rho family of small GTPases associated with tumor cell proliferation and metastasis (S. C. Wang et al., 2014), and BCL-w, an anti-apoptotic Bcl-2 family member (Lin, Gong, Tseng, Wang, & Wu, 2008). However, despite a lot of existing data on miR-122 and its association with tumorigenesis (Figure 3), a complete description of the miR-122-regulated target network, especially in metastasis remains incomplete.
11 Figure 3. The network of parts of the interactions between miR-122 and its main identified target genes (blue circles) for the regulation of HCV (Hepatitis C virus) replication (green circles) and tumor related processes (normally focus on hepatocellular carcinoma) (red and grey circles) (J. Chang et al., 2004; Hsu et al., 2016; Lin et al., 2008; Tsai et al., 2009; B. Wang et al., 2014; S. Wang et al., 2012; S. C. Wang et al., 2014).
As a prelude to this project, the whole genomes of 12 patients with advanced colorectal cancer were sequenced with the Illumina next generation sequencing platform at the Allgayer department. Bioinformatics analysis and subsequent validation showed that the miR-122 gene locus was deleted in primary tumors and corresponding metastases of most patients. Interestingly, while the expression of miR-122 was suppressed in primary tumors, it was significantly increased in metastatic lesions. This, however, contrasted to the additional observation at the genome level.
12
2
AIM OF THE PROJECT
The aim of this project was to investigate the role of miR-122 in colorectal cancer liver metastasis. The specific objectives were to:
1) Identify putative targets of miR-122 that could play a role in metastasis
2) Validate the identified targets with 3’UTR reporter gene assays and evaluate the specificity of the miRNA/target interactions
3) Evaluate the impact of miR-122 on the expression of the identified targets
4) Investigate the mechanisms of miR-122 activity in the context of liver metastasis
13
3 MATERIALS AND METHODS
3.1 Materials 3.1.1 Cell lines
The RKO, CaCo2, SW48, SW480, SW620, HCT116, HT1080, DLD-1, Colo-320 (human colorectal), and 239T (mouse embryonic kidney) cell lines were obtained from the American Type Culture Collection (ATCC). The Huh7 and Hep3B cell lines were kind gifts from Drs. Rodriguez-Vita and Clemm von Hohenberg both of the German Cancer Research Center (DKFZ), respectively. The cell lines were maintained in the recommended media supplemented with 10% FBS. All cells were cultured in a humidified incubator at 37 °C with 5% CO2.
3.1.2 Plasmids
Empty vector plasmid pLightSwitch 3’ UTR plasmid was purchased from SwitchGear Genomics (Menlo Park, USA).
Figure 4. pLightSwitch 3’ UTR plasmid stucture
http://switchgeargenomics.com/resources/vector-maps/3utr-reporter-vector 3.1.3 Primers
3’UTR cloning primers
Gene name Gene symbol Forward primer (Tm [°C]) Reverse primer (Tm [°C])
Regulating synaptic RIMS1 AATATGCTAGCTGAACTCATAC CCGCGCTCGAGGACATGAA AAGTAAATTTTATTAAA
14 membrane exocytosis 1 CAGAGTCATTCCAA (72.1) (70.9)
RAB, member RAS oncogene family-like 6 RABL6/C9orf86 ATTAATGCTAGCGCCGGCGTGG GCAGTGGCCGCCCTG (84.6) GCCGGCCTCGAGCAGAGTG AAACAGGAGTGCTTTATG (80.1) ABL proto-oncogene 1, non-receptor tyrosine kinase ABL1 TTAATTAGCTAGCCAGCAGTCA GGGGTCAGGTGTCAGG (79.1) CCGGCCGCTCGAGCTAATG TAAACACTGATTTATTTAA (74.5) G protein-coupled receptor kinase interacting ArfGAP 1 GIT1 AATTAGCTAGCCCTCTCTCCCC ACACCCTCACCTGC (79.9) GGCCGCTCGAGAACAGCTC ATGGTCACTTCTTTATT (76.6)
Growth factor
receptor-bound protein 7 GRB7 TTAAATTAGCTAGCCCAGGCCG TGGACTGGCTCATGCCT (80.0) GGCCCGGCCTCGAGGTATC AAAAAATAATCTTTATTGT C (75.9)
Integrin, alpha L ITGAL AATTAGCTAGCGTCCAGGCCTG
TGAGGTGCAGAGTG (79.1)
GGCCGCTCGAGGGACAGA ATTTCACATTTATTGGAT (75.4)
Site-directed mutagenesis primers:
Gene symbol
Forward primer (Tm [°C]) Reverse primer (Tm [°C])
RIMS1 1 cagaaatgtgtagaatacaacttttcacatctgtagagtttcc agtttgttcaatttggtgtgtgtgtgt (78.19) acacacacacaccaaattgaacaaactggaaactctacag atgtgaaaagttgtattctacacatttctg(78.19) 2 Catttttttaatatcaggaagaaaaaggcattacaagtctgtt tttcaaagtacaattatgcagttagttttagtcccca (78.09) Tggggactaaaactaactgcataattgtactttgaaaaaca gacttgtaatgcctttttcttcctgatattaaaaaaatg (78.09) 3 Atgctgctctatttgtgtaatcacaaaagtgtctgtactcata aaaggagggagaacatatcaatgc (78.04) Gcattgatatgttctccctccttttatgagtacagacactttt gtgattacacaaatagagcagcat (78.04) 4 Attggaatttcatttaaaagcacagggtctgtttaagacaag tggtcaaaatagaaagatactacccaattataatcag (78.56) Ctgattataattgggtagtatctttctattttgaccacttgtctt aaacagaccctgtgcttttaaatgaaattccaat (78.56)
15 RABL6/ C9orf86 1 Ctgagtggagtgtttgggagtctgtcctcccggctcctgcc ttcg (79.08) Cgaaggcaggagccgggaggacagactcccaaacact ccactcag (79.08) 2 Ggagtgctttatggtctgagtgtctgttttgggagtctgtcct cccggct (78.50) Agccgggaggacagactcccaaaacagacactcagac cataaagcactcc (78.50) GIT1 1 Tggggtggggattaatgtctgtctgtgcccagctcctatgg ccagtg (78.31) Cactggccataggagctgggcacagacagacattaatcc ccacccca (78.31) 2 Acctggctgccaggtctgttggcagcactaagggcacttg tgcca (78.17) Tggcacaagtgcccttagtgctgccaacagacctggcag ccaggt (78.17) 3 Aggcgaggggctggtctgtatgccttgcaggcccctgctc act (78.97) Agtgagcaggggcctgcaaggcatacagaccagcccct cgcct (78.97) 4 Cggagagctgccccacttgtctgttccccacctgccccttt gc (78.97) Gcaaaggggcaggtggggaacagacaagtggggcag ctctccg (78.97) 5 Aagttcatagagaaggggcgatctgtgggagggatcagg gaggcagc (78.31) Gctgcctccctgatccctcccacagatcgccccttctctat gaactt (78.31) GRB7 1 Caaagaagcagaggagaaaactgtctgtgcggaaccctc ccgctcctcatc (79.36) Gatgaggagcgggagggttccgcacagacagttttctcc tctgcttctttg (79.36) 2 Gagaggggtcaggagtggactgtctgtggggctgttttct atctgaggg (79.28) Ccctcagatagaaaacagccccacagacagtccactcct gacccctctc (79.28) 3 Ttcccttgaggagaggggtcagtctgtgactgtctgtggg gctgttttc (78.44) Gaaaacagccccacagacagtcacagactgacccctct cctcaagggaa (78.44) RT-PCR primers
RT-PCR primers were purchased from QIAGEN; RIMS1 (Cat# QT01016673), RABL6 (Cat# QT00105042), and for internal control B2M (Cat# PAHS-000Z), RRN18S (Cat# QT00199367). The primers for miRNAs were also purchased from QIAGEN; miR-122 (Cat# MS00003416) and for internal control RNU6-2_11 (Cat# MS00033740).
16 3.1.4 miRNA mimics and inhibitors
miR-122 mimic and inhibitor were purchased from from Ambion, Life Technologies (miR-122 mimic ID: MC11012 and inhibitor ID: MH11012).
3.1.5 Antibodies
Primary antibodies
Antibody anti- Species/isotype Dilution for WB Supplier
RIMS1 IgG Rabbit 1:5000 Alomone labs
RABL6 IgG Rabbit 1:5000 ThermoFisher
β-actin IgG Rabbit 1:10000 Abcam
Secondary antibodies
Antibody anti- Dilution for WB Supplier
Rabbit IgG Mouse IgG 1:10000 1:10000 Cell Signaling Cell Signaling 3.1.6 Kits Products Supplier
QIAamp® DNA Mini kit QIAGEN
17
Qiaquick® Gel Extraction Kit
Qiaquick® PCR Purification Kit
QIAprep® Spin Miniprep Kit
QIAGEN
QIAGEN
QIAGEN
miRNeasy® Mini Kit QIAGEN
exoEasy Maxi Kit QIAGEN
exoRNeasy Serum/Plasma Starter Kit
CellTiter 96® Aqueous One Solution Cell Proliferation Assay
QIAGEN
Promega
3.2 Methods 3.2.1 Cell culture
Cells were cultured routinely in T25 flasks at 37°C in the presence of 5% CO2 and 90%
humidity. Culture media were cell line specific (Gibco GmbH, Germany) and supplemented with 10% FBS (Sigma-Aldrich). Depending on growth rate, cells were passaged as necessary. The routine procedure consisted of washing the cells with PBS (Gibco GmbH, Germany) and adding trypsin (Gibco GmbH, Germany) to cover the cells, followed by a 3-5 min short incubation at 37°C to aid detachment. The cells were then observed under a microscope to confirm detachment. A minimum of 3 volumes in excess of trypsin, of complete medium (with FBS) was added to the cells, pipetted up and down several times to ensure a single cell suspension, centrifuged to remove excess trypsin, re-suspended in medium and distributed into new flaks in the required dilution and topped up with medium requisite of the flask.
3.2.2 Co-culture
Huh7 cells were plated in the bottom of 12mm Transwell® with 0.4µm Pore Polyester Membrane Insert (Costar) 2 days before RKO cells. Each well contains 200,000 Huh7 cells initially. RKO cells were plated into the top small well 2 days later for 100,000 cells per well.
18
After 48 or 72 hours, total RNA of RKO cells in the top well was collected by miRNeasy® Mini Kit (QIAGEN).
3.2.3 Transfection
Two different colorectal cancer cell lines (HCT116 and RKO) were used for transfection with miRNA-mimics, -inhibitors, and their corresponding scrambled controls. Mimics and inhibitors were transfected at a final concentration of 150 nM using the METAFECTENE® (Biontex Laboratories GmbH). The cells were incubated for 24–72 hours following transfection before proceeding with experiments.
3.2.4 RNA Isolation
Total RNA including miRNA was extracted and purified from cell lines using Qiagen’s miRNeasy Mini Kit according to the manufacturer’s protocols. The cells were disrupted by adding 700 µl QIAzol Lysis Reagent (GIAGEN) and pipetting to mix. The lysate was transferred into a microcentrifuge tube. Then the tube was placed on the benchtop at room temperature (15–25°C) for 5 min. 140 µl chloroform was added into the tube and shake the tube vigorously for 15 s. Place the tube on the benchtop at room temperature for 2–3 min. Centrifuge for 15 min at 12,000 x g at 4°C. After centrifuge, the upper aqueous phase in the tube was transferred to a new collection tube. 1.5 volumes (usually 525 µl) of 100% ethanol was added and mix thoroughly by pipetting up and down several times. The sample was added into an RNeasy Mini spin column in a 2 ml collection tube (supplied in the kit) and was centrifuged at ≥8000 x g (≥10,000 rpm) for 15 s at room temperature(15–25°C). The flow-through was discarded. 700 µl Buffer RWT was added to the RNeasy Mini spin column and centrifuged for 15 s at ≥8000 x g (≥10,000 rpm) to wash the column. 500 µl Buffer RPE was added onto the RNeasy Mini spin column and centrifuged for 15 s at ≥8000 x g (≥10,000 rpm). Another 500 µl Buffer RPE was added to the RNeasy Mini spin column and centrifuged for 2 min at ≥8000 x g (≥10,000 rpm) to dry the RNeasy Mini spin column membrane. In the end, 30–50 µl RNase-free water was added directly onto the RNeasy Mini spin column membrane and centrifuge for 1 min at ≥8000 x g (≥10,000 rpm) to elute the RNA. RNA can be stored at -80°C. The concentration of RNA was measured by NanoDrop™ 2000 Spectrophotometer (ThermoFisher).
19 3.2.5 DNA Isolation
Genomic DNA was extracted with the QIAamp® DNA Mini kit from 293T cell line according to the given protocol. In summary, cell pellets were re-suspended in 200 µl PBS and 200 µl Buffer AL was added to the sample. Mix by pulse-vortexing for 15 s. The mixture was incubated at 56°C for 10 min. 200 µl ethanol (96–100%) was added to the sample, and pulse-vortexed for 15 s. After mixing, the mixture was applied to the QIAamp Spin Column and centrifuged at 6000 x g (8000 rpm) for 1 min. 500 µl Buffer AW1 was added then and centrifuged at 6000 x g (8000 rpm) for 1 min. 500 µl Buffer AW2 was added and centrifuged at full speed (20,000 x g; 14,000 rpm) for 3 min. 200 µl Buffer AE or distilled water was added. Incubate at room temperature (15–25°C) for 1 min, and then centrifuge at 6000 x g (8000 rpm) for 1 min. The products can be stored at -20°C. The concentration of DNA was measured by NanoDrop™ 2000 Spectrophotometer (ThermoFisher).
3.2.6 Reverse Transcription (cDNA synthesis)
Reverse transcription was performed to obtain the cDNA from RNA. Cell line RNA samples were thawed on ice. We used miScript II RT Kit (QIAGEN) and chose 5 × miScript HiFlex Buffer for the reverse transcription. Assemble the following reaction in a sterile microcentrifuge tube and incubate at 370C for 1 hour and 950C for 5 min. After reverse transcription, cDNA was diluted 10× and stored at -200C.
Sample RNA 500ng
5 × miScript HiFlex Buffer 2µl
10 × miScript Reverse Transcripttase Mix 1u
10 × miScript Nucleics Mix 1µl
Rnase-Free Water Variable
Final volume 10µl
3.2.7 PCR for amplification of 3’UTR
20 Term End Concentration Volume
10 × Qiagen PCR buffer 1 × 1 μL
Forward Primer 0.2 μM 0.2 μL
Reverse Primer 0.2 μM 0.2 μL
dNTPs 0.2 mM 0.2 μL
Qiagen Tag DNA polymerase 0.5 unit/μL 0.1 μL
Water Variable
DNA template (100ng) Variable
Total volume of reaction 10 μL
PCR setup for 3‘UTR cloning of MIR122 targets
Gene Initial
Denat.
Denat. Annealing Extension Final Extension Cycles RIMS1 94℃ 3 min 94℃ 1 min 58℃ 45 sec 72℃ 2 min 72℃ 10 min 35
RABL6/C9orf86 55℃ 45 sec 72℃ 1 min
ABL1 55℃ 45 sec 72℃ 90 sec
GIT1 60℃ 45 sec 72℃ 30 sec
GRB7 51℃ 45 sec 72℃ 2 min
21 3.2.8 Realtime-PCR
Realtime-PCR was used to quantity miR-122 expression in different cell lines or cells under different interfering. Real-time PCR was performed using Fast SYBR™ Green Master Mix (Applied Biosystems™). All samples were normalized to the internal control (B2M or RNU6) and fold changes were calculated with the 2-ΔΔCt method.
Term End Concentration MIR122 RNU6
Fast SYBR™ Green Master Mix 1 × 5 μL 5 μL
10 × Primers 1 × 1 μL 1 μL
Universal primer 0.5 μM 1 μL 1 μL
Water 1 μL 1 μL
cDNA template (1:10 diluted) 2 μL 2 μL Total volume of reaction 10 μL 10 μL
Term Final Concentration RIMS1 RABL6 B2M
Fast SYBR™ Green Master Mix 1 × 5 μL 5 μL 5 μL
10 × Primers 1 × 1 μL 1 μL 1 μL
Water 2 μL 2μL 2 μL
cDNA template (1:10 diluted) 2 μL 2 μL 2 μL Total volume of reaction 10 μL 10 μL 10 μL
3.2.9 Colony PCR
Single colonies were picked and suspended in 100µl Milli-Q water. Meanwhile a regular PCR with pLightSwitch_3UTR plasmid primers (Forward: GGGAAGTACATCAAGAGCTTCGT; Reverse: CCCCCTGAACCTGAAACATAAA) and gel analysis were performed to verify the
22
insert DNAs. The correct ones were added into 5ml LB medium with Ampicillin respectively and shaken overnight at 37°C. QIAprep® Spin Miniprep Kit was used to extract and purify plasmids from E.coli (One Shot™ TOP10 Chemically Competent E. coli, Invitrogen™). Two
to 3 clones of each 3‘UTR were sequenced to identify correctly cloned 3’UTRs.
3.2.10 Plasmids
The restriction sequences for the chosen restriction enzymes were already incorporated to the forward and reverse primers of the target genes of miR-122. The restriction digest reaction (Nhe I 10,000 u/ml and Xho I 20,000 u/ml, New England BioLabs) were assembled in a sterile microcentrifuge tube and incubated at 37°C for 1 hour. For the pLightSwitch, plasmid vector, 1ul of Shrimp Alkaline Phosphatase (SAP, 1 u/µl) (Fermentas) was added for 1 hour at 37°C after the digestion. The DNA products were purified with the Qiaquick® PCR Purification Kit according to the protocol as described in 3.2.14.
DNA fragment or plasmid 1000 ng Nhe I 1 µl Xho I 1 µl Cutsmart buffer 5 µl Nuclease-Free Water to final volume of 50 µl
T4 DNA Ligase (5u/µl) (Fermentas) catalyzed the ligation of the amplified 3‘UTR fragments to the pLightSwitch_3’UTR plasmid after the digestion with NheI and XhoI I. A 3:1 molar ratio of vector: insert DNA was used as following:
100ng vector × kb size of insert × 3 = ng of insert 3.9 kb vector 1
Assemble the following reaction in a sterile microcentrifuge tube and incubate at room temperature overnight.
Vector DNA 100ng Insert DNA Variable
23 Ligase 10X Buffer 1µl
T4 DNA Ligase 1u Nuclease-Free Water to final volume of 10µl
One Shot® TOP10 Chemically Competent E. coli (Invitrogen) were thawed on ice for half an hour. 10µl ligation reaction product was added into 50µl of competent cells and incubated on ice for 30 min. Then the cells were heat shocked for 45 sec at 42℃ and immediately placed on ice for 5 min. 500µl LB (Luria Broth) medium was added into each tube and incubated for 1 hour at 37°C with vigorous shaking. The suspension was then applied on a LB agar plate containing Ampicillin. The plates were incubated overnight at 37°C. Single colonies were picked and then processed as in step 3.2.9.
3.2.11 Site directed mutagenesis
PCR set up for site directed mutagenesis
10× reaction buffer 5 µl dsDNA template (plasmids in 2.2.9 verified by sequencing) 50 ng
Oligonucleotide primer #1 250 ng Oligonucleotide primer #2 250 ng dNTP mix 1 µl ddH2O to a final volume of 50 µl
1 µl of Pfu DNA Polymerase (native) (2.5 u/µl) (Fermentas) was added to sample reaction. The cycling parameters outlined in the following table
Segment Cycles Temperature Time
1 1 95°C 30 seconds
24
55°C 1 mintute
68°C 2 minutes/kb of plasmid length
1 µl of the Dpn I restriction enzyme (10 u/µl) (BioLabs) was added after the cycles. Gently and thoroughly mix each reaction, spin down in a microcentrifuge for 1 minute, and immediately incubate at 37°C for 1 hour to digest the parental supercoiled dsDNA. 1 µl of the Dpn I-treated DNA was transfected into One Shot® TOP10 Chemically Competent E. coli as described previously in 3.2.10 and verified by sequencing.
3.2.12 Agarose gel electrophoresis
To validate the specificity of PCR products, gel analysis was performed. A 2% gel (3 g agarose powder dissolved in 150 mL 1 × TAE buffer) was used. For each sample analyzed, 10 μL PCR product, 5 μL 2 × loading dye and 1.5 μL 10 × Midori Green (NIPPON Genetics EUROPE GmbH) were loaded into the gel. 5 μL DNA ladder (100bp) was then loaded alongside the samples. The gel was run at 110 V for 1 h. The presence of only 1 band in each lane supported the specificity of the reaction.
3.2.13 Gel purification
The QIAquick Gel extraction kit (QIAGEN) was used for this application. Gel slices containing the desired fragment were cut with a scalpel under UV light, transferred to an eppendorf tube and weighed. The gel was dissolved by heating the slice in 3 equivalent volumes (gel) of QG buffer for 10 minutes (or longer if dissolution was not achieved) at 50oC.
One volume of the gel mass of isoproponal was added to the mixture, mixed properly, transferred into a QIAquick column and centrifuged for 1min at 13000 rpm. The flow-through was discarded and 500 µl of buffer QG was added to the column and centrifuged for 1 min at 13000 rpm to remove the remaining traces of gel from the sample. Subsequently, 750 µl buffer PE was used to wash the column, which was centrifuged for an additional 1 min to remove the traces of the buffer. In between the steps the flow-through was discarded. The column was transferred into a fresh 1.5 ml eppendorf and the DNA eluted in 30 µl of elution buffer (EB). The eluate was quantified using the Nanodrop spectrophotometer and used directly or stored at -20oC until required.
25 3.2.14 Purification of PCR products
The Qiaquick® PCR Purification Kit (QIAGEN) was used for this application. 5 volumes of Buffer PB were added to 1 volume of the PCR sample and mixed. The sample was applied to the QIAquick column and centrifuged for 30–60s. The flow-through was discarded. 0.75 ml Buffer PE was added to the QIAquick column and centrifuged for 30–60s. The flow-through was discarded and the QIAquick column placed back in the same tube. The column was centrifuged for an additional 1 min. Place QIAquick column. To elute DNA, 30 µl Buffer EB (10 mM Tris·Cl, pH 8.5) or water (pH 7.0–8.5) was added to the center of the QIAquick membrane placed in a clean 1.5 ml microcentrifuge tube, let to stand for 1 min, and then centrifuged for 1 min. The products were stored at -20°C. The concentration of DNA was measured with NanoDrop™ 2000 Spectrophotometer (ThermoFisher).
3.2.15 Western Blot
Cells were washed by PBS and added ice-cold RIPA buffer (200µl per well). Plates were kept on ice for 15 min. The cells were scraped into microfuge tubes and then spun at 12,000×g for 20 min at 40C. The supernatant was transferred to fresh tubes and a small volume removed (10µl) to perform a BCA protein assay. 30-60µg of each sample was mixed with a quarter volume of 4× Laemmli sample buffer. Protein lysates were boiled at 95℃ for 5 min and then centrifuged for 1 min.
Western Blot was used for the detection of RIMS1 and RABL6 proteins. The samples were loaded into 10% SDS-PAGE gels. The gel was run for about one and half hour at 100 V. The transfer sandwich was assembled avoiding bubbles. The PVDF blot was on the cathode and the gel on the anode. The cassettes were placed in the transfer tank and the tank placed in an icebox. Since RIMS1 protein is bigger than 150KD, the transfer was run for 150-180 min at 100 V. The blots were stained with Ponceau S solution to check the transfer quality and then washed with TBST. The blots were then blocked in 5% non-fat milk at room temperature for 1 hour followed by overnight incubation in a primary antibody solution at 4℃. The blots were rinsed 3 times with TBST and incubated in the secondary antibody for 1 hour at room temperature. The blots were rinsed 3 times again after which ECL substrate was applied to the blots. Then move into a dark room with a safe light, place covered membrane in a film cassette with protein side facing up. Place X-ray film on top of membrane, and expose for 1 minute. Exposure time can be increased to achieve optimal results, with light emission being most intense immediately after substrate incubation and significantly decreasing within 1
26
hour. For probing the beta actin protein control, stripping buffer was added to the same blots for 15 min at room temperature and then incubated them in beta actin primary antibody overnight. The rest of the protocol is the same as described above.
3.2.16 Reporter Gene (Luciferase) Assay
Luciferase assay was used for confirming the effect of miR-122 on the selected target gene 3’UTRs. We plated 2×10⁴
293T cells or colorectal cancer cells in quadruplicate in a 96-well plate with 200µl complete medium. The next day the cells were rinsed by PBS and transfected with either miR-122 mimic or negative control miRNA together with six different plasmids respectively in serum free medium (SFM) using METAFECTENE® (Biontex) transfection reagent. All miRNA mimics, inhibitors and corresponding negative controls were purchased from Ambion. Each well was transfected with 50nM miRNA or control miRNA, 100ng of 3’ UTR plasmid construct and 20ng of Firefly luciferase vector. 24 hours after the transfection, the cells were washed with PBS. After complete aspiration of the PBS, the Dual-Luciferase® Reporter Assay System from Pro mega was used as follows: 20µl of 1×passive lysis buffer was added to each well and the plate was placed on rotary shaker for 15 min at room temperature. Subsequently, 50µl of LAR was added and the Firefly luciferase activity was measured luciferase activity on the Infinite M200 Microplate reader (Tecan) machine. Then 50µl of freshly constituted Stop & glo added and the Renilla luciferase activity was measured. The luciferase activity (Renilla/Firefly) in each well for each given UTR was calculated and the relative luciferase activity was obtained by normalizing to the corresponding control.
3.2.17 Exosome isolation
The exoEasy Maxi Kit was used for purifying exosomes from up to 16 ml of cell culture supernatant. Huh7 was cultured in normal DMEM media to 60-70% confluency. The cells were washed by PBS and serum free DMEM media was added. 2 days later, the media was collected and centrifuged for 30 min. 1 volume buffer XBP (from the kit) was added to 1 volume of supernatant. The combination was mixed by gently inverting the tube 5 times. The sample/XBP mix was then added onto the exoEasy spin column and centrifuged at 500 x g for 1 min. The flow-through was then discarded followed by the addition of 10 ml of buffer XWP and centrifugation at 5000 x g for 5 min. After discarding the flow-through, the spin column was transferred to a fresh collection tube. 400 μl Buffer XE was added to the membrane and allowed to sit for 1 min. The column was then centrifuged at 500 x g for 5 min to collect the eluate. The eluate was re-applied to the exoEasy spin column membrane and allowed to sit for
27
1 min and centrifuged again at 5000 x g for 5 min to collect the eluate. The exosome containing eluate was stored at -20℃.
The exoRNeasy Serum/Plasma Starter Kit was used for purification of total exosome-derived RNA. After the addition of 1 volume Buffer XBP to 1 volume of the supernatant and mixing as described earlier, the sample/Buffer XBP mix was added onto the exoEasy spin column and centrifuged for 1 min at 500 x g. The flow-through was discarded followed by the addition of 10 ml Buffer XWP and centrifugation for 5 min at 5000 x g to wash the column. The flow-through was discarded and the spin column transferred to a fresh collection tube. 700 µl QIAzol reagent was added to the membrane and spun for 5 min at 5000 x g to collect the lysate which was transferred to a new microfuge tube. This tube was briefly vortexed and incubated at room temperature (15–25°C) for 5 min after which 90µl chloroform was added and shaken vigorously for 15 s. After 2–3 min of incubation, the tube was centrifuged at 12,000 x g and 4°C for 15 min. The upper aqueous phase was transferred to a new collection tube. 2 volumes of 100% ethanol were added and mixed thoroughly by pipetting. The sample was transferred to an RNeasy MinElute spin column and RNA was isolated as described above. The concentration of RNA was measured by NanoDrop™ 2000 Spectrophotometer (ThermoFisher).
3.2.18 Cell proliferation assay
Cell proliferation was determined with CellTiter 96® AQueous One Solution Reagent which contained a novel tetrazolium compound [3-(4, 5-dimethylthiazol-2-yl)-5-(3-carboxymethoxyphenyl)-2-(4-sulfophenyl)-2H-tetrazolium, inner salt; MTS (a)] and an electron coupling reagent (phenazine ethosulfate; PES). RKO, HCT116 and DLD1 cell lines were transfected with miRNA mimics, inhibitors or corresponding controls. 24 hours later, Cells were seeded in 96-well plates at a density of 2 × 10³ cells/well in a total volume of 100 μl of medium with 10% FBS. Six replicates were made for each condition and each evaluated time point. 20 ul of CellTiter 96 was added to each well and the absorbance was measured using a microplate reader (TECAN Trading AG, Switzerland) at 490 nm over a period of 96 - 120 hours.
3.2.19 Colony formation assay
RKO and HCT116 cells were transected with miRNA mimics, inhibitors or their corresponding controls. 16–18 hrs after transfection, cells were trypsinized and re-seeded at a
28
density of 400–600 cells/well in a 6 well plate and maintained in their corresponding media containing 10% FBS at 37 °C. After 7-10 days, the colonies could be watched by eyes. Then the cells were fixed with methanol and stained with 0.1% crystal violet for 15 min. The ensuing colonies were scanned and counted by ImageJ.
3.2.20 Cell cycle assay
The cell cycle was assessed using the propidium iodide assay followed by flow cytometric analysis. RKO, HCT116 and DLD1 Cells RKO and HCT116 cells were transected with miRNA mimics, inhibitors or their corresponding controls. Cells were trypsinized 48h after transfection, washed with PBS, fixed in 1 ml cold 70% ethanol (1× 10⁶ per ml), and incubated at -30 °C for at least 1 hour. Next cells were washed with 10ml PBS again, resuspended in 1ml PBS, added RNase (final concentration 50 μg/ml) and incubated 30 minutes at 37 °C in the dark. Then cells were stained with propidium iodide (50 μg/ml) (Sigma-Aldrich Corp. Saint Louis, MO, USA) and analyzed by Fluorescence-activated cell sorting (FACS). The data obtained were analyzed using the FlowJo v10 software.
3.2.21 Statistical Methods
The differences between groups were statistically analyzed using two tailed unpaired and paired t–tests when dealing with independent (cell lines, before/after treatment) and dependent (tumor/normal patient) variables respectively. All experiments were carried out at least in triplicate and at least in three independent attempts. Calculations were made using Microsoft Excel. Data were considered to be statistically significant when p < 0.05 and represented graphically as p < 0.05 (*) and p < 0.01 (**).
29
4
RESULTS
4.1 Metastasis associated genes are predicted targets of miR-122
We used a combination of methods to explore putative novel oncogenic target mRNAs for miR-122. In the first approach, we looked for targets of miR-122 that had in one way or the other being implicated in metastasis. Through this function-based approach, RIMS1 and
RABL6/C9orf86 were identified as the most significant hits. In the second approach, we pooled all of the predicted targets and put them into a pathway analysis tool. Using the Ingenuity Pathway Analysis (IPA) package, we identified and selected the Integrin pathway, which featured prominently in the output of significant pathways. The integrin pathway plays important roles in cancer invasion and metastases. The miR-122 targets in this pathway were
ABL1, GIT1, GRB7, and ITGAL. The alignments of these 6 genes with miR-122 are shown in
30 Figure 5. The alignments of these 6 genes with miR-122.
Retrieved from: http://www.microrna.org
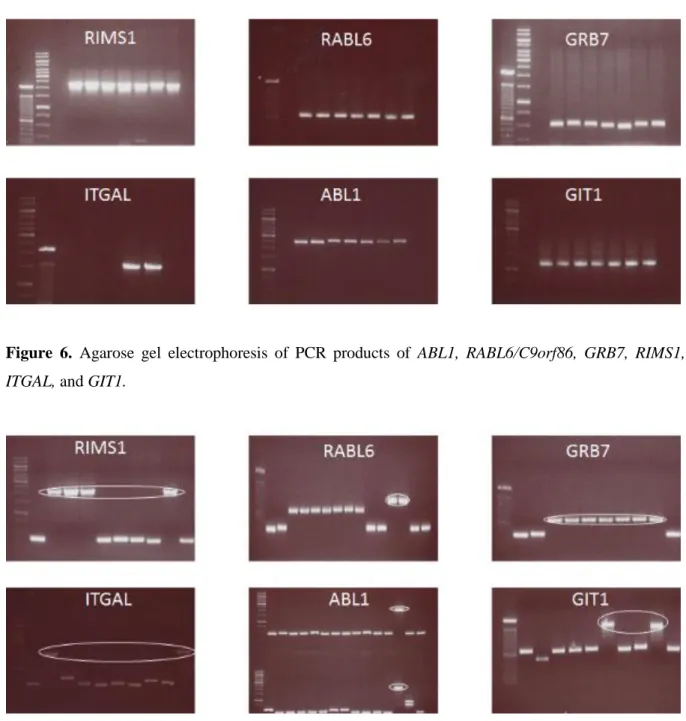
4.2 Amplification and cloning of 3’ UTRs in pLightSwitch 3’ UTR Vector
To determine if these 6 genes were direct targets of miR-122, we first of all amplified the 3’ UTRs of RIMS1, RABL6/C9orf86, ABL1, GIT1, GRB7, and ITGAL from the genomic DNA of the human embryonic kidney 293T cell lines with PCR. The amplified fragments were
31
resolved on an agarose gel to find out if the correct fragment size(s) had been amplified (Figure 6). After digestion of the fragments with NheI and XhoI and ligation in the pLightSwitch 3’UTR plasmid, several colonies were picked and a colony PCR was done with pLightSwitch specific primers to identify the clones with the correct size of insert and orientation (Figure 7). The clones containing the right size of insert were Sanger-sequenced to confirm the insert.
Figure 6. Agarose gel electrophoresis of PCR products of ABL1, RABL6/C9orf86, GRB7, RIMS1,
ITGAL, and GIT1.
Figure 7. Agarose gel electrophoresis of colony PCR for the identification of potentially correct clones.
32 4.3 3’ UTR Reporter gene assay identifies RABL6 and RIMS1 as significantly suppressed targets
The cloned plasmids of all 6 3’UTRs were subjected to a reporter gene assay in 293T, RKO, SW480 and HT1080 cells transfected with a miR-122 mimic or corresponding control. Of the 6 mRNAs, those of RIMS1 and RABL6 showed the most significant suppression in the presence of miR-122. Compared with the control miRNA, miR-122 significantly decreased the luciferase activity by 70.7 % in 3’ UTR of RIMS1 and 61.7% in RABL6 in 293T cells, which means miR-122 interacts with the 3′ UTR of RIMS1 and RABL6 (Figure 8). Similar results were obtained with RKO, SW480 and HT1080 cells. GRB7 showed some mild suppression, but no suppression was seen with GIT1, ABL1 and ITGAL (Figure 8).
Figure 8. 3’ UTR relative luciferase activity of 6 potential target mRNAs following treatment with miR-122.
4.4 Endogenous expression of miR-122 in colorectal and liver cell lines
In order to determine which cell lines would be best suited for the evaluation of miR-122 function, as well as over-expression and knock-down studies, we screened a panel of colorectal and liver cell lines for the endogenous expression of miR-122. The miR-122
33
expression was generally low in all the colorectal cancer cell lines screened. However, DLD1, SW480 and Caco2 showed the highest relative expression, while HT29, SW48 and SW620 showed the lowest expression levels (Figure 9). Since miR-122 was shown to be highly expressed in hepatocytes, we decided to analyze its expression in two hepatocellular carcinoma cell lines (Huh7 and Hep3B). While the expression of miR-122 was low in Hep3B cells, it was very highly expressed in Huh7 cells (Figure 10).
Figure 9. Cell line screening for the expression of miR-122 in a panel of colorectal cancer cell lines, graph shows expression relative to the RKO cell line after normalization to SNO68.
34 Figure 10. Cell line screening for the expression of miR-122 in colorectal cancer cell lines and 2 hepatocarcinoma cell lines, graph shows expression relative to the RKO cell line after normalization to RNU6.
4.5 miR-122 suppresses mRNA and protein expression of RABL6 and RIMS1
To confirm the effect of miR-122 on the suppression of RIMS1 and RABL6 expression, we transfected RKO, DLD1 and HCT116 cells with miR-122 mimic or corresponding control. On the mRNA level, miR-122 led to a significant decrease of RIMS1 (P = 0.036348821) and also a trend of RABL6 decrease in RKO (Figure 11). Meanwhile there is a significant decrease of RABL6 in DLD1 (P= 0.003768173) although no decrease of RIMS1 (Figure 11). On the protein level by Western Blot, miR-122 also led to a decrease of RABL6 expression (Figure 12). Based on these results, we sought to demonstrate that these two genes are direct targets of miR-122.
35 Figure 11. RIMS1 and RABL6 mRNA expression following transfection with miR-122 in RKO & DLD1 cell lines.
Figure 12. Assessment of RABL6 protein expression in RKO, HCT116 and DLD1 cells following transfection with miR-122 mimic, miR-122 inhibitor and oligonucleotides.
4.6 miR-122 is secreted in the conditioned media and exosomes of Huh7 cells
We hypothesized that since the metastatic lesions were in the liver, that miR-122 was acquired by the colorectal cancer cells from the liver parenchymal cells through paracrine activity. To prove this hypothesis, we analyzed the conditioned media of Huh7 cells for miR-122 abundance relative to control serum free media. Additionally, we checked to see if any extra-cellular miR-122 was present in the exosomal fraction of the conditioned media. RNAs were purified from conditioned media (no FBS DMEM media) of Huh7 cells as previously
36
described. From 16 ml media, the RNA concentration was about 150ng/μl compared to 0ng/μl in fresh media. Real-time PCR was used to amplify miR-122 in total exosomes (Figure 13).
Figure 13. The expression of miR-122 in exosomes extracted from conditioned media of Huh7 cells.
4.7 Huh7 Liver cancer cells are able to transfer miR-122 to colorectal cancer cells in co-culture, through conditioned media and exosomes
After confirming that miR-122 was secreted into the conditioned media and was present in exosomes, we proceeded to find out if these miRs could be taken up by colorectal cancer cells, in a situation similar to what we had observed in the patient samples. Towards this end, Huh7 cells were cultured with RKO cells (Huh7 cells were plated 2 days before RKO cells as described in 2.2.2). After 3-5 days of co-culture, total RNA from RKO cells in the top well was collected and real-time PCR was performed to measure miR-122 expression. From the third day, we observed an increase of miR-122 expression in RKO cells. Moreover, this expression was still significantly enhanced on the fourth day and fifth day relative to control cells (Figure 14), which means RKO cells could take up miR-122 secreted from Huh7 cells.
To further confirm that this transfer was from exosomes, we directly added the exosomes extracted from conditioned media of Huh7 into normal medium of RKO and HCT116 cells,
37
using the buffer for exosomes in the kit as the negative control. The miR-122 expression was significantly upregulated in RKO however only a slightly upregulated in HCT116 (Figure 15).
Figure 14. The expression of miR-122 in the RKO cell line co-cultured with the Huh7 cell line after 3 days, 4 days and 5 days.
Figure 15. The expression of miR-122 in RKO & HCT116 cells treated with exosomes extracted from Huh7 conditioned media. Exosome elution buffer was used as a negative control.
4.8 Liver cell exosomes mediate suppression of target genes in colorectal cancer cell lines
To further confirm if RIMS1 and RABL6 could be targeted by miR-122 from exosomes, we directly added exosomes extracted from conditioned media of Huh7 into normal medium of
38
RKO, HCT116 and DLD1 cells, and the exosome elution buffer as a negative control. On the mRNA level, miR-122 led to a significant decrease of RIMS1 in all three cell lines and a significant decrease of RABL6 in RKO and DLD1 cells. Moreover, we also observed a trend of decreased expression of RABL6 in HCT116 (Figure 16).
Figure 16. RIMS1 and RABL6 mRNA expression in RKO, HCT116 & DLD1 cell lines following treatment with exosomes extracted from Huh7 cell conditioned media. Exosome elution buffer was used as a negative control.
4.9Cell cycle genes are downstream effectors of RABL6 and are suppressed by miR-122
Since RIMS1 and RABL6 expression could be suppressed by miR-122 in colorectal cancer cell lines, we tried to assess the effects of miR-122 not only on its direct targets, but also on related signaling molecules. Although there are few reports about RIMS1, the cumulative data suggests that RABL6 might be an important regulator for cell proliferation and G1-S transition (Hagen et al., 2014; Tang et al., 2016). We also found miR-122 upregulated cyclin-dependent kinase inhibitor 1A (CDKN1A, P21) expression in both RKO and HCT116 cell lines (Figure 17), which is a classical cell cycle checkpoint inhibitor protein. These results suggest that miR-122 induced suppression of RABL6 caused P21 upregulation.
39 Figure 17. Assessment of P21 protein expression in RKO and HCT116 cells following transfection with miR-122 mimic, miR-122 inhibitor and oligonucleotides.
4.10 Targeting of RIMS1 and RABL6 suppresses tumor cell proliferation and colony formation
To explore the function of RIMS1 and RABL6, RKO, HCT116 and DLD1 cells transfected by miR-122 and its inhibitor were subjected to cell proliferation and colony formation assays. The cell proliferation assay was evaluated over a 4 or 5-day time period. Although there was no significant difference in RKO cells, we observed a significant decrease in cell proliferation in HCT116 and DLD1 cells in which miR-122 had been over-expressed, and a corresponding increase in HCT116 cell with miR-122 inhibitor (Figure 18). Additionally, RKO, HCT116 and DLD1 cells transfected by miR-122 and its inhibitor were analyzed by flow cytometry. We observed that a slightly higher amount of cells transfected with miR-122 arrested in the G0/G1 phase comparing to controls nearly in all cell lines at both 48h and 72h except in HCT116 at 72h (Figure 19). These results suggested a potential role for miR-122 in regulating the G1/S transition by targeting RABL6 and regulating P21.
Similarly, colony formation assays showed significantly fewer colonies with the transfection of miR-122 mimics compared to controls in both RKO and HCT116 cells (Figure 20). The converse was observed with the miRNA inhibitors. This result further supports miR-122 as an inhibitor of cell proliferation by suppressing RABL6 expression.
40 Figure 18. Cellular growth curves of RKO, HCT-116 and DLD1 cell lines at 24 hours following transfection with miR-122 mimic, miR-122 inhibitor or control oligonucleotides.
0 0,2 0,4 0,6 0,8 1 1,2 1,4 1,6 0h 24h 48h 72h 96h 120h L um ines ce nce (RL U)
HCT116
Control miR-122 miR-122 inhibitor 0 0,2 0,4 0,6 0,8 1 1,2 0h 24h 48h 72h 96h L umi nesc ence ( R L U )RKO
Control miR-122 miR-122 inhibitor 0 0,2 0,4 0,6 0,8 1 1,2 1,4 1,6 0h 24h 48h 72h 96h 120h L u m in escen ce ( R L U)DLD1
Control miR-122 miR-122 inhibitor41
Figure 19 (A). Cell cycle analysis of RKO, HCT116 and DLD1 cells transfected with miR-122
mimics, inhibitors or corresponding controls. The graph shows the relative percentages of cells in the 0% 10% 20% 30% 40% 50% 60% 70% 80% 90% 100%
Control miR-122 miR-122 inhibitor
Control miR-122 miR-122 inhibitor % c ell cy cle d is tr ib u tio n 48h 72h
RKO
G2/M S G0/G1 0% 10% 20% 30% 40% 50% 60% 70% 80% 90% 100%Control miR-122 miR-122 inhibitor
Control miR-122 miR-122 inhibitor % c ell cy cle d is tr ib u tio n 48h 72h
HCT116
G2/M S G0/G1 0% 10% 20% 30% 40% 50% 60% 70% 80% 90% 100%Control miR-122 miR-122 inhibitor
Control miR-122 miR-122 inhibitor % c ell cy cle d is tr ib u tio n 48h 72h
DLD1
G2/M S G0/G1 A42 different phases of the cell cycle (G0/G1 vs S vs G2/M) and how these are affected by miR-122 mimic and inhibitor treatment.
Control miR-122 miR-122 inhibitor
48h %G0/G1 RKO 55.4% 56.2% 47.6% %G0/G1 HCT116 50.2% 54.6% 51.6% %G0/G1 DLD1 57.6% 67.2% 65.1% 72h %G0/G1 RKO 48.8% 51.6% 63.3% %G0/G1 HCT116 58.6% 58.2% 62.9% %G0/G1 DLD1 59.6% 65.5% 57.7%
Figure 19 (B). Tabular representation of the cell cycle analysis in RKO, HCT116 and DLD1 cells transfected with miR-122 mimics, inhibitors or corresponding controls. The percentage of cells in G0/G1 phase is increased by the miR-122 mimic.
43 Figure 20. Colony formation assays performed with RKO and HCT116 cells. The cell lines were treated with miR-122 mimics, inhibitors or corresponding controls. (a) Representative examples of the scanned plates. (b) Overall quantification of the colonies conducted in ImageJ. Details are as described in the Materials and Methods.
4.11 Targeting of RIMS1 and RABL6 might not affect tumor cell migration and invasion
Since RABL6 and P21 were identified as important regulators for cell proliferation and G1-S transition, we also wanted to know if they could affect tumor cell migration or invasion. RKO, HCT116 and DLD1 cells transfected by miR-122 and its inhibitor were subjected to cell migration or invasion assays. Unfortunately, there was only one significant case of DLD1
a
44
cells enhancing invasion following miR-122 inhibitor transfection (Figure 21). There was no significant difference in other cells.
Figure 21. Invasion and migration assays in DLD1, HCT116 and RKO cells transfected with miR-122 mimics, inhibitors or corresponding controls.
45
5
DISCUSSION
Metastasis continues to be the major factor impacting prognosis and survival of colorectal cancer patients. Metastasis itself is not a single process but rather, a constellation of multiple events that culminate with the colonization of distant sites by the primary tumor. A number of published reports seem to indicate that the events playing in different metastatic sites are not identical and every metastatic niche is inherently different. In colorectal cancer, as well as several other solid tumors, the liver is a common site for metastasis. Decrypting novel molecular regulators modulating CRC metastasis will help to further understand CRC biology, and may provide potentially efficient targets for CRC therapy.
The adaptation of tumor cells to a foreign microenvironment is critical to successful metastatic colonization (McGowan, Kirstein, & Chambers, 2009; Peinado, Lavotshkin, & Lyden, 2011; Talmadge & Fidler, 2010). This has been described as a highly inefficient process with circulating tumor cells trying to overcome many obstacles to colonize distant organs. These events include infiltrating distant tissue, evading immune defenses, adapting to supportive niches, surviving as latent tumor-initiating seeds and eventually breaking out to replace the host tissue (Massague & Obenauf, 2016). Despite immune defenses, there are some supportive niches that cancer cells can benefit from. Evidence exists that primary tumors can send systemic signals to influence the microenvironment of distant organs by creating pre-metastatic niches before the arrival of cancer cells (McAllister & Weinberg, 2014).
After colonization, most metastasized cells enter a state of dormancy, of which two modes have been described. Tumor mass dormancy, in which micrometastases stop growing because of insufficient vascularization or constant culling by immune defenses; and cellular dormancy, where isolated disseminated tumor cells enter a proliferative quiescence state (Sosa, Bragado, & Aguirre-Ghiso, 2014). Which of the two modes is more frequent is uncertain (Strauss & Thomas, 2010), but it has been postulated that DTCs might enter the cell cycle intermittently, and undergo rapid elimination by the immune system. But in the end, some progeny will evolve the ability to escape immune defenses and develop overt metastatic lesions. There is increasing evidence suggesting that microRNAs are major players in all the steps of the metastasis cascade.
46 miRNAs are important metastasis molecules
In an effort to better understand the molecular events at play in colorectal cancer liver metastasis, Prof. Allgayer’s department sequenced the whole genomes of 12 patients with advanced colorectal cancer. Other studies have also compared different primary tumors with their corresponding metastasis in the search for molecular mediators of metastasis, but in most cases looking for specific miRNAs or sequences. In some these studies, the pattern of some miRNA expression could distinguish primary tumors from their corresponding metastases, confirming a direct involvement of miRNAs in cancer metastasis, e.g. miR-10b, miR-21, miR-30a, miR-30e, miR-125b, miR-141, miR-200b, miR-200c, and miR-205 (Baffa et al., 2009). In several studies, including work of the Allgayer team, a number of miRNAs were found to participate in different processes of metastasis by modulating the expression of genes involved in metastasis-related pathways and signaling networks, such as the phosphatase and tensin homolog (PTEN)/phosphatidylinositol-3-kinase (PI3K), EGF receptor (EGFR), TGFβ, and p53 pathways (Fish et al., 2008). In a further example, the loss of miR-200c expression was found to induce an aggressive, invasive, and chemoresistant phenotype by repressing E-cadherin in non-small lung cancer (Ceppi et al., 2010).
Interestingly, increasingly more key signaling pathways implicated in metastatic colon cancer that are targeted by microRNAs, are being identified. For instance, EGFR, a receptor tyrosine kinase (RTK) has been shown to involved in CRC progression and metastasis, and a handful of anti-EGFR agents, including tyrosine kinase inhibitors (TKIs) and monoclonal antibodies against EGFR (Giampieri et al., 2013) have been developed. However, most anti-EGFR targeted agents are frequently susceptible to drug-resistance. Increasing evidence has demonstrated that certain miRNAs correlate with drug resistance to anti-EGFR agents, and depending on whether the correlation is positive or negative, inhibitors or mimics can be used. For example, a combination of miR-7 and cetuximab, a monoclonal antibody against EGFR could enhance the growth inhibitory effect as compared to each agent alone (Suto et al., 2015). A miRNA profiling analysis in metastatic colorectal cancer (mCRC) patients treated with anti-EGFR monoclonal antibodies identified the let-7c/miR-99a/miR-125b miRNA cluster as a signature associated with an outcome different from that of anti-EGFR therapies, and this miRNA cluster may be used for the selection of patients with KRAS wild-type mCRC as good candidates for antiEGFR therapy (Cappuzzo et al., 2014). Moreover, miRs134 and