Energy Procedia 16 (2012) 673 – 678
1876-6102 © 2011 Published by Elsevier B.V. Selection and/or peer-review under responsibility of International Materials Science Society . doi:10.1016/j.egypro.2012.01.109
Energy
Procedia
Energy Procedia 00 (2011) 000–000
www.elsevier.com/locate/procedia
2012 International Conference on Future Energy, Environment, and Materials
Comparative Analysis of Energy Efficiency in
Air-conditioning System with GSHP, Electricity-driven
Refrigerating Unit and Direct-fired Li-Br Absorption
Refrigerating and Heating Unit
Siyu Zhou, Jing zhao
*
School of Environment Science and Engineering, No.92 Weiing Road,Tianjin University, Tianjin 300072, China
Abstract
Ground-source heat pump (GSHP) is a renewable energy technology with the advantages of energy saving and environmental friendliness. This paper focuses on the energy efficiency of air-conditioning systems in public buildings in Tianjin. Three public buildings are chosen as case studies with different forms of cold & heat sources. A building with ground-source heat pump for heating and cooling, a building with electricity-driven refrigerating unit for cooling and centralized heat-supply network for heating, a building with direct-fired Li-Br absorption refrigerating and heating unit for heating and cooling are selected. Attempt is made to analyze the actual operating performance of air-conditioning system and evaluate the system energy efficiency in different buildings. The results show that ground-source heat pump air-conditioning system without adequate design and management is not always better than other traditional air-conditioning systems.
© 2011 Published by Elsevier Ltd. Selection and/or peer-review under responsibility of [name organizer] Keywords: renewable energy; ground-source heat pump; air-conditioning system; energy saving; evaluation
1. Introduction
With the rapid development of China′s economy, a great deal of clean energy is needed urgently. One of the feasible measures to solve the problem is promoting the utilization of renewable energy in public
* Corresponding author. Tel.:+86-13821340756. E-mail address: [email protected].
Foundation item: Project (2010DFA72740-06-01) supported by “International Science & Technology Cooperation Program of China”
© 2011 Published by Elsevier B.V. Selection and/or peer-review under responsibility of International Materials Science Society. Open access under CC BY-NC-ND license.
buildings. GSHP is an established technology, capable of delivering high efficiency heating and cooling utilizing the immense renewable storage capacity of the ground [1]. A lot of research about the operating performance of GSHP has been done. Xinshu Zhang compares the energy-saving performance of GSHP with the traditional air-conditioning systems [2]. In China, large public buildings are the major energy consumers. According to the statistics, the electricity consumption in unit area of large public buildings is 70~300 kWh per year, which is 10~20 times more than residential buildings [3]. The application of GSHP in public buildings may provide an effective and convenient way for energy saving.
Direct-fired Li-Br absorption refrigerating and heating unit, electricity-driven refrigerating unit and GSHP have wide range of applications in public buildings nowadays. This paper chooses three public buildings with the cold & heat sources mentioned above in Tianjin for case studies. The actual operating performance of different air-conditioning systems is evaluated. Then a detailed comparative analysis about the energy efficiency of air-conditioning systems in three buildings is made.
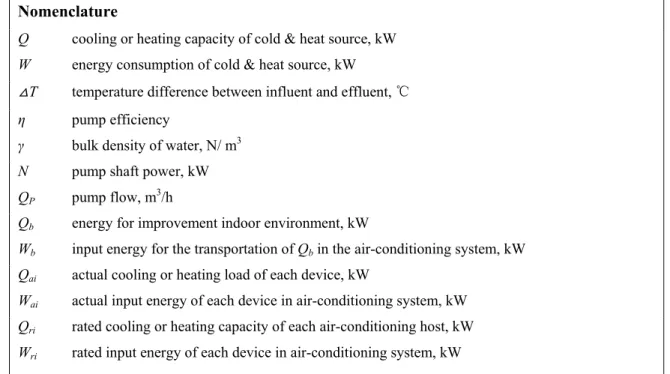
Nomenclature
Q cooling or heating capacity of cold & heat source, kW
W energy consumption of cold & heat source, kW △T temperature difference between influent and effluent, ℃
η pump efficiency
γ bulk density of water, N/ m3
N pump shaft power, kW
QP pump flow, m3/h
Qb energy for improvement indoor environment, kW
Wb input energy for the transportation of Qb in the air-conditioning system, kW
Qai actual cooling or heating load of each device, kW
Wai actual input energy of each device in air-conditioning system, kW
Qri rated cooling or heating capacity of each air-conditioning host, kW
Wri rated input energy of each device in air-conditioning system, kW
2. Basic information
All of the three chosen public buildings are located in Tianjin. The basic information of three buildings is listed in Table 1.
Table 1. The basic information of three public buildings
Case Building function Building area (m2) Completion time Test date
1 Office, supermarket, restaurant 60000 1998 From July 14th to 25th, 2009
2 Office 41000 1998 From June 9th to 17th, 2009
Temperature test points and flow meters were placed on the influent and effluent of cold & heat sources, chilled water pumps and cooling water pumps. Besides, three-phase current was also measured to estimate the actual power of main facilities in different air-conditioning systems. The actual natural gas consumption of direct-fired units in case 2 was obtained by the on-site metering device. The performance parameters of major equipments in three cases are listed in Table 2.
Table 2. The main facilities of three air-conditioning systems
System Operating facilities Standard and type Number
1 Refrigerating unit 1 Cooling capacity: 2812kW, Power: 505kW 1
Refrigerating unit 2 Cooling capacity: 1688kW, Power: 305kW 1 Chilled water pump Flow volume: 310m3/h, Lift: 26.7mH
2O, Power: 30kW 3
Cooling water pump Flow volume: 324m3/h, Lift: 32mH
2O, Power: 36kW 3
Cooling tower Flow volume: 400m3/h, Power: 16kW 3
2 Direct-fired unit Cooling capacity: 1759kW,Natural gas consumption: 101.8m3/h, Power:11kW Heating capacity: 1477kW,Natural gas consumption: 124.2m3/h, Power:11kW 2 Chilled water pump Flow volume: 480m3/h, Lift: 32mH
2O, Power: 55kW 2
Cooling water pump Flow volume: 745m3/h, Lift: 21mH
2O, Power: 55 kW 2
Cooling tower Flow volume: 350m3/h, Power: 11kW 5
3 GSHP Cooling capacity: 901kW, Power: 185.5 kW;
Heating capacity: 996kW, Power: 233kW 1
Load-side pump Flow volume: 160m3/h, Lift: 34mH
2O, Power: 22kW 1
Source-side pump Flow volume: 187m3/h, Lift: 44mH
2O, Power: 37kW 1
3. Measurement and analysis of air-conditioning systems in three cases
3.1. The operating performance of the water systems
The transport energy efficiency ratio (ER) is defined by the following formula [4].
ER=0.002342H / (η△T) (1) η is defined as [5]:
η = γQPH / 3600000N (2)
Table 3. Pump efficiency and ER of chilled water pumps
Facilities QP (m3/h) H (mH2O) △T (℃) N (kW) Pump efficiency ER
Chilled pump 1 in system 1 184.2 30 5.9 24.0 62.7% 0.0190
Chilled pump 2 in system 1 153.9 31 5.9 20.9 62.1% 0.0198
Chilled pump 3 in system 1 144.4 31 5.9 20.4 59.7% 0.0206
Chilled pump 1 in system 2 365 36.2 2.7 50.4 71.4% 0.0440
Chilled pump 2 in system 2 374 37.1 2.7 53.2 71.0% 0.0453
The ER of chilled water pumps are shown in Table 3. The ER of air-conditioning water system can not exceed 0.0241 according to the standard [4]. However, the ER of system 2 and system 3 are larger than the value recommended in the standard, indicating the inefficiency of transportation and distribution system. The main reasons are twofold:
• The small temperature difference between influent and effluent, caused by the excessive installed capacity of water pumps and the decline of heat transfer effect in the air-conditioning hosts, should be responsible for the inefficient operation.
• After the long-term use, the internal surface of pumps and pipelines is rusty without necessary maintenance. With the increasing of network resistance, the actual operating conditions of pumps deviate from the optimal operating point, resulting in the decline of energy efficiency.
Variable-frequency regulating devices, automatically changes the flow of pumps according to the temperature difference of influent and effluent in the air-conditioning host, needs to be applied so that the operating conditions of water pumps can adapt to the actual cooling or heating load.
3.2. The operating performance of cold & heat sources
An important index to estimate the efficiency of cold & heat source is COP, which is expressed as follow [6]:
COP=Q / W (3)
As the temperature difference of influent and effluent, the flow of chilled water and three-phase current were measured, the cooling or heating capacity and the energy consumption of main facilities in the air-conditioning systems were obtained. Table 4 shows the COP of different cold & heat sources. 1m3 natural
gas is converted into 3.01 kWh in Table 4 [7]. Table 4. COP of cold & heat source
Facilities Actual cooling or heating capacity Actual energy consumption Load rate COP
Refrigerating units 1 2278kW Power: 441 kW 0.81 5.17
Refrigerating units 2 979kW Power: 211kW 0.58 4.64
Direct-fired unit 1 1128kW Power: 11kW, natural gas: 73.7m3/h 0.64 4.85 Direct-fired unit 2 1195kW Power: 11kW, natural gas: 76.2m3/h 0.68 4.97
GSHP 556kW Power: 146kW 0.56 3.81
It is clear that the COP of refrigerating units and direct-fired units is higher than that of GSHP, which indicates GSHP can not make full use of energy-saving advantages in some condition. The reasons can be explained as follow:
• The refrigerating units in system 1 and the direct-fired units in system 2 have much larger installed capacity than the GSHP in system 3. If the installed capacity is larger, the efficiency of air-conditioning host is usually higher.
• The load rate of system 3 is lower than that of system 1 and 2. GSHP always operates ineffectively with low load rate. Besides, the GSHP and water pumps in system 3 do not match well, resulting in the great increasing of electricity consumption.
• System 1 and 2 were tested in summer while system 3 was tested in winter. The COP of GSHP in the cooling condition is usually higher than that in the heating condition.
3.3. The operating performance of the whole air-conditioning systems
The research on the efficiency of air-conditioning system is mainly based on isolated device. However, the conditioning system is a complex system which is composed of multiple devices. The load of air-conditioning system varies with many factors such as the outdoor parameters. In order to evaluate the operating condition of air-conditioning system and the potential of energy saving, the system coefficient of performance (SCOP) is put forward [8]. By the use of SCOP, the actual operating condition and the optimal operating mode can be analyzed clearly.
SCOP = Qb / Wb = ∑Qai / ∑Wai (4)
The actual input power of each device in the water system was measured and the energy consumption of terminal facilities is estimated as 25% of the total energy consumption in the air-conditioning system according to the relevant research [9]. The sum of actual cooling or heating load in each device is equal to the actual capacity of cold & heat source which can also be calculated. Table 5 shows the SCOP in three air- conditioning systems.
Table 5. SCOP of different air-conditioning systems
System ∑Qai ( kW) ∑Wai ( kW) SCOP
System 1 3257 1188 2.74
System 2 2323 884 2.63
System 3 556 263 2.11
COP only represents the efficiency of isolated device while SCOP can represent the total efficiency of air-conditioning system. It is clear that system 1 has the highest SCOP and the SCOP of system 3 is lowest of all. It means system 1 has the best energy efficiency evaluated from the view of the whole air-conditioning system.
RSCOP means the rated system coefficient of performance. Without doubt, RSCOP shows the efficiency of air-conditioning system in design condition. It is define as [8]:
RSCOP = ∑Qri / ∑Wri (5)
Table 6. RSCOP of different air-conditioning systems
System ∑Qri( kW) ∑Wri( kW) RSCOP
System 1 4500 1408 3.20
System 2 3518 1213 2.90
System 3 996 389 2.56
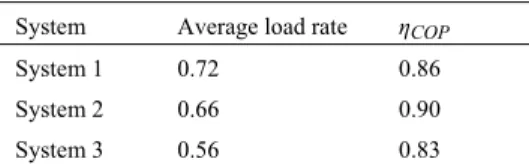
The RSCOP of three air-conditioning systems are shown in Table 6. Table 6 indicates that the design of system 1 is most efficient while system 3 has the lowest design efficiency. In order to reflect the difference between the actual operating efficiency and the design efficiency of air-conditioning system, ηCOP is put forward [8]:
The ηCOP of three air-conditioning systems are shown in Table 7. The ηCOP of system 3 is significantly
lower than that of system 2. It indicates that the actual operating performance of system 2 is close to the design condition. As a result, system 2 has the best operating performance in actual conditions compared with the design performance of air-conditioning system. On the other hand, the actual operating condition of system 3 deviates from the design condition severely. The mismatch of different devices in air-conditioning system and the operation with low load ratio should be responsible for the inefficiency of system 3.
Table 7. ηCOP of different air-conditioning systems
System Average load rate ηCOP
System 1 0.72 0.86
System 2 0.66 0.90
System 3 0.56 0.83
4. Conclusions
By the comparative analysis of three cases with different forms of cold & heat sources, the following conclusions can be drawn:
• As a renewable energy technology used in public buildings widely, ground-source heat pump is unable to fulfill the energy-saving advantages with low load rate. It should be attributed to the unreasonable design and the lack of management and maintenance. Therefore, the temperature difference control system should be adopted in the air-conditioning system. Besides, more attention should be paid to the design of air-conditioning system to meet the actual load.
• The COP of conditioning host can not represent the actual performance of the whole air-conditioning system. The air-air-conditioning system, whose air-air-conditioning host has ideal COP, may be inefficient in the actual operation. The efficiency of the whole air-conditioning system should be evaluated by SCOP and ηCOP.
References
[1] Liu, G.D., Meng, D , Li, X.Q. Study on operation performance and energy-saving character of ground-source heat pump air-conditioning system. 2010 2nd International Conference on Computer Engineering and Technology. Piscataway:IEEE Press; 2010, 676−9.
[2] Zhang, X.S. Analysis of operating performance and simulation prediction of ground-source heat pump unit in public building. University of South China; 2007.
[3] Dai, X.Z., Wu, Y. Government regulation and its innovation for large-scale public building energy efficiency supervision systems under market economy. HV&AC 37 (8); 2007, 2–7.
[4]GB50189-2005, Design standard for energy efficiency of public buildings. Beijing: Building Industry Press; 2005. [5]Cai, Z.J., Long, T.Y. Hydrodynamic pump and fan. China building industry press;1999.
[6] Xue, Z.F. Existing building energy saving. Beijing: Building Industry Press; 2007.
[7] Energy Statistics Division of China Statistics Bureau. China Energy Statistical Yearbook. China Statistics Press; 2011. [8] Du, X.T., Cai, W.J., Lei, J. Air-conditioning system energy efficiency and energy consumption evaluation. Proceedings of the 8th World Congress on Intelligent Control and Automation. Piscataway:IEEE Press; 2010, 1908−1913.
[9] Zhang, Z.X., Li, C.W., Li, N.P. Energy consumption evaluation and energy-saving potential analysis of the HVAC system for an office building in China. Energy conservation technology; 2008, 295-9.