Pri
va
te
ex
pe
nd
itu
re
o
n h
ea
lth
an
d v
olu
nta
ry p
riv
ate
he
alt
h in
su
ra
nc
e
pie
t
ca
lc
oe
n
Private expenditure
on health and voluntary
private
health insurance
Private Expenditure on Health and Voluntary
Private Health Insurance
Private uitgaven voor gezondheidszorg en vrijwillige private ziektekostenverzekering
Proefschrift
ter verkrijging van de graad van doctor aan de Erasmus Universiteit Rotterdam
op gezag van de rector magnificus prof. dr. R.C.M.E. Engels
en volgens besluit van het College voor Promoties. De openbare verdediging zal plaatsvinden op
donderdag 18 oktober 2018 om 15.30 Piet Frans Joris Calcoen geboren te Ieper (België)
Promotoren Prof. dr. W.P.M.M. van de Ven Prof. dr. J. Pacolet
Overige leden Prof. dr. L. Annemans Prof. dr. E. Schokkaert Prof. dr. F.T. Schut
Chapter 1. Introduction 7
Chapter 2. Reliability of OECD Health Statistics 25
Chapter 3. Supplementary physicians’ fees 55
3.1. Extra billing in health care: Prohibit, regulate or laissez-faire? 57 3.2. Supplementary physicians’ fees: A sustainable system? 81
Chapter 4. Access to new health technologies 107
Chapter 5. Regulation of PHI markets 127
Chapter 6. Optimal design of PHI products 151
Chapter 7. Conclusion and discussion 163
Chapter 8. Summary 195
Chapter 9. Samenvatting 203
Chapter 10. Curriculum vitae 211
Ch
ap
te
r 1
Ch
ap
te
r 1
1.1. GEnEral InTrOduCTIOn
In this thesis, we will discuss private expenditure on health and voluntary private health insurance (PHI). The two themes are linked since private expenditure represents the market for PHI. Knowing and understanding private expenditure on health is a prerequi-site for PHI to respond to consumer needs and to improve welfare.
The following issues will be addressed in this thesis: (i) the reliability of OECD Health Statistics; (ii) supplementary physicians’ fees; (iii) access to new health technologies; (iv) the regulation of PHI markets and (v) the optimal design of PHI products.
We will focus on Belgium and neighbouring countries. As regards the regulation of PHI, we will also discuss Slovenia. All these countries are characterised by Bismarckian health care systems and complementary PHI markets. Key figures for these countries are represented in Table 1. The figures for Belgium are quite close to the EU average.
Table 1. Key figures for selected EU countries (2014)
EU Belg ium Fr anc e G er man y Nether lands Slo venia
Public expenditure on healtha 78.74% 77.6% 78.6% 84.6%b 80.6% 71.0%
Out-of-pocket expenditure on healtha 15.34% 17.8% 7.0% 13.0% 12.3% 13.0%
Voluntary private health insurancea 4.85% 4.4% 13.7% 1.5% 5.9% 14.8%
Other financing schemesa 1.07% 0.2% 0.7% 0.9% 1.2% 1.2%
Percentage of total population covered by complementary PHI n.a. 82.2% 95.5% 22.9%c 84.5% 72.8% a: as a share of total expenditure on health
b: including primary (substitutive) private health insurance
c: In Germany, another 10.9% of the population holds primary (substitutive) private health insurance.
Figures adapted from OECD, Health at a Glance: Europe 2016
Within the context of this thesis, we will focus on complementary health insurance. Complementary insurance covers services that are excluded from the statutory benefits package or it may reimburse the costs of statutory user charges and supplementary fees charged by health care providers (Thomson and Mossialos, 2009).1
1 Supplementary insurance is not within the scope of this thesis. Supplementary insurance offers access to health services that are already covered by mandatory basic health insurance but gives subscribers a greater choice of provider and enables them to bypass waiting lists for publicly-financed treatments (Thomson and Mossialos, 2009). Substitutive insurance is also out of scope. Substitutive insurance provides cover for people not eligible for statutory health coverage or for those who are not required to be statutorily covered and can opt into or out of the statutory scheme (Thomson and Mossialos, 2009). Substitutive insurance plays a significant role in Germany, where about 9 million people have subscribed
In the European Union (EU), private expenditure represents -on average- 21 per cent of total expenditure on health (see Table 1).2 Three-quarters of private expenditure or 15 per
cent of total expenditure is financed out-of-pocket.3 Voluntary private health insurance
(PHI) finances only 5 per cent of total health spending in the EU (OECD, 2016).4
Out-of-pocket expenditure on health can negatively affect access to health care. People on low incomes and in poor health are particularly at risk. Households that face difficul-ties paying medical bills may postpone or even forgo the health care they need. In the most recent Belgian Health Interview Survey (2013), 26 per cent of households stated that out-of-pocket expenditure on health is (very) hard to bear (in the lowest and highest income quintile the figures are 50 per cent and 5 per cent respectively). In 2013, 8 per cent of Belgian households had to postpone health care for financial reasons (Demarest, 2015). Chronic diseases have a particularly negative impact on the acces-sibility of health goods and services. 54 per cent of Belgian households with chronically ill members face financial hardship and 46 per cent need to postpone health care for financial reasons (66 per cent postpone dental care, 46 per cent medical specialist care, 44 per cent glasses and 31 per cent medication) (Samana, 2016). Research by a Belgian cancer foundation shows that private health expenses for cancer patients amount to 1,838 EUR (median) during the first year after the initial treatment. 25 per cent pays 2,844 EUR per year or more (Rommel, 2015). Recently, the term ‘cancer poverty’ has come into vogue (Lewis, 2017).
Out-of-pocket expenditure on health comprises both user charges on the statutory benefits package and expenditure on health goods and services that are not covered by mandatory basic health insurance.
to substitutive health insurance. The OECD differentiates between complementary, supplementary and duplicate PHI. According to the OECD definitions, complementary insurance covers any cost sharing left after basic coverage. Supplementary insurance adds additional services and duplicate insurance pro-vides faster access or wider choice to providers. Thomson’s and Mossialos’ definition of complementary insurance is broader than the definition of complementary insurance used by the OECD. In fact, the definition of complementary insurance by Thomson and Mossialos encompasses both complementary and supplementary insurance as defined by the OECD. In this thesis, we use the definitions of Thomson and Mossialos.
2 Total expenditure on health is composed of public and private expenditure. Private expenditure on health includes both out-of-pocket expenditure and expenditure covered by voluntary private health insurance (PHI).
3 Surprisingly, out-of-pocket expenditure in the EU is higher than in the United States, where out-of-pocket expenditure represents 12 per cent of total expenditure on health (OECD, 2017; figure for 2014). 4 Figures for 2014.
Ch
ap
te
r 1
User charges (deductibles, co-insurance [a percentage] and co-payments [a fixed sum]) play a role in preventing the overuse of health care provision. However, these mecha-nisms can also allow the public sector to shift costs onto households. For instance, Thomas, Thomson and Mossialos (2015) find that this has been the case in Slovenia. In contrast to publicly-funded care, out-of-pocket payments depend on the patient’s ability to pay. Therefore, many countries have policies in place to protect categories of the population from excessive out-of-pocket payments. These comprise partial or total exemptions for social aid beneficiaries, senior citizens, or people with chronic diseases or disabilities by capping user charges, either in absolute terms or as a share of income (Paris et al., 2016). However, these policies generally provide protection against the costs of statutory user charges only. Health services and goods that are excluded from the statutory benefits package need to be paid for out-of-pocket by everybody. This is particularly true for certain pharmaceutical drugs, dental treatment and therapeutic appliances such as eyeglasses and hearing aids. Across the EU, pharmaceutical drugs account for 40 per cent of total out-of-pocket expenditure, dental care for 18 per cent and therapeutic appliances for 12 per cent. The remaining 30 per cent is constituted by curative care (OECD, Health at a Glance, 2016).
OECD Health Statistics are a widely used source for detailed information on health ex-penditure. OECD Health Statistics are used to analyse health policy issues over time and in comparison with other countries (Oderkirk, 2013). When analysing private expenditure on health, it is important that these statistics be reliable. Therefore, we will examine the reliability of OECd Health Statistics as far as private expenditure on health is concerned.
All European countries endorse equity of access to health care for all people as an im-portant policy objective. Private expenditure on health has an imim-portant bearing on the following policy issues: (i) free choice of health care provider; (ii) access to better quality of care and (iii) waiting time. The last issue, bypassing waiting lists for publicly-financed treatment, is out of scope. This thesis focuses on Bismarckian health care systems where waiting lists tend to be less of a problem than in Beveridgean national health systems. We will focus on the two first issues: (i) supplementary physicians’ fees buying free choice of physician and (ii) out-of-pocket payments buying access to new health technologies. New health technologies -health goods and services- which are not (yet) reimbursed by basic health insurance are accessible only for patients able and willing to pay out-of-pocket. In Belgium and France, access to certain physicians is similarly only possible for patients able and willing to pay supplementary fees.
When out-of-pocket expenditure represents a significant share of total expenditure on health, welfare can be increased by PHI. However, PHI covers only a relatively small proportion of private spending on health, less than 25 per cent in most EU Member States, except for France (65 per cent), Ireland (41 per cent), Luxembourg (33 per cent), the Netherlands (30 per cent) and Slovenia (51 per cent) (OECD Health Statistics 2017, figures for 2015). It appears that private insurers in Europe are not very successful in converting out-of-pocket expenditure into PHI.
National governments concerned about the accessibility and affordability of PHI tend to impose restrictive regulation on the operation of private health insurance markets. The question is: in how far is restrictive regulation of PHI markets in accordance with Eu free market principles?
PHI can lead to welfare gains if the advantages of health insurance outweigh the disad-vantages. Advantages of health insurance are: (i) the reduction of financial risk for the in-sured and (ii) access to health care that would otherwise be unaffordable. Disadvantages are: (i) loading costs and (ii) moral hazard. Unfortunately, many PHI products currently are suboptimal. The question is: how can the design of PHI products be optimised? In the following sections, we will expand on each of the five above-mentioned issues that will be addressed in this thesis.
1.2. rElIabIlITy Of OECd HEalTH STaTISTICS
Since 2005, OECD, Eurostat and WHO have been jointly collecting expenditure and financing information from OECD and EU countries.
OECD Health Statistics on private and out-of-pocket expenditure on health provide important information for the different stakeholders in the health care system. For policymakers, it is important to know how much and what kind of care is being financed privately, and for determining whether there might be a problem with the accessibility of health care. Data on private and out-of-pocket expenditure are indispensable for health insurers. Basic health insurers need to be able to measure the effect of their reimburse-ment policy, while insurers offering PHI need as detailed information as possible about their potential market, which is made up of privately financed care. Finally, practitioners and patients need comprehensive clarification of the costs to be borne by the patient, since treatment decisions may well be influenced by cost issues.
Ch
ap
te
r 1
The OECD states that it provides ‘accurate, reliable and timely data on health spending that is comparable across OECD countries and over time’ (OECD, 2015). Doubts about the reliability of the OECD data for private expenditure on general hospitals in Belgium have led us to critically examine Belgian official data on private health expenses.
Research questions:
1. In how far are OECD Health Statistics on private expenditure on health for Belgium reli-able?
2. What are the major obstacles to a correct estimation of private expenditure on health?
1.3. SuPPlEmEnTary PHySICIanS’ fEES
A supplementary fee is an extra fee charged by health care providers on top of the tariff agreed upon by the health insurance system.5
Both in Belgium and in France, supplementary physicians’ fees are a ‘hot’ issue. Physi-cians can charge supplementary fees in case of special demands made by the patient (e.g., a late-night consultation). In Belgium, any physician can charge supplementary fees for households whose taxable income exceeds 67,636 EUR per year (figure for 2017). Physicians who choose not to be bound by social security tariffs - ‘sector 2’ and ‘non-conventioned’ physicians in France and Belgium respectively- can charge supplemen-tary fees to all patients in all circumstances. In Belgian hospitals, supplemensupplemen-tary fees can be applied by any physician if the patient is staying in a private room.
Patients who are not willing or not able to pay supplementary fees may not be treated by the physician of their choice.
Table 2 shows that there is a huge span in private expenditure between a private room and a double or common hospital room in Belgium. The span can be explained through supplementary fees and -to a lesser extent- room charges, neither of which may be charged in a double or common room. In 2015, supplementary fees represented 61 per cent of private expenditure for a classic hospital stay in a private room (Mutualité Chrétienne, 2016).
5 In Belgium, the terms ‘ereloonsupplement’ (Dutch) and ‘supplément d’honoraires’ (French) are used for a fee charged on top of the official tariff set by the social security system. In France, the term ‘dépassement d’honoraires’ is applied. In North America, the terms ‘extra billing’ and ‘balance billing’ are used.
Table 2. Average private expenditure for an admission in a Belgian hospital (EUR, 2015) (Source: Mutualité Chrétienne, 2016)
Private room Double or common room Classic hospital stay (min. 1 night) 1463 278
Surgical one-day clinic 735 122 Non-surgical one-day clinic 437 25
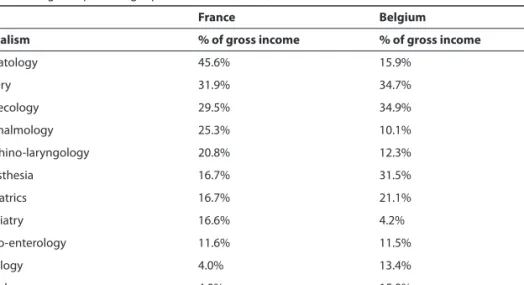
For certain categories of self-employed medical specialists, supplementary fees consti-tute a substantial part of their income (see Table 3). Supplementary fees represent -on average- respectively 35 per cent and 32 per cent of the gross income of Belgian and French surgeons in hospitals.6
Table 3. Supplementary fees as a percentage of gross income of sector 2 physicians (France)/self-employed physicians (Belgium) providing inpatient care in 2010 (DREES, 2012; Swartenbroekx, 2012).
france belgium
Specialism % of gross income % of gross income
Stomatology 45.6% 15.9% Surgery 31.9% 34.7% Gynaecology 29.5% 34.9% Ophthalmology 25.3% 10.1% Oto-rhino-laryngology 20.8% 12.3% Anaesthesia 16.7% 31.5% Paediatrics 16.7% 21.1% Psychiatry 16.6% 4.2% Gastro-enterology 11.6% 11.5% Radiology 4.0% 13.4% Cardiology 4.0% 15.0% Pneumology 4.0% 5.8%
Both in Belgium and France, hospitals also benefit from supplementary fees. In most hospitals, physicians have to cede a certain percentage of their supplementary fees to the hospital to help finance overhead costs.
Expenditure on supplementary fees is increasing at a pace far exceeding the growth rate of total expenditure on health. So far, measures taken in Belgium and France to curb cost inflation of supplementary fees have not yet resulted in a stabilisation or a reduction of supplementary fees.
6 Only the income earned in hospitals has been taken into account. Supplementary fees charged outside of the hospitals are not included.
Ch
ap
te
r 1
In this thesis, we calculate estimates for expenditure on supplementary fees in Belgium. We discuss figures on the cost (evolution) of supplementary physicians’ fees in Belgium and France. Measures taken to contain costs are then evaluated. The added value of the supplementary fee system for physicians and patients is also investigated. Finally, the future of supplementary fees in Belgium and France is discussed.
Research questions:
3. What is the cost (evolution) of supplementary physicians’ fees in Belgium and France? 4. How can cost inflation of supplementary physicians’ fees be contained?
5. What is the added value of supplementary physicians’ fees?
6. Is a system of supplementary physicians’ fees charged on top of social security tariffs sustainable?
1.4. aCCESS TO nEw HEalTH TECHnOlOGIES
New health technologies come on the market at a rapid pace and -sometimes- at a huge cost. Providing access to new health technologies is a serious challenge for many countries with mandatory basic health insurance.
While mandatory basic health insurance generally covers a broad range of health tech-nologies, new technologies may not be -readily- covered because of budgetary reasons or because there is (as yet) no unanimity about their evidence-based character or their medical necessity. National health authorities can decide not to cover a new health technology, even if the technology has been acknowledged by health technology as-sessment (HTA) centres and/or is covered by health insurers in other countries.
Today, the HTA Core Model is widely used for the assessment of new health technolo-gies. The model enables effective international production and sharing of HTA results in a structured format (Lampe et al., 2009). The model emphasises the multidisciplinary nature of assessments, employing the following nine domains: (1) health problem and current use of technology, (2) description and technical characteristics of technology, (3) safety, (4) clinical effectiveness, (5) costs and economic evaluation, (6) ethical analysis, (7) organisational aspects, (8) patients and social aspects and (9) legal aspects.7
The fifth domain, ‘costs and economic evaluation’, is particularly important for the reimbursement of new health technologies by health insurance. Economic evaluation 7 The HTA Core Model is available at: https://www.eunethta.eu/hta-core-model/.
has been defined as a comparative analysis of alternative courses of action in terms of both their costs and consequences (Drummond et al., 2015). The aim of the costs and economic evaluation domain is to inform value-for-money judgements about health technologies with information about costs, health-related outcomes and economic ef-ficiency (Canadian Coordinating Office for Health Technology Assessment, 1994). Five main types of economic evaluation can contribute to HTA: cost-effectiveness analysis, cost-utility analysis, cost-consequences analysis, cost-benefit analysis, and cost-minimi-sation analysis. Cost-effectiveness analysis (CEA) compares the costs and effects of at least two alternative technologies. The results of such analysis are generally expressed in the form of an incremental cost-effectiveness ratio (ICER). An ICER represents the estimated difference in costs between the comparators divided by the estimated difference in effect between the comparators. In an example where the effects of the comparators are measured in life years, the estimated ICER could be reported as the cost per life-year gained. The ICER approach is currently the most widely used outcome of economic evaluations. Whether a technology can be referred to as ‘cost-effective’ depends on its relation to any extant ‘decision-makers’ willingness-to-pay’ or ‘societal willingness-to-pay’ for an additional unit of health outcome (so-called ‘ICER threshold’). If one main aim of a health system is to maximise health-related outcomes given the resources available, a technology can be considered as being ‘cost-effective’, i.e. improv-ing economic efficiency in health care, if its ICER estimate is lower than a threshold value (or threshold range). If the estimated ICER is higher than the threshold, the technology is not considered to be cost-effective and hence allocation of resources to this technology would be unlikely to increase economic efficiency in health care (Cleemput et al., 2009). The issue of access to new health technologies can best be illustrated by some examples. The first example concerns several countries whereas the other examples relate to the situation in Belgium.
About one per cent of the population in Western countries is infected with the hepatitis C virus. Hepatitis C can lead to liver cirrhosis and liver cancer. Recently, new medica-tion has come on the market which can eradicate the hepatitis C virus. However, since this medication costs 30000 to 50000 EUR per patient and about one per cent of the population is affected, reimbursement by mandatory health insurance in many coun-tries is limited to patients already suffering from liver cirrhosis. People infected with the hepatitis C virus who want to avoid developing liver cirrhosis need to pay for the new medication out-of-pocket.
In Belgian hospitals, there are lists with out-of-pocket payments for well-defined health technologies that are available for the patient. Whereas standard treatment A is
Ch
ap
te
r 1
covered by mandatory basic health insurance, for treatment B, applying a new health technology, one must pay the listed additional out-of-pocket payments. An example of a treatment which -between 2011 and 2014- needed to be paid for out-of-pocket is the trabecular metal hip (2500 EUR), which is used to replace failed hip implants. The use of trabecular metal increases implant stability and enables biologic in-growth, which can help lead to long-term fixation. An orthopaedic surgeon explained how he made the choice between a classic hip implant, paid for by mandatory basic health insurance, and a trabecular metal hip implant, to be paid for out-of-pocket: ‘The trabecular metal hip implant option is discussed only with financially well-off patients. It is very awkward to discuss a treatment option with patients who cannot afford it.’
In case of an amputation of the leg above the knee, patients in Belgium can choose between (electro)mechanical and microprocessor-controlled prosthetic legs. The micro-processor-controlled prosthetic leg is the closest technology has come to natural walk-ing. In Belgium, mandatory basic health insurance only reimburses electro-mechanical prosthetic legs. Patients who want a microprocessor-controlled prosthetic leg have to pay about 30000 EUR out-of-pocket. After 5 to 7 years, the prosthetic leg needs to be replaced.
Carotid artery stenting is a procedure that can be used to open a narrowed carotid artery. It involves placing a small, expandable tube called a stent in the narrowed artery. There are two carotid arteries-one on each side of the neck- that supply blood to the brain. These arteries can be narrowed and damaged by fatty deposits called plaque. If this plaque breaks open, it may form a blood clot, which could move to the brain and cause a stroke. Carotid artery stenting may improve blood flow to the brain and lower the risk of stroke. Carotid stents are not reimbursed by mandatory basic health insurance in Belgium. Carotid stents -which cost between 1000 and 1500 EUR- must be financed out-of-pocket by patients.
The last example concerns the latest developments in cancer treatments, where the ability to pay out-of-pocket can make an important difference. The MammaPrint test is a genomic test that analyses the activity of certain genes in early-stage breast cancer. The MammaPrint test can be used to help make treatment decisions based on the cancer’s risk of recurrence within 10 years after diagnosis. Knowing if a woman has a high or low risk of early-stage breast cancer recurring might help women and their doctors decide if chemotherapy or other treatments to reduce risk after surgery are needed. The Mam-maPrint test is reimbursed by health insurers in the United States (e.g., Aetna) and in the Netherlands, but not by mandatory basic health insurance in Belgium. In Belgium,
patients need to pay 3000 EUR out-of-pocket for this test.8 A Belgian patient reports
being told by her physician that physicians are not allowed to discuss tumour genomic tests, which need to be paid for out-of-pocket, to avoid patients’ having to refuse tests which they cannot afford.9
The Christian Mutuality is the largest ‘sickness fund’ in Belgium, providing mandatory basic health insurance but also offering PHI. In November 2017, the Christian Mutuality stated that PHI is a must in case of a hospitalisation, even when the patient does not choose a private room: ‘Supplementary physicians’ fees cannot be charged in a double room. However, the patient bill can still be high. Certain costs are not reimbursed by mandatory basic health insurance. For instance, certain hip implants, intraocular lenses and materials for fracture fixation. Costs can be high in a double room. These costs have to be paid for out-of-pocket.’10 (Christian Mutuality, 2017)
Using Belgium and the Netherlands -two neighbouring countries- as case studies, we will discuss and analyse different options for policymakers to deal with new health technologies.
Research questions:
7. Are new health technologies equally accessible for patients in Belgium and the Nether-lands?
8. What can be the role of voluntary private health insurance in providing access to new health technologies?
1.5. rEGulaTIOn Of PHI markETS
In the European Union (EU), PHI is, in principle, subject to free market rules and competi-tion. As an exception, governments may impose rules restricting free competition when 8 Cf. Belgian newspaper article (2017) ‘Ik moest tegen de volgende dag 3000 euro vinden, anders geen
kan-keronderzoek’ (translation: I had to find 3000 EUR by the next day, or else: no cancer test), Het Nieuwsblad, 30 March 2017. Available at http://www.nieuwsblad.be/cnt/dmf20170330_02808104.
9 Cf. Belgian news magazine article (2014) ‘Genen sturen de strijd tegen kanker: […] Ik kreeg te horen dat artsen [genoomtesten] zelfs niet mogen voorstellen, omdat men wil vermijden dat mensen een behandeling moeten weigeren omdat ze er geen geld voor hebben. […]’, Knack, 21 May 2014.
10 ‘In een kamer voor twee of meer personen mogen inderdaad geen ereloon- en kamersupplementen aangerekend worden. Toch kan de factuur ook dan hoog oplopen. Want er kunnen wel bedragen worden aangerekend die niet worden terugbetaald door de ziekteverzekering en dus niet worden meegeteld voor de maximumfactuur. Dat zijn bijvoorbeeld niet-vergoedbare implantaten zoals bepaalde heup-prothesen, sommige lenzen bij cataractoperaties of fixatiemateriaal bij botfracturen. [..] Deze kosten moet je dan volledig uit eigen zak betalen.’
Ch
ap
te
r 1
PHI serves as a partial or complete alternative to health cover provided by the statutory social security system (‘substitutive health insurance’). However, notwithstanding the EU’s non-life insurance Directives’ application to PHI, in some Member States govern-ments have restricted the application of free market rules in the PHI market. In order to curb the -often high- premium rate increases under PHI contracts, a ‘medical index’ has been created by law in Belgium. Premium rates can only be increased in line with the consumer price index or the medical index.11 Only when a PHI product is (expected
to be) loss-making may the supervisory authority, the National Bank of Belgium, grant permission to increase premiums.12 However, the question arises whether such
regula-tion, restricting the free market, is in the best interest of consumers. For instance, the medical index cannot be negative, even if the cost evolution in health care were to be. Another issue is that a medical index of this sort could act as a disincentive for insurance companies to reduce costs, because they know that in the end cost increases will be covered by the medical index. In this way, the application of medical indices could even have an inflationary effect.
In Belgium, PHI mainly covers hospital care. About half of the money reimbursed by PHI relates to the cost of a stay in a private hospital room. Since the quality of care in a private room is no better than in a double or common room, it might be difficult to uphold the view that special protection from government is needed to secure access to private hospital rooms.
In France, a tax exemption is granted to PHI products which do not apply selective underwriting. It is not sure whether this is an ideal situation since selective underwriting is needed to counteract adverse selection to protect existing clients against free riders who abuse the insurance system.
Recent European Court of Justice (ECJ) case law has created uncertainty about the ap-plication of the free market principles outlined in the EU non-life insurance Directives. The ECJ has taken different views in two cases (Commission v. Slovenia (2012)13 and DKV
Belgium SA v. Association belge des consommateurs Test-Achats ASBL (2013)14) on the
11 A law introduced on 17 June 2009 restricted increases in premium rates for existing contracts to increases in the consumer price index or the medical index if and in so far as the evolution of the medical index exceeds that of the consumer price index (Article 204 Insurance Law). The medical index reflects the evolution of the patient bill. Because the medical index did not include a provision to revalorise ageing reserves, the medical index was annulled by the administrative court on 29 December 2011. By royal decree of 16 March 2016, a new medical index has been created, including -on top of the claims evolu-tion- a provision of maximum 2 per cent to cover the revalorisation of ageing reserves.
12 Art. 204, §4 Insurance Law (‘Loi du 4 avril 2014 relative aux assurances’, Moniteur belge, 30 April 2014). 13 Case C-185/11, Commission v. Slovenia ecli:eu:c:2012:43.
question whether government intervention in setting the prices of PHI contracts is consistent with EU regulation. On the one hand, in its ruling of 26 January 2012 in Com-mission v. Slovenia, the Court concluded that Slovenia’s rules on complementary health insurance did not comply with the EU non-life insurance Directives. The Court found that a number of provisions in the Slovenian Health Care and Health Insurance Act (‘Zakon o zdravstvenem varstvu in zdravstvenem zavarovanju’ (‘zzvzz’)) did not comply with some of the basic freedoms outlined in the EU’s non-life insurance Directives. By contrast, by its ruling of 7 March 2013 in DKV Belgium SA, the Court upheld the system of restrictive price regulation of existing PHI contracts in Belgium. The Court accepted a requirement of prior notification and approval of proposed increases in premium rates in the Belgian context but not in the Slovenian context.
We will analyse the impact of the two differing ECJ rulings on the application of free-market principles on PHI free-markets in the EU. We will discuss the arguments made in favour and against restrictive regulation. Starting from the Belgian and Slovenian ECJ cases on price regulation in the PHI market, we will broaden the discussion to the ques-tion of the extent to which free market rules effectively apply to PHI.
Research questions:
9. To what extent do free market rules effectively apply to voluntary private health insur-ance?
10. What is the future role of voluntary private health insurance within the framework of social health insurance systems in the European Union?
1.6. OPTImal dESIGn Of PHI PrOduCTS
Since private expenditure on dental care is quite substantial in most EU countries, we have chosen to focus on complementary dental insurance to discuss the issue of optimal design of PHI products.
Health insurance is meant to protect against financial risk and to render access to health care that would otherwise be unaffordable. In the Netherlands, private dental insurance can be bought, which provides a cover limit of 250 EUR per year only. Such products are unlikely to provide financial security. In Belgium, France and the Netherlands, reim-bursement of prosthetic dental treatment (e.g., implants, bridges and crowns) by most private dental insurance products is limited to 1000 EUR per year or less. These products do not really improve access to costly dental treatment such as implants. The cost of an implant is -on average- 2500 EUR. It is not exceptional that 4 implants are needed.
Ch
ap
te
r 1
The risk of being confronted with a total cost of 10000 EUR, of which only 1000 EUR will be reimbursed, is unlikely to give the insured ‘peace of mind’. PHI products offering (very) limited coverage do not protect against financial risk nor do they provide access to health care that would otherwise be unaffordable.
We develop a framework for optimal health insurance design. The current situation of complementary dental insurance in four European countries, Belgium, France, Germany and the Netherlands, is examined. We then look for potential explanations for the gap between the current offering of dental insurance products and an optimal design of dental insurance. We conclude with a discussion on how to improve dental insurance design.
Research questions:
11. How can the gap between the current offer of dental insurance products and an optimal design of complementary dental insurance be explained?
12. How can current complementary dental insurance design be improved?
rEfErEnCES
Note: Apart from the work of Sarah Thomson and Elias Mossialos and some other authors, there is little international literature on private expenditure on health and voluntary private health insurance. We have tried to use all available international literature. We have also extensively made use of policy documents.
Canadian Coordinating Office for Health Technology Assessment: Guidelines for economic evaluation of pharmaceuticals. Canadian Coordinating Office for Health Technology Assessment, Ottawa (1994) Christian Mutuality: Hospitalisatieverzekering niet nodig? Visie, 2 November 2017, p. 12 (2017)
Cleemput, I., van Wilder, P., Huybrechts, M., Vrijens, F.: Belgian methodological guidelines for pharmaco-economic evaluations: Toward standardization of drug reimbursement requests. Value Health. 12(4): 441–449 (2009). doi: https://doi.org/10.1111/j.1524-4733.2008.00469.x
Demarest, S.: Accessibilité financière aux soins de santé. In: Drieskens, S., Gisle, L. (eds.) Enquête de santé 2013. Rapport 3: Utilisation des services de soins de santé et des services sociaux. WIV-ISP, Brus-sels. https://his.wiv-isp.be/fr/Documents%20partages/AC_FR_2013.pdf (2015)
Dormont, B., Péron, M.: Does health insurance encourage the rise in medical prices? A test on balance billing in France. Health Econ. 25(9): 1073–1089 (2016)
DREES (Direction de la recherche, des études, de l’évaluation et des statistiques), ‘Comptes nationaux de la santé 2011’, Paris, Ministère des affaires sociales et de la santé. http://drees.social-sante.gouv. fr/etudes-et-statistiques/publications/documents-de-travail/serie-statistiques/article/comptes-nationaux-de-la-sante-2011 (2012)
Drummond, M.F., Sculpher, M.J., Claxton, K., Torrance, G.W., Stoddart, G.L.: Methods for the economic evaluation of health care programmes. Fourth ed. Oxford University Press, Oxford (2015)
Dybczak, K., Przywara, B.: The role of technology in health care expenditure in the EU. European Com-mission, Economic and Financial Affairs, Economic Papers 400. http://ec.europa.eu/economy_fi-nance/publications/economic_paper/2010/ecp400_en.htm (2010)
Feldman, R., Dowd, B.: A new estimate of the welfare loss of excess health insurance. Am Econ Rev. 81(1), 297–301 (1991)
Feldstein, M.S.: The rising prices of physician’s services. Rev Econ Stat. 52(2), 121–133 (1970) Gruber, J.: Public Finance and Public Policy. Worth Publishers, New York (2005)
Lampe, K., Mäkelä, M., Garrido, M., Anttila, H., Autti-Rämö, I., Hicks, N., Hofmann, B., Koivisto, J., Kunz, R., Kärki, P., Malmivaara, A., Meiesaar, K., Reiman-Möttönen, P., Norderhaug, I., Pasternack, I., Ruano-Ravina, A., Räsänen, P., Saalasti-Koskinen, U., Saarni, S., Walin, L., Kristensen, F.: The HTA Core Model: A novel method for producing and reporting health technology assessments. Int J Technol Assess. 25(S2), 9–20 (2009). doi: https://doi.org/10.1017/s0266462309990638
Lewis, L.: Cancer poverty – yes, it is a thing! The Huffington Post U.K. http://www.huffingtonpost.co.uk/ lorraine-lewis/cancer-poverty-yes-it-is-_b_16343758.html (2017)
Mossialos, E., Thomson, S.: Voluntary health insurance in the European Union: a critical assessment. Int J Health Serv. 32(1), 19–88 (2002)
Mutualité Chrétienne: 12e Baromètre MC de la facture hospitalière. https://www.mc.be/actualite/ communique-presse/2016/barometre_hospitalier_2016.jsp (2016)
Nyman, J.A.: The value of health insurance: the access motive. J Health Econ. 18(2), 141–52 (1999). doi: http://dx.doi.org/10.1016/S0167-6296(98)00049-6
Oderkirk, J., Ronchi, E., Klazinga, N.S.: International comparisons of health system performance among OECD countries: Opportunities and data privacy protection challenges. Health Policy. 112(1–2), 9–18 (2013)
OECD, Eurostat, WHO. System of Health Accounts: 2011 Edition. OECD Publishing, Paris (2011). doi: http:// dx.doi.org/10.1787/9789264116016-en
OECD. Work on health. OECD Publishing, Paris. https://www.oecd.org/health/Health-Brochure.pdf (2015) OECD. Health at a glance: Europe 2016. State of health in the EU cycle. OECD Publishing, Paris (2016). doi:
http://dx.doi.org/10.1787/9789264265592-en
OECD Health Statistics 2017. http://stats.oecd.org/index.aspx?DataSetCode=HEALTH_STAT (2017) Paolucci, F.: Health care financing and insurance. Options for design. Springer, Heidelberg (2011) Paris, V., Hewlett, E., Auraaen, A., Alexa, J., Simon, L.: Health care coverage in OECD countries in
2012. OECD Health Working Papers, No. 88, OECD Publishing, Paris (2016). doi: http://dx.doi. org/10.1787/5jlz3kbf7pzv-en
Pauly, M.V.: The economics of moral hazard: comment. Am Econ Rev. 58(3), 531–537 (1968)
Pauly, M.V.: Insights on demand for private voluntary health insurance in less developed countries. In: Preker, A.S., Scheffler, R.M., Bassett, M.C. (eds.) Private voluntary health insurance in development. Friend or foe, pp. 25–54. The World Bank, Washington (2007)
Rommel, W.: Kanker duwt wie het financieel moeilijk heeft de armoede in. http://www.komoptegenk-anker.be/nieuws/kanker-duwt-wie-het-financieel-moeilijk-heeft-de-armoede (2015)
Samana: Financiële en sociale situatie van invaliden. Samana and Christian Mutuality. https://www. cm.be/binaries/inkomensonderzoek-langdurig-zieken_tcm375-179908.pdf (2016)
Swartenbroekx, N., Obyn, C., Guillaume, P., Lona, M., Cleemput, I., Manual for cost-based pricing of hos-pital interventions. Health Technology Assessment (HTA). Belgian Health Care Knowledge Centre (KCE), Brussels. KCE Report 178C (2012)
Ch
ap
te
r 1
Thomas, S., Thomson, S., Evetovits, T.: Making sense of complementary health insurance. Final report, Slovenian Ministry of Public Health. http://www.mz.gov.si/fileadmin/mz.gov.si/pageuploads/ Analiza/21012016/21012016Report_Making_sense_of_CHI_-_Slovenia.pdf (2015)
Thomson, S., Mossialos, E.: Private health insurance in the European Union. Final report prepared for the European Commission, Directorate General for Employment, Social Affairs and Equal Opportuni-ties. LSE Health and Social Care. http://www.ec.europa.eu/social/BlobServlet?docId=4216&langI d=en (2009)
Ch
ap
te
r 2
2.
Reliability of OECD Health
Statistics
Calcoen, P., Moens, D., Verlinden, P., van de Ven, W.P.M.M. and Pacolet, J. (2015). Improved estimates of Belgian private health expenditure can give important lessons to other OECD countries. Health Policy, 119(3): 341–355. doi: 10.1016/j. healthpol.2014.07.008
abSTraCT
OECD Health Data are a well-known source for detailed information about health expen-diture. These data enable us to analyse health policy issues over time and in comparison with other countries. However, current official Belgian estimates of private expenditure (as published in the OECD Health Data) have proven not to be reliable. We distinguish four potential major sources of problems with estimating private health spending: in-terpretation of definitions, formulation of assumptions, missing or incomplete data and incorrect data. Using alternative sources of billing information, we have reached more accurate estimates of private and out-of-pocket expenditure. For Belgium, we found dif-ferences of more than 100% between our estimates and the official Belgian estimates of private health expenditure (as published in the OECD Health Data). For instance, accord-ing to OECD Health Data private expenditure on hospitals in Belgium amounts to €3.1 billion, while according to our alternative calculations these expenses represent only €1.1 billion. Total private expenditure differs only 1%, but this is a mere coincidence. This exercise may be of interest to other OECD countries looking to improve their estimates of private expenditure on health.
Ch
ap
te
r 2
2.1. InTrOduCTIOn
Health data have a central role to play in supporting stewardship and decision-making by both policy makers and other stakeholders (Poullier et al., 2002a; Forde et al., 2013; Rosenthal and Smith, 2014). OECD Health Data are a well-known source for detailed information about health expenditure. Since all OECD member states have to adhere to OECD’s ‘System of Health Accounts’, OECD Health Data are being produced within the same framework by every member state (Orosz and Morgan, 2004). OECD Health Data are used to analyse health policy issues over time and in comparison with other countries (Oderkirk et al, 2013; Gerkens and Merkur, 2010; Keep, 2011). The results of these analyses can have far-reaching policy implications. OECD Health Data contain informa-tion, e.g. on health status, the number of health care providers and health care facilities, and on expenditure on health, both public and private. In this paper we focus on private expenditure on health including out-of-pocket expenses.
OECD Health Data on private and out-of-pocket expenditure on health are important for the different stakeholders in the health care system. For government and policy makers it is important to know how much and what kind of care is being financed privately, and for determining whether there might be problems with the accessibility of care. Data on private and out-of-pocket expenditure are also indispensable for health insurers, both basic and additional health insurers. Basic health insurers need to be able to measure the effects of their reimbursement policy, while insurers offering additional health insurance need as detailed information as possible about their potential market, constituted of privately paid care. Finally, practitioners and patients need comprehensive clarification of the costs to be borne by the patient, since treatment decisions may well be influenced by cost issues.
We distinguish four potential major sources of problems with estimating private health spending: interpretation of definitions, formulation of assumptions, missing or incom-plete data and incorrect data.
The aim of this paper is to compare official Belgian estimates of private health expendi-ture (as published in the OECD Health Data) with alternative estimates. Current official Belgian estimates of private health expenditure (as published in the OECD Health Data) are not reliable mainly because hard data on private expenditure are not transpar-ent. Using alternative sources of billing information, we have reached more accurate estimates of private and out-of-pocket expenditure. This approach may serve for some OECD countries to re-examine their sources and methodologies. For other countries, it may be irrelevant.
Definitions - Health insurance:
o Basic health insurance: mandatory universal health insurance, organised by the National Institute for Health and Disability Insurance (NIHDI)15 and the sickness funds;
o Additional health insurance: both private insurance companies and sickness funds offer voluntary additional health insurance;
- Private expenditure on health: sum of co-payments and supplements (see Fig. 1); • Services covered by basic health insurance:
• Co-payment16 = official tariff minus reimbursement by basic health insurance;
• Supplement = total fee minus official tariff (‘supplemental fee’)17;
o Services not covered by basic health insurance: • Supplement = total fee (‘supplemental service’);
o In this article, the three definitions are being used: ‘supplemental fee’, ‘supplemental service’ and ‘supplement’ (covering both supplemental fees and supplemental services).
o Belgium 2010: €9316 million private expenditure on health18 = €1854 million co-payments19 + €7462
million supplements;
- Out-of-pocket expenditure on health: private expenditure on health minus reimbursement by additional health insurance and minus reimbursement by non-profit institutions and corporations. Belgium 201020:
€9316 million private expenditure on health = €1519 million additional health insurance + €51 million non-profit institutions + €18 million corporations + €7728 million out-of-pocket expenditure on healtth. Total fee for service covered by basic health insurance
Official tariff
Supplement (supplemental fee) Reimbursement Co-payment
Total fee for service NOT covered by basic health insurance Supplement (supplemental service)
fig.1. Definition of supplements (De Graeve et al., 2007).
2.2. fOur POTEnTIal majOr SOurCES Of PrOblEmS wITH ESTImaTInG PrIVaTE HEalTH SPEndInG
We distinguish four potential major sources of problems with estimating private health spending: interpretation of definitions, formulation of assumptions, missing or incom-plete data and incorrect data.
15 Rijksinstituut voor ziekte- en invaliditeitsverzekering (RIZIV) / Institut national d’assurance maladie-invalidité (INAMI).
16 We use the term ‘co-payment’ to refer to co-payments and co-insurance. Both are cost-sharing arrange-ments which require the individual covered to pay part of the cost of care. A co-payment is a fixed fee (flat rate) per item or service; in case of co-insurance the patient pays a fixed proportion of the total cost. 17 ‘Extra billing’ and ‘balance billing’ are also being used for health care providers billing patients more than
what the insurer pays for their services. 18 OECD Health Data 2013, figures for 2010. 19 Source: NIHDI.
Ch
ap
te
r 2
2.2.1. Interpretation of definitions
Since its publication in 2003, the OECD Manual ‘A System of Health Accounts’ (SHA) provides a common standard for data collection by the statistical offices (Schneider et al, 2010). SHA establishes a conceptual basis of statistical reporting rules and pro-poses a newly developed International Classification for Health Accounts (ICHA) which covers three dimensions: health care by functions of care (what kind of services and what types of goods are purchased?); providers of health care services (where does the money go to?); and sources of funding (where does the money come from?). The proposed accounts are designed to meet the needs of analysts of health care systems and policymakers. They provide a common framework for enhancing the comparability of data over time and across countries. OECD states that they are intended for use in international comparisons that include a broad range of countries with different ways of organising health care and its financing (OECD, 2000).
In 2011, an updated version of the OECD SHA Manual has been published (version 2.0). Version 2.0 has already been incorporated in the data submissions of some countries. So far, version 1.0 has been used for the Belgian submissions.
A narrow or broad interpretation of the definitions listed in SHA can give a totally dif-ferent result in terms of private or out-of-pocket expenditure on health. This can lead to problems when comparing different countries. Private expenditure on homes for the elderly can illustrate this problem.
In Belgium, there are two types of homes for the elderly: homes for individuals requiring extended nursing care (‘nursing homes’)21 and homes for individuals requiring limited
care (‘rest homes’)22. For the Belgian figures, the choice has been made to include
pri-vate expenditure for the first type of homes but not for the second type. There are two problems with this approach. First, although the SHA category ‘nursing care facilities’23
indeed is limiting its scope to ‘individuals requiring nursing care’, private expenditure on rest homes could be allocated to the SHA category ‘community care facilities for the elderly’24. This category addresses ‘persons unable to fully care for themselves and/or
unwilling to live independently’. Second, in the OECD Health Data for Belgium, public expenditure on both types of homes for the elderly has been taken into account. How-ever, so far as private expenditure is concerned, only nursing homes have been taken
21 ‘Maisons de repos et de soins’ (MRS)/‘Rust- en verzorgingstehuizen’ (RVT).
22 ‘Maisons de repos pour personnes âgées’ (MRPA)/‘Rustoorden voor bejaarden’ (ROB). 23 HP.2.1 : SHA classification of expenditure on health by provider (‘Health Provider’). 24 HP.2.3.
into account.25 The question can be raised whether including only public expenditure
on rest homes and not private expenditure does not result in an inconsistency between public and private expenditure on health. This example illustrates a problem with the interpretation of the SHA boundaries.
2.2.2. formulation of assumptions
Certain assumptions are being made for the calculation of private expenditure on health and for the allocation of total private expenditure to the different (sub)sectors. A proxy can be used if no exact information is available. Items can be deducted or added in order to produce a more coherent picture.
It is important for these assumptions and methods to be transparent. Only when as-sumptions are transparent can they be criticised and improved. In this respect, we have had an excellent working relationship with the Belgian Federal Public Service Social Security responsible for producing the Belgian figures for the OECD Health Data. An example can clarify this point. According to Belgian National Accounts, household consumption on health amounted to €10397 million in 2010 (= private expenditure on health). This amount needs to be allocated to the different functions and providers of SHA. National Accounts’ estimates need some adaptations in order to be fit for use within the SHA framework.
A first limitation of National Accounts’ estimates of household consumption is their not taking into account specific transfers from government to households for financing health care. Therefore, in order to avoid double counting, several amounts have to be deducted from the €10.4 billion. Payments made by the Flemish long term care insur-ance26 and by the federal state27 are deducted since they constitute income transfers
from government to households (together €737 million). It is assumed that households spend these transfers completely on the consumption of health care services.
Secondly, co-payments (€2035 million), reimbursement by additional health insurance (€1519 million) and the money granted by the social fund of the Belgian Railways (€18
25 It has been argued that medical care in rest homes being limited, private expenditure in rest homes -i.e. the ‘lodging’component (bed and meals)- cannot be taken into account, according to the SHA manual. 26 Flemish long term care insurance (€280 million) (‘Vlaamse zorgverzekering’).
27 ‘Allocation pour l’aide aux personnes âgées/Tegemoetkoming voor hulp aan bejaarden’ (€454 million); ‘Hulp van derden/Aide d’une tierce personne’ (€3 million).
Ch
ap
te
r 2
million) are to be deducted for it is known how these payments have to be allocated to the different health care functions and providers (together €3572 million).28
Finally, the remaining amount, €6088 million, is allocated to the different functions and providers using co-payments charged in basic health insurance as the distribution key. An important problem with this methodology is that most of these deductions are made from the total figure, €10.4 billion, and not from the figure for the sector the deduction is pertaining to. The way private expenditure on homes for the elderly is calculated, can illustrate this point. Actually, only the money paid to institutionalised elderly by government, by the Flemish community29 and by the federal state30 should be deducted
from the National Accounts’ estimate for private expenditure on homes for the elderly (along with 9% deducted for ‘general expenses’ in elderly care). Although co-payments for nursing home services are almost non-existent and additional health insurance is not reimbursing homes for the elderly, a proportional part of total co-payments and of total reimbursement by additional health insurance has been deducted from the National Ac-counts’ figure for private expenditure on homes for the elderly, resulting in an important underestimation -about one third- of private expenditure on homes for the elderly. Another problem with using co-payments as the distribution code for supplements is that there is not always a proportional relationship between co-payments and supple-ments. Certain (sub)sectors have large co-payments but only small supplements while other (sub)sectors are characterised by large supplements and (almost) no co-payments. In 2010, OECD published a Health Working Paper with best practices of calculation techniques and recommendations on how to estimate private expenditure on health (Rannan-Eliya and Lorenzoni, 2010). National Accounts’ figures on household consump-tion can be a starting point for the calculaconsump-tion of private expenditure on health but adjustments need to be made because of sampling and non-sampling errors.
2.2.3. missing or incomplete data
Detailed information about private expenditure on health is not always readily available since most sources of information are private and data are usually not collected at an aggregate level.
28 Source: Belgian Federal Public Service Social Security.
29 Flemish long term care insurance (€111 million) (‘Vlaamse zorgverzekering’).
Private expenditure refers to expenditure by private financing agents which consist of four types: corporations, households, private health insurance schemes, and non-profit institutions serving households (Rannan-Eliya, 2010). In Belgium, the role of non-profit institutions (€51 million) and corporations (€18 million) is very limited. As already stated, additional health insurance is financing €1.5 billion and €7.7 billion is being paid out-of-pocket by the households.31
Detailed information from additional health insurance sources is available but often not publicly accessible. Additional health insurance covers private expenses. With 74% of the Belgian population being covered by additional health insurance,32 extrapolation of
data from additional health insurance can give a good estimate of private expenditure on health.
Question is if and how information from additional health insurance sources can be made publicly available? In many countries, a multitude of actors is active in the field of additional health insurance. Therefore, the collection of data at an aggregate level could be very useful. However, question is whether complete transparency might disturb fair competition amongst private insurers? This could especially be the case in a market with one large insurer and several smaller players. In such a market, detailed informa-tion from the large insurer might be very helpful for the smaller players. If data were collected at an aggregate level, the competition issue would be less important. Maybe, the professional associations of private insurers could collect all data and publish them at an aggregate level without revealing the contribution of the different insurers. Detailed information on private and out-of-pocket expenditure can also be obtained from professional associations of providers and from the industry (e.g. industry market data on retail sales of pharmaceuticals, vision products and hearing aids). Problem with these sources is that the data often are not publicly available but only on demand. Here too, the competition issue is the main reason for the lack of transparency.
Examples of missing data in the Belgian market are the figures on private expenditure for psychologists and dietitians. No aggregate data are available. The professional asso-ciations have made an estimate based on the number of providers, the average number of sessions and the average fee charged. According to this methodology, we get a total 31 OECD Health Data 2013 (figures for 2010).
32 In 2010, out of a total of 11 million Belgians, 5,4 million carried a voluntary additional health insurance with a private insurance company and 2,7 million with a sickness fund (sources: ‘Assuralia’ [trade organization of insurance companies active in Belgium], Control Office for the Sickness Funds [‘Controledienst voor de ziekenfondsen/Office de contrôle des mutualités’]).
Ch
ap
te
r 2
of €230 million private expenditure on self-employed, registered clinical psychologists and of €60 million on self-employed dietitians in Belgium.
Incomplete data can also be a source of error. An example from the Belgian market are vision products. The official OECD Health Data figures list €3 million as private expendi-ture on vision products. This figure pertains solely to co-payments for vision products that are reimbursed by basic health insurance (€23 million). Figures on total turnover in the market of vision products are not publicly available. Information from the industry learns that total turnover amounts to €475 million. This is a good example of how lack of information can result in distorted results.
The above mentioned 2010 OECD Health Working Paper No. 52 lists a number of issues where reporting may be difficult and proposes certain estimation techniques to fill data gaps.
2.2.4. Incorrect data
Incorrect data are the final type of problems. Normally, this type of problems will not be very common. Creating transparency can avoid this problem since people will notice mistakes and report them.
Sometimes, incorrect data can be a result of dated information. It is therefore important to update sources on a regular basis. For instance, for the production of the Belgian figures for private expenditure on homes for the elderly, a ratio of 40% nursing homes and 60% rest homes has been used. However, in 2010, there were 49.4% nursing homes. Since in the OECD Health Data only private expenditure on nursing homes has been taken into account, the ratio applied results in an underestimation of private expendi-ture on homes for the elderly.
As part of the routine data submissions to the OECD, countries are asked to submit a metadata file to identify data sources, breaks in series, data gaps and estimation tech-niques. The content of the metadata files is published in the OECD data base.
2.3. rElIabIlITy Of ESTImaTES Of PrIVaTE HEalTH SPEndInG: bElGIum aS a CaSE STudy
2.3.1. OECd Health data
Health expenditure data are being collected, validated and published in a joint effort by OECD, WHO and Eurostat. These organisations do not produce any health expenditure
estimates themselves. Estimates are submitted under the responsibility of the national authorities. For Belgium, estimates on health expenditure are being produced by the Belgian Federal Public Service Social Security.33 In this paper, we analyse the reliability of
these estimates, which are being produced by the Belgian authorities and published by the OECD Health Data.
So far, there is no legal obligation for countries to produce health data. By 2016, it will be mandatory for European Union member states to submit a well-defined set of health expenditure aggregates.
2.3.2. SHa framework
In Belgium, as in most OECD countries, publicly available information about private expenditure on health is limited. Therefore, many countries need to turn to different kinds of sources, ranging from public administration data to surveys. Within the Belgian SHA framework, estimates of private expenditure on health are based on National Ac-counts’ estimates on the one hand and public administration data on the other hand. National Accounts’ estimates of household consumption of health care and long term care services are a central reference for the Belgian approach.
The Belgian figures for the OECD Health Data are not based on household budget sur-veys. It is a well-known problem that data from surveys on private and out-of-pocket expenditure on health are prone to measurement errors (Heijink et al., 2011; Xu et al., 2009).
National health accounts (NHA) are a powerful tool that can be used to improve the capacity of decision makers to identify health sector problems and opportunities for change and to develop and monitor reform strategies (Berman and Cooper, 1995). The United States introduced the concept of Health Accounts formally in 1966, followed by France in 1972. The OECD began to use the concept in a few countries in 1976 (Poullier et al., 2002b). The first table of expenditure on health for the member states of the World Health Organization (WHO) was reported in annex 8 of the World Health Report 2000 (figures for 1997) (World Health Organisation, 2000).
The framework for WHO’s NHA reporting is based on the System of National Accounts (SNA) of the United Nations (Poullier et al., 2002b). OECD too states that methodological 33 Federale Overheidsdienst Sociale Zekerheid/Service Public Fédéral Sécurité Sociale. This study has been
Ch
ap
te
r 2
compatibility with SNA accounting rule is a prerequisite for health accounts meeting the basic requirements of comparability over time, between countries and with overall economic statistics (OECD, 2000).
Schneider holds that from a macroeconomic perspective, the indicators presented by SHA are incomplete. Health Satellite Accounts (HSA), which are fully integrated into SNA, should be able to answer questions such as: What is the gross value added of the health economy? What is the productivity of the branches of the health economy? What are the import and export flows and as a result the trade surplus (Schneider et al., 2010)? However, SHA version 2.0 (2011) enables countries to measure -among other things- total health workforce, value added of health providers and the export and import of medical goods and services.
In order to reduce the burden of data collection for the national authorities and to increase further harmonisation across national health accounting practices, as of 2006 there is a joint OECD-Eurostat-WHO SHA data collection based on a joint questionnaire. Advantages of this joint effort are the decrease of the burden of data reporting and the publication of consistent figures. It is important to note that WHO, Eurostat and OECD are aware that the estimates of private expenditure on health vary in their reliability across countries and categories, depending on the availability and quality of national information (Poullier et al., 2002b). Estimating private expenditure, and specifically out-of-pocket spending, continues to present difficulties in many countries and is typically the largest source of error in estimates of national health spending (Mohanty and Srivas-tava, 2013; Chawla et al., 1998). The estimation difficulties not only frequently undermine the credibility of the health accounts, with the result that policy-makers may doubt the validity of the resulting policy implications, but also make international comparisons extremely problematic (Rannan-Eliya, 2010).
2.3.3. alternative calculations based on billing information
In order to review OECD Health Data’s estimates for Belgium, we have been using publicly available information as well as information from professional associations and companies.
Every year, Christian and Socialist sickness funds publish a study about private expen-diture on hospitals. ‘Assuralia’, the trade organisation of insurance companies active in Belgium, publishes data -not always publicly available but available for its members- on expenditure by additional health insurance. The same goes for the ‘Office of control of the sickness funds’ (‘Office de contrôle des mutualités/Controledienst voor de ziek-enfondsen’). Several professional associations and companies -mostly market leaders
within their sector- have provided us with figures about their sector (e.g. dietitians, dermatologists, ophthalmologists, psychologists, ‘Pearle’34 for optical glasses and other
vision products; ‘Lapperre’35 for hearing aids). Finally, we have been able to use data from
‘DKV Belgium’36, the market leader for private additional health insurance.
Unfortunately, this information is not always readily available for the state agencies pro-ducing health accounts or household consumption estimates. This poses a problem. The methodological framework for the data collection for the OECD Health Data does not exclude alternative calculations. On the contrary, transparency of methodology should encourage data sources to be identified. However, methodologies must be robust such that data are consistently available to the authorities over time and meet the definitions and quality criteria.
For the alternative calculation of private expenditure on health, we have been using the same framework and definitions used by the Belgian Federal Public Service Social Se-curity, producing the official Belgian figures for the OECD Health Data (SHA version 1.0). The important differences between the alternative calculation and the official Belgian figures can be explained by the different data sources and estimation techniques used.
2.3.3.1. Supplemental fees
Information about supplemental fees in hospitals is more easily available, as supplemen-tal fees in hospisupplemen-tals are regulated and subject to limitations based on the type of room. Sickness funds have detailed billing information from hospitals (including information on the supplemental fees charged).
This is not the case for supplemental fees charged in an ambulatory setting. We have been able to search the databases of ‘DKV Belgium’ for information on these ambulatory supplemental fees.37 About 20% of what ‘DKV Belgium’ reimburses, pertains to
ambu-34 Pearle is the Belgian market leader for vision products (www.pearle.be). 35 Lapperre is the Belgian market leader for hearing aids (www.lapperre.be).
36 Deutsche Krankenversicherung Belgium (‘DKV Belgium’), a private insurance company, is the market leader in Belgium for additional health insurance (www.dkv.be). About 1.8 million Belgians have taken out an additional health insurance contract with ‘DKV Belgium’.
37 For the alternative calculation of private expenditure for providers of ambulatory health care, we have been using figures about supplemental fees coming from ‘DKV Belgium’. We are aware of the fact that there may be some bias as to these figures. People carrying additional health insurance may be less price-sensitive and health care providers knowing that a patient is additionally insured may charge higher prices. However, contrary to hospital care, additional coverage for ambulatory care is not wide-spread in Belgium. Providers of ambulatory health care generally do not take into account the possibility that a patient might be carrying additional coverage for ambulatory care. Anyway, there are no hard data available about higher prices being charged for ambulatory care for patients carrying additional health insurance. Additional health insurers try to reduce upward pressure on prices by certain measures such