University of Arkansas, Fayetteville
ScholarWorks@UARK
Theses and Dissertations12-2015
Geospatial Workflows and Trust: a Use Case for
Provenance
Rachel Frances Linck University of Arkansas, Fayetteville
Follow this and additional works at:http://scholarworks.uark.edu/etd Part of theSpatial Science Commons
This Thesis is brought to you for free and open access by ScholarWorks@UARK. It has been accepted for inclusion in Theses and Dissertations by an authorized administrator of ScholarWorks@UARK. For more information, please [email protected].
Recommended Citation
Linck, Rachel Frances, "Geospatial Workflows and Trust: a Use Case for Provenance" (2015).Theses and Dissertations. 1364.
Geospatial Workflows and Trust: a Use Case for Provenance
A thesis submitted in partial fulfillment of the requirements for the degree of
Master of Science in Geography
by
Rachel Frances Linck University of Central Arkansas
Bachelor of Arts in International Relations, 2011 University of Arkansas
Bachelor of Arts in Geography, 2013
December 2015 University of Arkansas
This thesis is approved for recommendation to the Graduate Council.
Dr. Jason Tullis Thesis Director
Dr. Jackson Cothren Dr. Xuan Shi
Abstract
At first glance the Astronomer by Vermeer, Tutankhamun’s burial mask, and a geospatial workflow may appear to have nothing in common. However, a commonality exists; each of these items can have a record of provenance detailing their history. Provenance is a record that shows who did what to an object, where this happened, and how and why these actions took place. In relation to the geospatial domain, provenance can be used to track and analyze the changes data has undergone in a workflow, and can facilitate scientific reproducibility. Collecting provenance from geospatial workflows and finding effective ways to use this provenance is an important application. When using geospatial data in a workflow it is important to determine if the data and workflow used are trustworthy. This study examines whether provenance can be collected from a geospatial workflow. Each workflow examined is a use case for a specific type of geospatial problem. In addition to this, the collected provenance is then used to determine workflow trust and content trust for each of the workflows examined in this study. The results of this study determined that provenance can be collected from a geospatial workflow in such a way as to be of use to additional applications, such as provenance interchange. From this collected
provenance, content trust and workflow trust can be estimated. The simple workflow had a content trust value of .83 (trustworthy) and a workflow trust value of .44 (untrustworthy). Two additional workflows were examined for content trust and workflow trust. The methods used to calculate content trust and workflow trust could also be expanded to other types of geospatial data and workflows. Future research could include complete automation of the provenance collection and trust calculations, as well as examining additional techniques for deciding trust in relation to workflows.
Acknowledgments
I would like to take the time to thank everyone that has helped me throughout the course of this thesis. I could not have completed it without the help of you all!
I would like to thank my advisor, Dr. Tullis, for introducing me to this topic. All of his help and guidance with developing my topic, as well as his patience and encouragement on completing this manuscript have been invaluable and greatly appreciated. Thanks to Dr. Shi for teaching me about programming and for all the patience he’s shown while doing so. Without his classes, I would not have had the skills to complete this thesis. Thanks to Dr. Cothren for taking the time to be on my thesis committee and for all the help and advice he has given.
Thank you to my parents for always supporting me and encouraging me to pursue my education. I’d also like to thank Preston, Shelby, and Lakai, for their encouragement and support through this process.
Table of Contents 1. Introduction ... 1 1.1.1. Statement of Problem ... 2 1.2. Research Questions ... 3 2. Literature Review ... 4 2.1. Provenance ... 4 2.1.1. Types of Provenance ... 6
2.1.2. Geospatial Provenance Management ... 7
2.1.3. Provenance Standards ... 9
2.1.4. Formulating Ideas ... 10
2.1.5. Provenance Prototypes ... 11
2.2. Early Provenance Systems ... 12
2.2.1. Geolineus ... 12
2.2.2. Geo-Opera ... 13
2.3. Provenance Systems ... 15
2.3.1. Advanced Microwave Scanning Radiometer-Earth Observing (AMSR-E) System ... 15
2.3.2. Data Quality Provenance System ... 16
2.3.3. Earth System Science Workbench ... 16
2.3.4. GeoPWProv ... 17
2.3.5. HiTempo ... 18
2.3.6. Karma ... 18
2.3.7. MyGrid ... 19
2.3.8. Science Data Processing System (SDPS) ... 19
2.3.9. UV-CDAT ... 19
2.3.10 Future Research ... 20
2.4. Trust and provenance ... 21
2.4.2. Computer Science ... 22
2.4.3. Geography ... 24
2.5. Hidden Markov Model ... 25
3. Methods ... 28
3.2.1. Data ... 29
3.3. Workflow Creation ... 30
3.4. Python Script ... 35
3.5. Provenance Collection ... 36
3.6. Provenance as PROV-XML and PROV-O ... 39
3.7. Provenance Storage ... 39
3.8. Trust Score Assignment ... 41
3.8.1. Results of Content Trust Evaluation ... 42
3.8.2. Results of Workflow Trust Evaluation ... 49
4. Implementing the Hidden Markov Model ... 51
4.1. Estimation of State Transition Matrix Using Provenance ... 51
4.2. Estimation of Observation Matrix Using Provenance ... 54
4.3. Application of Hidden Markov Model ... 55
5. Discussion and Conclusion ... 58
References ... 64
Appendix A: Collected Provenance to PROV mapping ... 71
Appendix B: Python Scripts ... 72
B1. Main.py ... 72
B2. ndviProvExp.py ... 72
B3. genHydroProv.py ... 76
B4. siteSelectionExp.py ... 82
B5. xmlGenerate.py ... 96
Appendix C: Content Trust for additional workflows ... 103
C.1: Content trust for intermediate workflow ... 103
C.2: Content trust for advanced workflow ... 104
Appendix D : Mean elapsed time for each tool used in determining reliability for workflow trust ... 106
Appendix E: State transition matrices and Observation matrices ... 107
Appendix F: R Code ... 111
F.1. Calculations for simple model ... 111
F.2: Calculations for intermediate workflow model . ... 111
F.3: Calculations for advanced workflow model ... 111
G.1. Simple Workflow XML Example ... 112 G.2. Intermediate Workflow XML Example ... 113 G.3. Advanced Workflow XML Example ... 116
1. Introduction
Geospatial workflows are often used in geographic information systems (GIS) as a way to automate a specific task. These workflows can often integrate large amounts of data from a variety of sources. Knowledge of data sources, the creators of the data, as well as what tools or changes were used on the data can be difficult to ascertain by just viewing the workflow. The collection of provenance is important in that it can provide a solution to managing geospatial data in workflows. Defining provenance is essential to being able to adequately collect it.
Provenance is data that is collected from recording the lineage of a specific object. Provenance has been often used in a wide range of fields such as art and computer science. Provenance data can also be recorded about the processes composing a workflow. A workflow is a chain of services or tools that can describe an overall procedure and when executed, produce intermediate and final products for scientific analysis (Hey et al., 2009). When considering provenance in relation to the geospatial domain, provenance can be thought of as the process history of geoprocesses used within a workflow or a study (Tullis et al., 2015).
Through the collection of provenance for a workflow, it is important to understand if a particular workflow can be trusted. The definitions of trust are varied and often depend on the context of the situation. Since using provenance with geospatial workflows is relatively new, it is desirable to test if trust can be determined by using this collected geospatial provenance.
Statistical methods, such as Hidden Markov models have been used in non-geospatial
applications to predict a trust score for a given workflow. This study examined if certain methods are appropriate for use with geospatial workflows. Due to the burgeoning interest of capturing and storing geospatial provenance, it is important to examine ways in which it can be used.
Over the past decade, the geospatial community has taken a renewed interest in provenance and its applications (Di, 2013; Yue, 2009).Collection of provenance has been an early and continued focus in the geospatial community (Lanter, 1990; He et al., 2015). However studies focusing on ways in which collected geospatial provenance can be used, are minimal. It is important to note than in this study the terms provenance and lineage will be used
interchangeably.
1.1.1. Statement of Problem
Much research has been done in developing provenance systems that record geospatial provenance; however research on how to effectively use this provenance is minimal. The disciplines of computer science and information systems have developed applications in
conjunction with provenance data which allow for a quantifiable measure of quality or trust to be produced, or a probability that a workflow is trustworthy at a given state (Rajbhandari et. al., 2006; Naseri & Ludwig, 2013). Using geospatial provenance to quantify quality has been approached by Malaverri, however very few articles currently explore this topic in depth for trust.
The expansion of trust to geospatial provenance poses two unique challenges. The first challenge is that very little exploration has been done on methods or benefits for evaluating trust using geospatial provenance. Therefore, other disciplines must be heavily consulted for
applicable techniques of determining trust of geospatial data. The second challenge is the unique nature of geospatial data. Special attention must be paid to spatial and temporal aspects of the data and the way in which these can be handled when computing trust. In particular, which
statistical measures can be applied to non-static data and which techniques can be used to handle evolving data within a workflow.
1.2. Research Questions
Provenance data has been used to generate a measurement of quality for geospatial data (Malaverri et al., 2012; Malaverri et al., 2013). However, the use of provenance to determine trust for geospatial workflows is an area where research is needed. An overall goal of this study is to determine if provenance collected from a geospatial workflow can serve as an indicator of trust and if a Hidden Markov model can be applied to predict a trust value. The goal can be broken down further into three research questions that must be answered.
The first research question is: can provenance be collected from a geospatial workflow in such a way that it is useful to additional applications? In this particular study, the application is to facilitate the calculation of determining content trust and workflow trust for a given workflow. Provenance data will be collected and stored following the PROV data model. Open source or free trial versions of software will be used if possible.
The second question is: can a measure of trust be calculated for a given workflow based on parameters that are representative of trust, which stem from both the metadata and
provenance of the workflow? This thesis will examine which factors can be used to estimate trust for a geospatial workflow. Careful attention will be made to the nature of geospatial data. These parameters will be obtained from the metadata, provenance, and user needs of a workflow.
The third question to be addressed is: can a Hidden Markov Model be used to predict the probability of a level of trust for a geospatial workflow. Naseri’s dissertation explored the use of stationary and non-stationary Hidden Markov models for non-geographic data; however this
technique has yet to be applied to geospatial data provenance. The goal of the third question is to see if this method is appropriate for analyzing geospatial workflow trust. A thorough review of the literature on provenance, trust, and Hidden Markov models provides more understanding into the three research questions for this study.
2. Literature Review
Research in geospatial provenance has a broad focus. Understanding the need for provenance, provenance collection system design, and provenance data quality are some of the topics analyzed in the literature. Portions of this section will appear in Tullis et al., 2015, which is currently in publication.
2.1. Provenance
Provenance from the French word provenience, to originate, comes from a concept started in the art community (International Foundation for Art Research, 2013). Provenance in art is focused on recording a piece’s ownership history. This record would contain a history of a particular piece’s owners, transfers, date of these occurrences, and locations (Yeide, 2001). Provenance has since been used in a wide variety of disciplines, such as archaeology, computer science, geospatial analysis, and remote sensing. A more modern definition of provenance can be thought of as a description of objects and their production transformations which can serve as a method of reproduction, authentication, and data trust (Groth & Moreau, 2010).
Although each discipline’s provenance may have unique requirements or variations in semantics, the overall concept can be summarized by the following definition provided by the World Wide Web Consortium (W3C): “Provenance of a resource is a record that describes
entities and processes involved in producing and delivering or otherwise influencing that
resource.” (Gil et al., 2010). For the purpose of this paper, W3C’s Provenance Working Group’s definition and recommendations for provenance will be followed.
The Provenance Working Group is an effort by the W3C to create interoperable
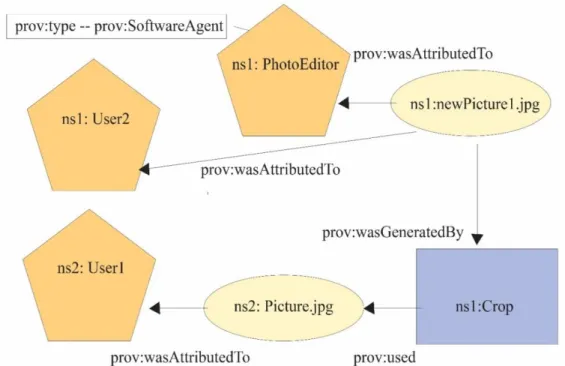
guidelines for provenance on the web. The W3C’s PROV-O recommendation defines three main classes for provenance as entity, activity, and agent. An agent (actor) can be associated with a particular action towards a specified item, an entity is an item that can be manipulated, and an activity is the particular action towards an entity associated with an agent (Groth & Moreau, 2013). In addition to PROV-O and PROV-XML which are designed for machine consumption, there is another format for how provenance can be represented. PROV-N can be used to display provenance in a format that is easy to read. This format is designed to make provenance easily accessible for humans and is not designed with other applications in mind (Moreau & Missier, 2013). Figure 1 shows an example of PROV-N notation for the derivation of a photograph.
Figure 1. Graphical representation of the PROV-N model of a photograph. The provenance pictured in Figure 1 in analogous to the type of provenance that might be included with a remotely sensed image. In addition to the discipline’s requirements, the data captured will be a reflection of the type or level of provenance being recorded.
2.1.1. Types of Provenance
Different types and granularities of provenance can be captured based on the user’s needs. Two types of provenance are why and where provenance. Where provenance describes the location in which the data is stored, while why provenance describes parent-child relations
between datasets (Buneman, 2001). What this means is that where provenance is concerned with file paths for a particular dataset or the location of a tuple in a database that contains provenance data. Why provenance on the other hand is concerned with the data itself.
For example, a researcher has a dataset called D1. All of the datasets that make up dataset D1 are considered D1’s parent relations. All of the datasets that have been produced using D1 as an input are considered D1’s child relations. In addition to provenance type, provenance granularity must also be considered. Coarse grain provenance records the processing steps of as system, such as provenance at the workflow level, whereas fine grain provenance records information at the data level, such as data in a tuple or pixel size (Tan, 2007; Woodruff, 1997).
Depending on if provenance is where or why, the method of storage may differ. For example, recording eager provenance deals with the storing of where-type lineage, while lazy provenance deals with the storage of why-type lineage. Eager capturing records where
provenance at a fine grain level and will immediately log changes made, while lazy capturing records at a coarse grain level (Ikeda, 2009). Provenance collection is not limited to only collecting one type or granularity of provenance. A system can collect multiple types or
granularities of provenance and still be a valid working model, as long as the data sets involved supports this (Yue, 2009). Regardless of which type of provenance is recorded, there must be a system in place where the provenance is managed.
2.1.2. Geospatial Provenance Management
In order to analyze provenance, it must be successfully captured and stored. Although multiple techniques have been developed in computer science to collect provenance data, the ones that are discussed have been used to specifically capture geospatial provenance. Inversion, service chaining, and ontology expansion will be discussed below.
Inversion can be used to capture lazy provenance for fine-grain data lineage (Woodruff, 1997). Inversion takes place when examining database transaction history and working
backwards towards the source (Tullis et al., 2015). Woodruff uses inversion at the tuple level by registering attributes, elements, and algorithms, then performing inversions on these items
leading to a lineage trail between data transformations. The data is displayed as a function, which is then weakly inverted. Using an object-relational database and a database visualizer to store the inversion functions, provenance can be effectively stored and queried. The data Woodruff
analyzes is based on cyclone tracks, but this method could be applied to various other types of geospatial data. Woodruff’s work is significant in that it was one of the first efforts to expand geospatial provenance to the fine-grain level of collection and successfully capture the desired transformations of the data.
Yue models a workflow to allow geospatial programs to be in a service chain, allowing for provenance capture (Yue, 2010). A service chain allows for the architecture of a program to be composed of various services that when used together form the overall design of the program. The provenance is registered in a catalogue service and complies with the interoperable
specifications of web ontology language (OWL). Yue’s work is important in that it provides the start for expanding geospatial provenance for use on the Semantic Web.
Yue expands further on provenance techniques by proposing an ontology be extended to cover the geospatial field, allowing for a catalogue service to be extended covering geospatial provenance (Yue, 2010). A catalogue service makes use of (Hypertext Transfer Protocol) HTTP to allow geospatial data or records to be discoverable over the web. The Open Geospatial
Consortium’s guidelines (OGC) and the International Standards Organization’s ISO-19115:2003 are used to expand an ebRIM catalogue model to extend to geospatial provenance storage. Yue further expands on implementation of this technique by extending provenance relations and
2011). The significance of this work is that Yue recognizes that in order for provenance to be successfully adopted and used on the Semantic Web a geographic ontology must be extended to incorporate geospatial provenance.
2.1.3. Provenance Standards
The earliest geospatial provenance standard was developed by the American Congress of Surveying and Mapping (ACMS) for the National Committee for Digital Cartographic Data Standards (NCDCDS, 1988). The current standard in use for the geospatial domain is the International Standards Organization’s ISO 19115-2, which has been endorsed by the Federal Geographic Data Committee (ISO, 2009). One major difference between the two standards is the ISO couples lineage with metadata, whereas the NCDCDS did not. As pointed out by Di,
geospatial provenance needs a way to conform to standards through ISO 11915:2003 (Di, 2013). Much work has been done recently on how to achieve compliance with various
provenance standards. Di has developed a method for extending a service oriented architecture (SOA) provenance system’s output to comply with ISO 11915-2 and ISO 19115:2003 standards (Di, 2013). Feng has taken this a step further and used the Open Provenance Model (OPM) standards to handle metadata complying with ISO 11915-2. Feng achieves this by adding four new categories to the OPM model that can handle geospatial provenance and by using Java to control the document object model libraries to handle the provenance data (Feng, 2013). Another attempt at fashioning geospatial provenance to an international standard is turning geospatial provenance into metadata as defined by the Dublin Core metadata standard in order to become linked data for web browsing (Yuan, 2013). These standards define the shaping of current and
future provenance collection, however to understand how these standards came about it is important to examine early attempts at the concept of provenance and its collection.
2.1.4. Formulating Ideas
The earliest work in geospatial data provenance was spurred by the formation of the National Committee for Digital Cartographic Data Standards (NCDCDS) by the American Congress of Surveying and Mapping in 1982 (Bossler, 2010). Provenance, also known as lineage, was incorporated by the NCDCDS as one of the five fundamental components to assessing data quality (NCDCDS, 1988). With transitions from static to computerized mapping, several things about data quality and data processing were realized. Geospatial data processes need to be tracked from their origins, through revisions to the data, and finally to the output (Moore, 1983). Chrisman brings up the point that data quality and the tracking of data lineage are necessary in order to see if the data is being suitably used within a geographic information
system (GIS). In order to judge suitability the GIS lineage could possibly be captured and viewed through an overlay method on a map (Chrisman, 1984).
Other preliminary ideas on the use of lineage focused on other aspects of geospatial data. The temporal aspect of data must be considered as it can greatly impact the quality of data used in a GIS (Langran, 1988). In order to better compliment data transferring, lineage could be used in developing systems to have an understanding of data quality (Nyerges, 1987). Grady also supports lineage as a measure of data quality which can be used to record societal mandates (Grady, 1988). These scientists focused on the theory and possible implications of provenance, however other scientists began experimenting with how to actually record and collect geospatial provenance.
2.1.5. Provenance Prototypes
Several provenance systems were designed to record geospatial data lineage. One of the earliest was the Map Librarian’s catalog system in ARC/INFO. The catalog served the function of recording a map document’s history. This history showed which tiles contained which layers, locations, and updates (Aronson, 1983). This system falls short of the goal of lineage, as it replaces each layer once it is updated with the newest layer in the catalog. MARKII, a system developed by the United States Geological Society’s National Mapping Division, allowed for a database’s current dataset to be tracked. However, spatial data requirements of large file sizes and complex geometries made the database systems of the time unable to properly perform (Guptil, 1987). A solution to this problem was proposed by Egenhofer, advocating for the object-oriented principles of propagation and inheritance to be utilized to overcome geospatial database issues (Egenhofer, 1992).
GIS databases were unable to capture the complete lineage of a map document as they were incapable of tracking temporal versions of the data. Langran identified the problem of version overwriting and expressed the shortcomings of the snapshot and log methods for storing lineage (Langran, 1988). The methods of using overlays to capture time changes to the data and the polygon intersect method, were proposed by Langran and Chrisman as possible solutions to the problem of tracking temporal changes in geospatial data. The use of the overlay method or the polygon intersect method was only considered feasible if software capabilities were improved (Langran, 1988). These early prototype systems identified shortcomings of the
2.2. Early Provenance Systems
The results of the provenance prototype systems identified two important issues that would needed to be addressed if geospatial provenance collection was to be successful. Changes in datasets would need to be tracked, not just replaced, and the time these changes occurred must be logged as well. Early provenance systems were focused on taking the idea for the need to capture provenance and turning this idea into a reality. These early systems also addressed the two problems identified by the provenance prototype systems. Audit trails and version control were the main contributions of these systems. Provenance systems such as Geolineus and Geo-Opera, as well as additional systems will be examined in more detail below.
2.2.1. Geolineus
Created by David Lanter, Geolineus is a single tiered architecture provenance management system. This system divided geospatial layers into three types: source layer,
intermediate layer, or product category layer (Lanter, 1991). A source layer acts as a parent node that derives intermediate layers. Transformation and manipulation occur on the intermediate layers, which serves as a middle stage between source and product category. Product category layers are derived layers of the provenance system, and are also child nodes. Links are used to connect layers, showing the flow of the transformations in the data.
Software architecture for Geolineus is composed of: frames, a lineage information program comprised of a knowledge representation program, and knowledge representation interrogator. Frames are used to record the attributes of the various nodes and transformations. Three types of frames are used: command frame for transformations, source frame for source
information program (LIP) serves as the application layer for the user. User commands are entered into the LIP, parsed and then executed by the GIS system. A knowledge representation is created, representing relationships among nodes. From this representation, the knowledge
interrogator can query the provenance information stored within a database. Geolineus has the ability to update and avoid redundancy. Source path names and attributes are checked for uniqueness. If a duplicate is found, it can be merged as one view within the database. Derived layers can be checked for uniqueness by tracing their links for similar ancestors. To update data, time stamps are checked on each version. For the newest version, parameters are taken, the source is updated, and the transformations are re-applied (Lanter, 1991).
Lanter named his program GEOLINEUS and during test runs came to the conclusion that when source information is lacking, a lineage system’s ability to determine data quality can only go so far and, to remedy this, a way to automatically capture information must be incorporated (Lanter, 1994). Automatic updating of data layers can be achieved by following the parent child links of each node, comparing the creation dates, and updating the selected layer through
intersection and union (Lanter, 1994). Geolineus is unique in that it is one of the few provenance systems that made it out of the testing stage, into the fully fledged production stage for use by clients. The disadvantage of this system now is that it is not widely available and as technology has changed, aspects have become obsolete.
2.2.2. Geo-Opera
Also incorporating geospatial provenance into its design is Geo-Opera. Geo-Opera allowed for interoperability, data recovery, the ability to log history, and a system for monitoring data versions (Alonso, 1997). Geo-Opera is based on a modular 3-tiered architecture allowing for
easy updating (Alonso, 1997). The application service is composed of an internal and external user interface. The internal interface establishes communication protocols to the other layers. The external user interface resides on the client's machine. Geo-Opera's processing service consists of a dispatcher, navigator, object manager, and query manager (Alonso,1997). The dispatcher locates available machines within a network to be used for processing and manages their communication. The navigator is used to monitor the processes and their updates. The object manager updates information for externally registered objects, and the query manager serves as the interface for querying information within the database.
The database layer is composed of five spaces: template, history, instance, object, and
configuration to record the provenance information (Alonso, 1997). The spaces allow portions of the database to be stored within different machines. Geo-Opera uses its own modeling language for processes and the Opera Canonical Representation language is used to identify various entities within the provenance system. External objects not represented in Geo-Opera must be registered by the user, and the object's attributes must be defined. When this is done, the external object becomes a black box within Geo-Opera and database functions can then be applied to it (Alonso, 1997). Version attributes are logged, which further contributes to lineage collection. Updates are performed by flagging all related objects to the updated object. The lineage is computed and the source object is re-run using the transformations stored in the database (Alonso, 1994). Geo-Opera is important because if fulfills some of the requirements of a
provenance system such as logging changes and tracking versions. Geo-Opera is not considered a complete provenance system in that it lacks the abilities to store and retrieve spatial data.
2.3. Provenance Systems
The following section outlines selected provenance systems that have been used with geospatial data. Although some systems were not designed with capturing geospatial data
provenance as their goal, all mentioned systems have been used for this. These systems are more recent than Geolineus or Geo-Opera and therefore have different considerations and designs.
2.3.1. Advanced Microwave Scanning Radiometer-Earth Observing (AMSR-E) System The AMSR-E Legacy data system focuses on capturing geospatial provenance
information from a no longer used AMSR-E satellite. This system not only captures generated provenance information, but uses manual forms to capture provenance information in context (Conover, 2013). AMSR-E uses a two-tiered framework based on the biological provenance system Taverna and the geospatial provenance system Karma (Conover, 2013). Manually entered contextual provenance is given a digital object identifier (DOI) and a Uniform Resource Number (URN) to help query the provenance information. The Earth Science Library for
Processing History (ELPH) is used to browse the provenance with XML and is based off of Karma’s browser (Conover, 2013). As pointed out by Conover, this and other types of geospatial provenance systems have difficulty being run without using workflows. A solution to this is to run a Linux operating system that allows data logging (Conover, 2013). Since this system is based off of Karma, it has a sound foundation, however centering a provenance system on technology no longer in use may possibly hinder this system moving forward.
2.3.2. Data Quality Provenance System
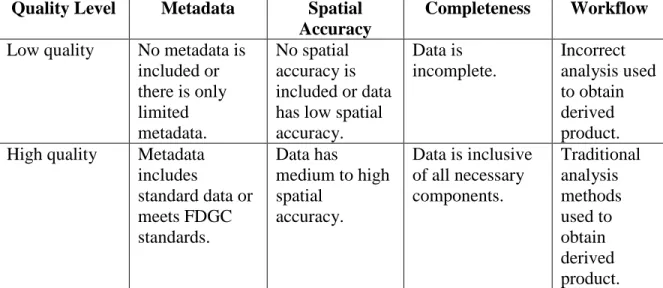
Taking into account a source’s trustworthiness and the data’s age, Malaverri has created a provenance system that allows a quality index to be assigned (Malaverri, 2012). Malaverri’s provenance model is based on the OPM provenance model and follows ISO-19115 metadata standards. Other criteria for the quality index include: granularity, accuracy of attributes descriptions, completeness of the data, a logical measure of the data, and spatial positional accuracy (Malaverri, 2012). Malaverri’s work is unique in that it attempts to quantify data quality by using provenance.
2.3.3. Earth System Science Workbench
Earth Science System Workbench (ESSW) is n-tiered provenance system architecture. ESSW uses scripting techniques to collect geospatial provenance information. ESSW is composed of two main components: the Lab Notebook and Labware (Frew, 2001). Lab Notebook acts as the server to the system. It essentially serves as a metadata registry and
repository (Frew, 2001). Lab Notebook is a Java-based system that gathers lineage and metadata information. Lab Notebook converts the parameters gathered into XML and stores these within a relational database after being parsed. A user accesses Lab Notebook by using Perl scripting, which invokes a call to the application programming interface (API). A daemon runs in the background in order to listen for event calls from the client. When one is obtained, IBM's XML parser for Java is used to convert client input from Perl to XML. Java API then converts the XML into structured query language (SQL) to query the relational database (Frew, 2001). The database is composed of tables with root elements containing document-type definitions. Every
their own attributes that are added after a process is run. A unique ID is assigned to each table in order to be able to query for lineage information, and to prevent reduplication (Frew, 2001).
Earth Science Server monitors the execution of ESSW, and runs automatically in the background. It is composed of a logger and a transmitter. The logger monitors and records program specifications during run-time (Frew, 2008). A plug in can be created in order to allow the logger to run better with specific applications. The transmitter allows a unique ID to be generated for each object in the log file. It also transforms plug-in log files into files that ESSW can read, which are subsequently parsed into XML (Frew, 2008).
Both systems run on the Linux operating system. System processes are able to be logged using the strace function (Frew, 2008). Time can be identified by accessing the time on a client's operating system for lineage traces (Frew, 2008). The weakness in this system is that it was created before standards could be applied, making its interoperability questionable.
2.3.4. GeoPWProv
GeoPWProv is a geospatial provenance system designed to move away from displaying provenance as workflows and instead displaying it as a visual graph. GeoPWProv has four parts: a geospatial provenance recorder, provenance storage system, provenance finder, and
provenance exhibitor. Geographic Markup Language (GML) is used to interact between a web browser and Open Layers map display (Sun, 2013). Sun’s work is unique in that it displays geospatial provenance information in a way that differs from other systems. Placing emphasis on the visual aspect of provenance, such as the connection between data layers, allows for a clearer understanding of the changes taking place between a workflow’s layers.
2.3.5. HiTempo
Although HiTempo is not a system based on provenance collection it plans to include provenance collection as a component (Van Den Bergh, 2012). HiTempo will deal with MODIS, SPOT, and Advanced Very High Resolution Radiometer (AVHRR) data (Van Den Bergh, 2012). As provenance is not the focus of HiTempo, specifics of how this will be structured into the system is omitted. The lack of current provenance implementation details for HiTempo is disappointing, however if provenance can be successfully collected, the implications for this for geospatial data are considerable. Many studies often make use of MODIS, SPOT, and AVHRR data, and having a way to track the provenance of the data transformation process will be extremely useful.
2.3.6. Karma
Plale makes use of the Karma system designed by Simmhan to collect provenance data on AMSR-E (Plale, 2011). One of the biggest benefits of Karma is its modular architecture. This allows Karma to be interoperable with Java and other web services (Plale, 2011). Karma’s architecture for this application consists of an application layer, web service layer, core service layer, and a database layer (Plale, 2011). Open Provenance Model (OPM) specifications and XML are included, thus making its interoperability extend further (Moreau, 2011). Karma is unique in that it is a provenance system that has shown success in a variety of use cases. Its interoperability can allow possible extension for a variety of provenance collection scenarios if so desired.
2.3.7. MyGrid
MyGrid is an n-tiered provenance system consisting of four layers: services, workflows, provenance, and middleware (Zhao, 2003). MyGrid uses an ontology based on DAML-S OWL semantics allowing for interoperability (Zhao, 2003). Freefluo is used to handle the workflows and is capable of running web service definition language. Also in the workflow layer, xScufl is used to extend the Java language for workflow definition and Ws-info doc is used to define workflow parameters .Both languages are based in XML (Zhao, 2003). Freefluo also acts as middleware, parsing and storing provenance information within the provenance repository (Zhao, 2003). MyGrid has a good structure to base a methodology on, however it was built before ISO standards could be actively applied to lineage.
2.3.8. Science Data Processing System (SDPS)
SDPS makes use of the MODIS Operations Data Processing System (MODAPS) and the Ozone Monitoring Instrument Data Processing System (OMIDAPS) for satellite data and
algorithms to query provenance (Tilmes, 2008). SDPS uses a scripting process to track changes in algorithm versions. Using this, every version is not stored, but enough information is retained that an older version of data can be recreated. Tilme’s data recreation is unique and is something that could be useful in other geospatial provenance systems. The focus on algorithm changes is useful in that it allows one to see exactly how the end data product was created.
2.3.9. UV-CDAT
Santo’s UV-CDAT is a relatively new provenance system built for handling large amounts of climate based data (Santos, 2012). UV-CDAT uses a data viewer interface (DV3D),
CDAT core, and uses VTK/paraview as an integrated infrastructure with outside components (Santos, 2012). UV-CDAT allows the use of multiple scripts to be used and has a graphic interface for displaying workflows. UV-CDAT is unique in that it has been distributed and is in use by other scientist throughout the climate field. UV-CDAT has a helpful documentation and installation section for those who which to use it in their research (UV-CDAT, 2015). This is different from most of the other systems mentioned, as the actual use of them with everyday projects is obtuse. UV-CDAT’s creators have focused on making this system easily adoptable.
2.3.10 Future Research
Future research for geospatial provenance systems that lies outside the scope of this paper’s research can be identified in several areas. Research can be done to expand provenance systems to handle more data heavy applications (Wang, 2009). Research can also be done to understand why provenance is not fully incorporated and what can be done to make a change in the mindset to include provenance from now on (Tilmes, 2008). This is especially important in the geospatial domain as what is often seen is the end data product. Without knowing how this product was created or what datasets went into its production, making an informed decision about this product will be difficult. Research has also only been done on provenance in a scientific setting, no articles have been found on attempts to utilize it in the general public. Research can also be done on how to insure provenance is interoperable without a geographic ontology (Jones, 2003). A lineage standard has been adopted through ISO 19115-2 and endorsed by the FGDC, however this lacks much that an ontology could help contribute to (ISO, 2009). While these ideas are not touched upon in this paper, this paper will cover geospatial provenance and its use for evaluating trust in regards to geospatial data and workflows.
2.4. Trust and provenance
Before delving into the properties of trust, it is important to identify how provenance and trust are related. Provenance can be used to help make a more informed decision on whether or not to trust a particular item. In the case of workflow provenance, provenance provides additional data regarding the processes that occurred in a workflow, as well as how they were carried out, and by whom, which can then be used to evaluate trust (Rajbhandari et.al, 2006). Additionally, provenance may also be used to provide more document or data layer metadata and if this provenance is trustworthy, that can help provide validity for trusting a content resource (Gil & Artz, 2007). In order to provide a clearer understanding of what constitutes trust, a more detailed explanation is given below.
2.4.1 Trust
Trust is an integral part of decision making. The decision to trust a piece of information or a particular dataset can result in its adoption for use and while the decision not to trust can lead to the item be refuted and no longer considered for use. For example a researcher may have a workflow to determine the NDVI index for a geographic location that they downloaded from the internet. Upon closer examination of the tools used in the workflow and the parameters
evaluated, the researcher notices that the algorithm used to calculate NDVI is incorrect. This leads the researcher to not trust the outputs of the workflow and avoiding using it.
When analyzing a workflow, it is important to determine if its components, such as the inputs, intermediate layers, and outputs, can be trusted. In addition to this, the tools or services used in the workflow, along with the algorithms involved are also critical in determining trust. There are a significant number of definitions for trust, which vary based on the context of a situation. A broad definition of trust as defined by Xin Liu is “the relationship between two entities, where one entity (trustor) is willing to rely on the (expected) actions performed by
another entity (trustee)” (Liu et al., 2014). As the context is determined, the definition of trust becomes more specific. A brief overview of the different types of trust relatable to geospatial workflows and their use case domains are given below.
2.4.2. Computer Science
Multiple types of trust are found in computer science literature. Rajbhandari et al., define three types of trust measurements: process trust, service trust, and data trust. Process trustis a subjective decision of trust based on the user’s evaluation on the results of a workflow, while service trustis objective and based on observing the past behavior of a workflow’s components (Rajbhandari et al., 2006). Data trust is composed of both objective and subjective components and is used on the intermediate workflow processes. A decision tree model is used to determine a trust measure for a given workflow.
Naseri and Ludwig use Hidden Markov Modeling (HMM) to model workflow trust. The parameters execution status, reliability, and availability of a workflow are used to determine the quality of each service in the workflow (Naseri & Ludwig, 2012). These are then classified into three states, which in turn are given a level of trust. The HMM is then used to examine at a given state of the workflow, what is the probability that this state will be in each level of trust.
Artz & Gil give a review of the types of trust that have been focused on in scholarly research, characterized by four main categories: policy based, reputation based, general trust models, and informational trust. Policy based trust is concerned with using credentials such as user name and password to verify trust, while reputation based trust uses factors such as ranking and Eigen trust or performance history (Gil & Artz, 2007). General trust refers to determining which factors influence trust in a particular domain and how trust can be determined in that
context. The final category, information trust focuses on the trust of resources based on the internet and their reliability and quality (Gil & Artz, 2007). Content trust also focuses on the trust of a given resource.
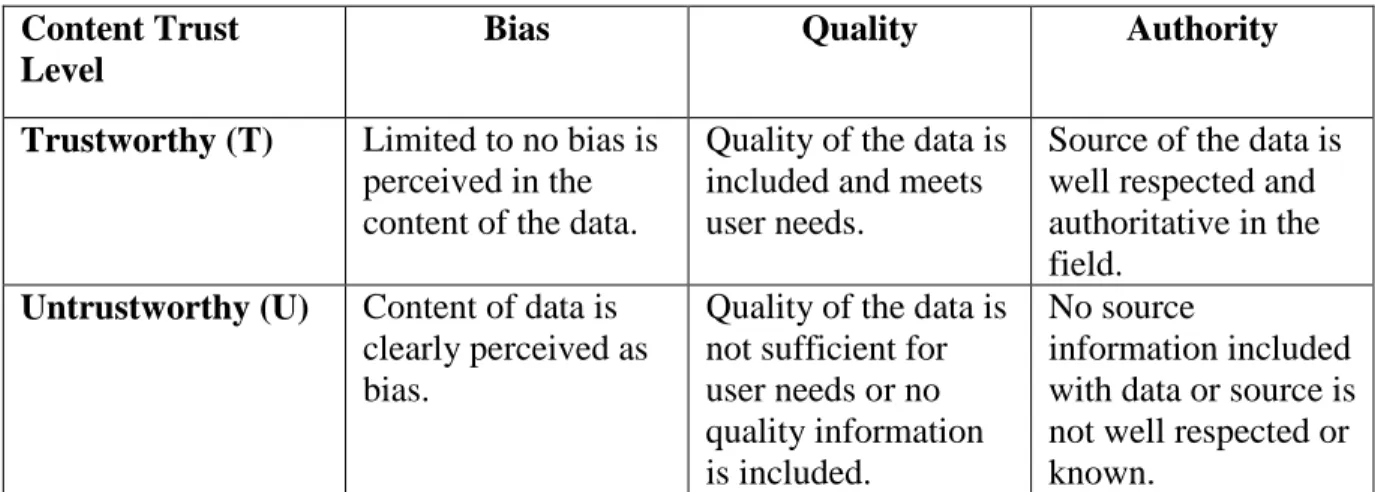
Content trust is an evaluation of trust based on the resource or data item itself (Gil & Artz, 2007). Gil and Artz further examine content trust by determining the factors that most influence trust of a resource. Nineteen factors are considered with six as being the most valuable for determining content trust. These six factors are: the source of the resource (“Authority”), similar resources to the resource being examined (“Related Resources”), the provenance of the resource (“Provenance”), bias of the resource’s source (“Bias”), what reasons does the resource have to be accurate or unbiased (“Incentive”), and the estimate that the resource is misleading (“Deception”) (Gil & Artz, 2007). An example of a system to evaluate and store content trust is TRELLIS. TRELLIS allows users to manually enter their view on a given resources content trust, by allowing the user to select annotations to describe the resource, which is then given an overall rating (Gil & Ratnakar, 2002).
Jung et al., define two types of trust in relation to grid computing, domain based trust reasoning and property based trust reasoning. Domain based trust reasoning allows for the data versions, provenance, and the semantic origins of the data to be verified, while property based trust reasoningonly focuses on the artifacts of interest to the user (Jung et al., 2011). These are then combined to form a multi-layer trust reasoning for use with the Open Provenance Model. Although these definitions of trust are defined in computer science literature for that particular discipline, they could be applied to GIS, as GIS can fall within the domain of computer science. More specific definitions of trust applicable to GIS or geography are discussed below.
2.4.3. Geography
Trust in relation to geographic data is examined in a number of articles. Keẞler and Groot examine informational trust in the context of volunteered geographic information datasets in OpenStreetMap. Informational trustindicates how much a particular feature can be trusted based on its editing history and assessment of quality (Keẞler& de Groot, 2013). They consider the following parameters as indicative of trust: version history, amount of users editing a feature, edits made nearby the feature in question, corrections to tags, and number of times a feature has been reverted to a previous version. A ranking of the parameters is then used to assign trust.
Garijo et. al., identify that it is important to have geospatial provenance in order to determine trust about geographic data. They specifically focus on the context of content trust. A set of questions is developed in regards to geospatial provenance, that the user can ask his or herself in order to evaluate the provenance data and decide on trust (Garijo et al., 2014).
Malaverri examines trust in a geospatial context in relation to quality. Trust in a source and trust in the temporality of the data are given a normalized range [0,1] in relation to an Agent and Artifact (Malaverri, 2013). Provenance of geospatial data is used to help determine the quality of the data. The trust scores used to help determine quality are subjectively assigned by experts based on their opinions of the data (Malaverri, 2012). Special consideration is given to aspects of geospatial quality in Malaverri’s model, incorporating aspects from FGDC metadata to help determine this.
Trust in geospatial linked data is also an area of interest. Harth and Gil propose that because geospatial data can be integrated into one object from different sources, that the provenance of each data item is necessary to determine content trust. Granularity of the
provenance recorded and the temporal aspect of geospatial data are of particular need in evaluating trust of a given dataset (Harth & Gil, 2014). From the following articles, it can be gathered that provenance is an integral part to determining trust. Provenance has not only proved valuable to determining trust of content on the web, but also offline as well (Moreau, 2013). After provenance has been collected and trust defined, the next step is to evaluate or estimate the trust for a particular workflow or data item. One of the ways in which this has been done outside of the geospatial context is to use Hidden Markov Models.
2.5. Hidden Markov Model
Hidden Markov models (HMM) have been used in a variety of applications such as speech recognition, finance, engineering, and computer science. A Hidden Markov model is a Markov chain model with a sequence of unobservable states. The Markov property must be met in order for this to be used. The Markov property can be defined as a stochastic process that can be thought of as memoryless. Another way to phrase this is that the future state of the model depends only on the present state of the model (Ramachandran & Tsokos, 2015). For example, equation (1) represents a first order Markov chain as:
P(qt=Sj|qt-1=Si,qt-2=Sk…) = P(qt=Sj|qt-1=Si) Equation 1: Markov property (Rabiner, 1989).
Where qtis the current state at time t, and S is a set of discrete finite states {Sj,Sk,Si}. A Markov chain can represent a discrete or continuous sample space and can also represent a discrete or continuous time series. Which technique is selected is dependent upon the subject being modeled. In addition to determining discrete or continuous, the class of model must be chosen. Ergodic Markov chains are Markov chains in which every state can be reached from all
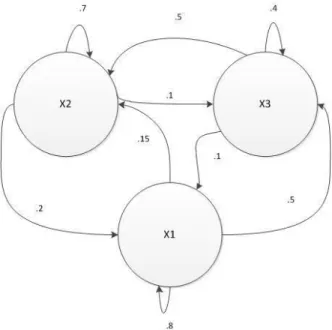
states in the model, which will most likely contain a small number of states if modeling a finite state space (Cappé et al., 2005). An example of an Ergodic Markov chain is shown in Figure 2.
Figure 2: An example of an ergodic Markov chain
A regular Markov chain can be an ergodic Markov chain however not all ergodic Markov chains are regular. A regular Markov chain has a transition matrix, A, which when multiplied to some power n, yields a transition matrix with all positive entries (Elizade, 2006). The other major class of model is a left-to-right Markov chain. A left-to-right Markov chain begins in an initial state, moves through the intermediate states to the right based on its transition matrix, however it cannot go backwards towards a previous state, and ends in an absorbing final state (Cappé et al., 2005).
The previously mentioned properties for Markov models also apply to HMMs. There are additional parameters that are required for a HMM. HMM have two states and three probability distributions that must be specified. There is the physically observable sequence which can be thought of as the data that is the output of the hidden state. For a discrete space HMM, this
observable sequence can be described as V={v1,v2,v3…vM}. Where V is the observation at time t, and M is the number of observations for the model (Rabiner, 1989). The series of states that produce the observations for the model are hidden and therefore unobservable, except for the output observations V. The set of hidden states can be modeled by the number of states the model is composed of such as S={s1…sN}, with N being the total number of states (Rabiner, 1989). The three probability distributions that must be calculated are the initial probability distribution, the transition probability distribution, and the emission probability distribution which are in the form of matrices.
The initial probability distribution is the probability that the model starts in a specific hidden state. This can be modeled by equation (2).
πi=P(q1 = Si) 1 ≤ i ≤ N
Equation 2: Probability of initial starting states (Rabiner, 1989).
Where q1 is the initialization time and Si is a given state from S. The transitional probability distribution is the probability one state will transition to another state or state in its current state, based on the HMM used. The size of this matrix is dependent upon the number of states in the model. The transition probability distribution A is shown in equation (3):
A = {aij} = aij = P(qt+1=Sj|qt=Si) 1≤i,j≤N Equation 3: State transition matrix (Rabiner, 1989).
Therefore the probability of a state transitioning to another state is the conditional probability of its current state Si transitioning into state Sj. If the transition matrix remains constant for each time state t, then the HMM is stationary. The emission probability matrix represents the
probabilities of, given the current observable state, the probability of the hidden state. This can be represented by equation (4).
Bj(k) = P(vkt|qt=Sj) 1 ≤ j ≤ N, 1≤k≤M
Equation 4: Emission probability matrix (Rabiner, 1989).
Where the emission probability of observing Vk at time t, is conditional on the probability of hidden state Siat time qt. This study will make use of various aspects discussed in the Hidden Markov model section, the trust section, and the provenance section. Details on the methods used in this study are given below.
3. Methods
The following section discusses the methods used in this study in detail. Open source, freely available, or trial versions of data and software are used in this study in order to make its replication more widely available to users. Techniques used are discussed in detail within the body of this work. Code used as well as additional data are available in Appendices A-F.
3.1. Software & Hardware
ESRI's ArcGIS ArcMap 10.2.2 software was selected to complete the geoprocessing tasks. ESRI provides a student trial edition of their ArcMap software. At the time of this study, a 60 day trial version is available to the public (ESRI, 2015). To compose the workflows and generate the initial Python script ArcGIS ModelBuilder10.2.2 was used. Notepad ++ v 6.6.8 was used as the primary text editor for making changes to the python scripts. Python 2.7.5 was the programming language and version used, and the scripts are executed through Python’s built in
integrated development environment (IDE). It is important to note that the scripts used in this study are not compatible with Python version 3 or greater. LXML Python package was used to generate the extensible markup language (XML) used to store workflow provenance. RDFLib is a Python package that was used to store workflow provenance as resource description framework (RDF). MySQL 5.6 was used to store and query each workflow’s provenance. R version 3.13 was used for the statistical calculations. The R package HMM was used to run the Hidden Markov models used in this study. The software was run on Microsoft’s Windows 8 operating system. The hardware used in this study was an Asus X551 laptop with an Intel I3-3217U CPU at 1.80 GHZ, 4 GB of RAM, and 500 gigabytes of disk space.
3.2. Initial Workspace
Each workflow was given its own folders and .mxd document for use. For each workflow a file geodatabase was created containing input, intermediate, and output folders. Within the geodatabase, a toolbox and model were initialized. All available extensions within ArcMap were turned on in order to access the full range of ArcMap’s functionality. ArcMap’s log file for geoprocessing was also enabled at this point. However, this log file was not actually used in the study, beyond the initial comparison of determining if it was adequate for provenance collection. Once that determination was made, the log file was left enabled as a backup log, in case
provenance collection failed.
3.2.1. Data
Geospatial data is composed of two main types, raster and vector data. A raster dataset is composed of pixels, with each pixel representing a spatial dimension and containing a value
representing real world objects detected by the sensor (Faust, 2008). Vector data is composed of lines, points, and polygons representing real world objects (Fause, 2008).
Workflows used in this study contained a mixture of raster and vector data layers. Imagery was obtained from Landsat 8 via the USGS Earth Explorer. Digital elevation model (DEM) data was obtained from the National Elevation Dataset from the USGS. Vector data was downloaded from the Arkansas GIS Office’s, formerly GeoStor, data repository. In addition to these data sources, additional data was used from the ArcGIS ArcTutor Spatial Analyst tutorial. This tutorial data included both raster and vector layers. Related data was stored in its own directory, under a file geodatabase in ArcMap using ArcCatalog.
3.3. Workflow Creation
Three example workflows were created for this study. These workflows represented real world use cases of geospatial data and the methods used to analyze it. Each workflow used was defined as simple, intermediate, or advanced. These terms do not indicate complexity of the workflows goal, the users experience level, or the computational power required to execute each tool, rather they refer to number of processes that were executed in each workflow. Model Builder's GUI was used to drag and drop layers and tools to create the initial workflows. The workflow was created by initiating a new ToolBox, and within that ToolBox creating a new model in the same directory that the map document was stored in.
The simple workflow contained four processes. The goal of this workflow was to calculate NDVI for April 23, 2014 in Damascus, Arkansas. This workflow can be observed in Figure 3.
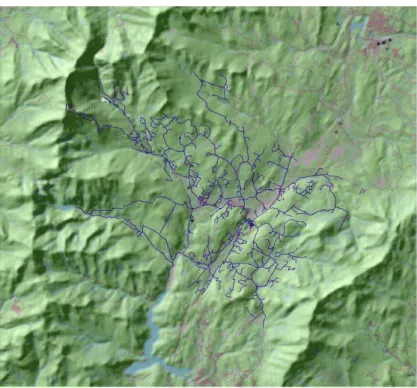
Figure 3: Simple Workfllow - NDVI workflow composed in ModelBuilder. The final output of the simple workflow is shown below in Figure 4.
Figure 4: Simple workflow’s final output showing calculated NDVI for Damascus, Arkansas and neighboring area.
The intermediate workflow was developed for exploring the hydrology of the area of Van Buren County Arkansas. This workflow was composed of eight processes. Each process is a hydrologic tool in ArcMap. The intermediate workflow can be observed in Figure 5.
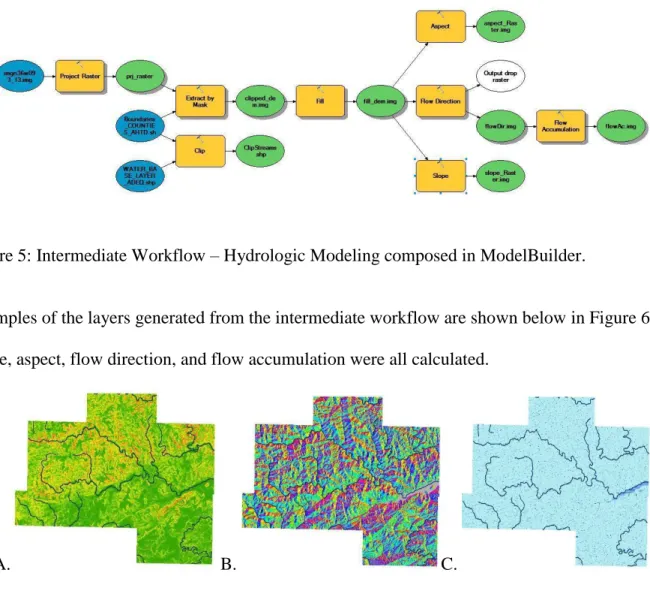
Figure 5: Intermediate Workflow – Hydrologic Modeling composed in ModelBuilder.
Examples of the layers generated from the intermediate workflow are shown below in Figure 6. Slope, aspect, flow direction, and flow accumulation were all calculated.
A. B. C.
Figure 6: A) Derived and clipped slope layer from intermediate workflow including streams. B) Derived and clipped aspect layer from intermediate workflow including streams. C). Derived and clipped flow accumulation layer from intermediate workflow including streams.
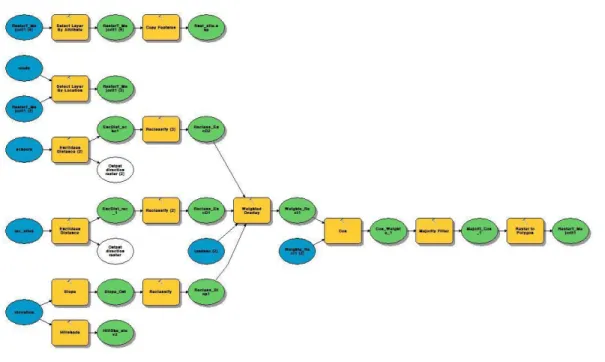
The advanced workflow was composed of sixteen processes. The goal of this workflow was to select the optimal site for a new school. The advanced workflow can be viewed in Figure 7.
Figure 7: Advanced Workflow – Optimal site selection composed in ModelBuilder The original model only contained fourteen processes, however when the model was exported as a Python script an additional two processes were added in order for the script to work correctly. Both added processes were the Make Feature Layer tool. The advanced workflow was based off of the spatial analyst tutorial from ArcTutor (ESRI, 2010). The final output of the executed model is shown below in Figure 8.
Figure 8: Final output of the advanced model showing the optimal site as light blue. There are several options for running a model produced in ModelBuilder. The model may be executed by running the entire model at once, running each process individually by clicking, or by a python script. When the entire model is run at once, an XML log file is generated and stored in the ArcToolbox/History directory on the local machine. This log file contains execution history for the model. At first glance, this automatically generated log file may look like enough to collect provenance from, however there is at least one issue with this approach. The Raster Calculator (ArcGIS tool) operations are not stored in this geoprocessing log. If each process is run individually, a separate folder will be created within the working directory, holding the geoprocessing log for each object. Raster calculator does produce a geoprocessing history if executed in this way, however the log is incomplete.
The different locations for the XML processing logs and the lack of completeness, do not make either of these options ideal for collection provenance. An example of a log file that is missing Raster Calculator is shown below in Figure 9.
Figure 9: Condensed ArcGIS log file showing missing Raster Calculator/Map Algebra
A Python script of each model used can be exported from ModelBuilder. This exported Python script when run can generate the same processing log as if the model was run by manually clicking “Run Entire Model” within ModelBuilder. Special consideration must be given to the generated script in order to make sure it runs correctly, and in customization of the Python script to collect provenance information. The Python scripting option is chosen for this study due to its flexibility and extended functionality through Python libraries.
3.4. Python Script
ModelBuilder's export function was used to generate a Python script. Unfortunately some tools and features that work in ModelBuilder do not automatically work in Python. Examination of the exported script to ensure it is correct must occur. For example, raster calculator is not supported in Python and Map Algebra must be used in its place (ESRI, 2014). Geoprocesses must be stored and added to the Python script in order to generate the same log file as if the workflow is run as a model in ModelBuilder. After a script has successfully run, a detailed
processing log can be found in ArcToolbox's history folder. Not every process will be logged however. The generated XML file must be carefully checked to make sure a process has not been left off. For example, Map Algebra will not log as a tool in a python workflow and will be
missing from the XML. Due to this, each workflow’s Python script was modified to collect its own provenance.
3.5. Provenance Collection
Provenance collected in this study was at the coarse-grained or workflow level. The following were the desired data to be collected: user, tool, input, output, time begun, time ended, source, and unique id. The provenance from the workflow was collected and serialized using XML. In addition to this serialization, examples are shown on how the geospatial provenance collected can also be serialized using XML and following the PROV-XML model, as well as using RDFLib to be serialized into PROV-O. The mapping into PROV-O can be found in Table 1 in Appendix A. Provenance gathered in this study was collected at the semi-automatic level. This means that for certain portions of the script user input or user manipulation is required.
The initial provenance collection began in the ModelBuilder generated Python script. Two classes of ArcPy objects were used, the Describe object and the Result object. The Result object was created by the execution of a geoprocessing tool and contained data about that
particular geoprocess (ESRI, 2014). ArcPy’s Describe object contains functions that are useful in determining the file path or type of element used in ArcPy (ESRI, 2014). The idea to use the Describe and Result objects came from Korose’s thesis manuscript (Korose, 2010).
Korose used the Describe and Result objects to collect provenance from a carbon
sequestration workflow created in ArcGIS, by passing the collected provenance to a MySQL RDF store using RDFLib. Whereas Korose used RDF and the Open Provenance Model, this study used the XML serialization of PROV-XML recommendation. In addition, PROV-O was used as an example of how to show provenance in an RDF serialization. However, most of the actual processing of the data was done using the PROV-XML format. This was done because the LXML Python library for use with XML was easy to learn and implement.
Functions were created in Python to parse the Result and Describe objects generated by the execution of the Python scripts. In order to parse each tool, the line of code was converted into a string in the next line. If a tool was not logged as a geoprocessing object, i.e. Map Algebra, its provenance was collected by using functions specific to that tool. This was a semi-automatic process done by calling the function before each tool in the workflow.
Figure 10: Functions written to collect provenance for non-geoprocessing tasks in ArcPy. The item returned by the function was then stored in a list which corresponded to the type of provenance it contained, i.e. input, output, start time, and so on.
Once the provenance data was stored in its corresponding list, three functions may be called depending on the desired serialization of the workflow’s provenance; generateXML,
generateProvXML, and generateRDF. The generateXML function serialized provenance into XML, similar to ArcGIS’s log file. The generateProvXML serialized provenance into XML with defined namespaces.
Figure 11: A portion of the function generateProvXML().
The LXML library allowed for the use of Python to generate or parse XML, HTML, and XSLT (lxml, 2015). The ElementTree module was imported in the Python script. The Element object contained the root node for the XML document and the SubElement object contained subnodes. A while loop was created to iterate over each item in the tools list, thus creating a subelement which contained the provenance for each process. The datetime module was
imported and used to name each XML file. This ensured that each provenance file had a unique file name that also refers to the date and time of its creation. The file was then written to the working directory as XML.
3.6. Provenance as PROV-XML and PROV-O
The function for generating PROV-XML is similar to the function generateXML. The generateProvXML function included the addition of a dictionary to hold the uniform resource identifiers (URI). A URI was used to uniquely identify the location or name of a resource (W3C, 2001). The QName class in LXML was used to create a qualified XML namespace (lxml, 2015). The namespace ‘RL’ was defined to hold terms specific to GIS, such as input layer and output layer. This URI is not resolvable on the web, however if so desired could be using HTTP. Dublin Core vocabulary is also used to describe the provenance data created.
Figure 12: XML document following PROV-XML specifications.
RDF/XML was created by adding the rdf:RDF namespace tag and the rdf:Description tag for each subelement. For this study, the change was done manually however it could easily be accomplished using LXML or RDFLib. When the RDF tags have been added, RDFLib can then be used to parse and serialize the RDF/XML (PROV-XML) into other serializations of RDF such as N3 or Turtle (PROV-O).
3.7. Provenance Storage
During the generation of provenance as an XML file from the generateXML function, a .csv file was also generated with the csvBatch() function. This function collected the provenance as a comma separated values file that was then uploaded to Excel for data cleanup. Once the data was
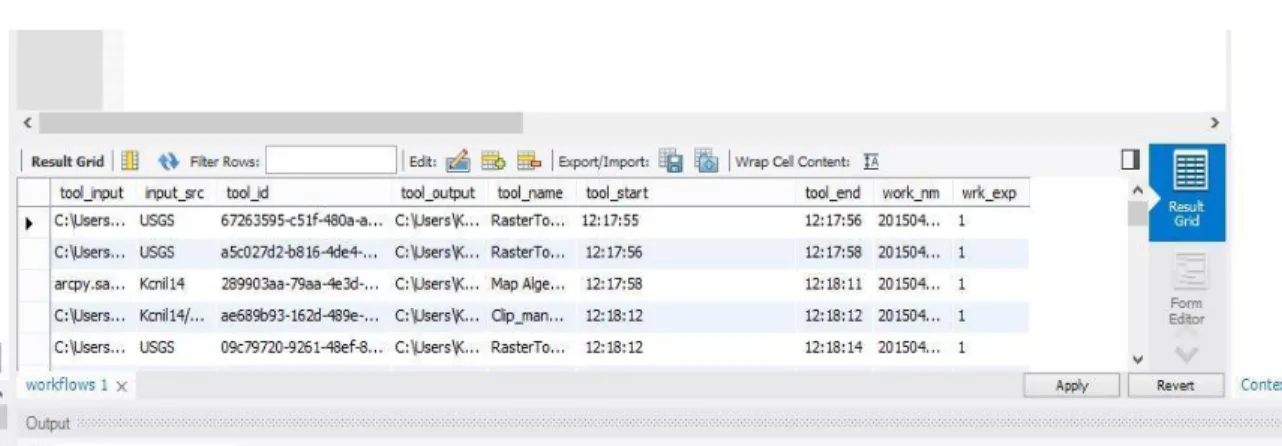
cleaned up in Excel it was batch loaded into a MySQL database for query. An additional column value was added for the database called wrk_exp. This category recorded the workflow level each process belonged to. The simple workflow corresponded to 1, the intermediate to 2, and the advanced to 3.
Figure 13: MySQL database for querying provenance
The provenance was queried by using SQL. For example if a user wanted to discover which workflows used the Clip tool, this could be done with the following statement:
SELECT * FROM Workflows WHERE tool_name LIKE '%clip%'
This statement returns every instance of a tool name that contains clip. In the case of this database it returns both clip analysis and clip management.
Additional tables could then be created to store data that can be used to determine a workflow’s trust.
3.8. Trust Score Assignment
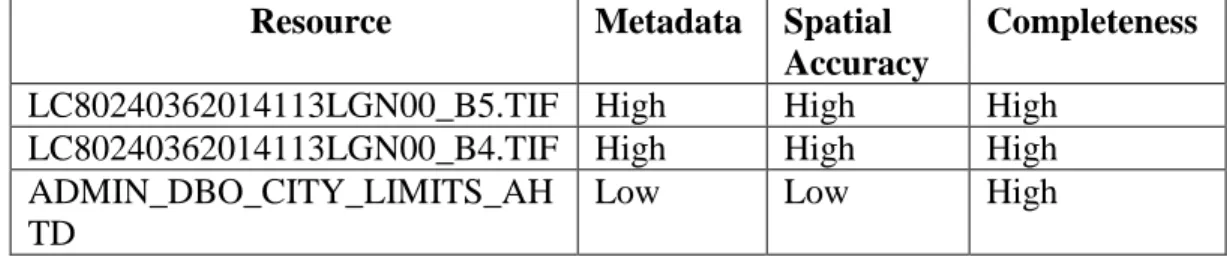
The second part of this thesis used the provenance collected to calculate a trust measurement from each example workflow. When examining trust it is important to define which type of trust will be used. This study focused on measuring two types of trust relevant to workflows, content trust and workflow trust. Content trust is the trust in the information or content of a given resource that is located either online mapped by a URI or offline in possession of the user (Gil & Ratnakar, 2002). A ModelBuilder workflow’s content can come from online via HTTP or FTP download or offline, via user generated data. For each step in the workflow, the shapefiles and imagery used as inputs were evaluated. In addition to shapefiles and imagery, feature layers, tables, intermediate layers, or anything used as an input for a particular service in a workflow was evaluated for content trust. Overall content trust for a workflow was also
evaluated. In the case of content trust, the performance of the tools comprising a workflow is not evaluated, only the data used in a workflow and the selection of tools used in the workflow. The measure of content trust is therefore more subjective in nature. Content trust is determined based upon a user’s perceptions of the content. Therefore, different users could evaluate the same data item and obtain two very different content trust scores.
Workflow trust was evaluated differently compared to content trust. Workflow trust can be defined as a measure of trust for each tool or service composing the workflow, approximated by the execution status, availability, and reliability of each tool (Naseri, 2013). Workflow trust in this aspect was not focused on the content comprising the workflow, but rather was concerned