(JETDE)
Volume 5 | Issue 2
Article 7
6-2012
An Educational Data Mining Model for Online
Teaching and Learning
Jui-Long Hung
Kerry Rice
Anthony Saba
Follow this and additional works at:
http://aquila.usm.edu/jetde
Part of the
Instructional Media Design Commons
,
Online and Distance Education Commons
,
and the
Other Education Commons
This Article is brought to you for free and open access by The Aquila Digital Community. It has been accepted for inclusion in Journal of Educational Technology Development and Exchange ( JETDE) by an authorized editor of The Aquila Digital Community. For more information, please contact
Recommended Citation
Hung, Jui-Long; Rice, Kerry; and Saba, Anthony (2012) "An Educational Data Mining Model for Online Teaching and Learning,"
Journal of Educational Technology Development and Exchange (JETDE): Vol. 5 : Iss. 2 , Article 7. DOI: 10.18785/jetde.0502.06
an educational data Mining Model for
online teaching and Learning
Jui-Long hung Kerry rice anthony saba Boise State University
abstract: This study contains two major parts. First, this study proposed a generic model for Educational Data Ming (EDM) studies by reviewing EDM literature and the existing data mining model. Second, the procedures of the EDM model are demonstrated with a case study approach. The case study results showed patterns and relationships discovered from the EDM model that could be applied to improve online teaching and learning and to predict students’ academic performances.
Keywords: education data mining, educational data mining model, clustering, association rules, decision tree
1. introduction
As online education aims to provide more customized learning, online instructors need information for generating personalized advice (Tai, Wu, & Li, 2008), identifying struggling students (Ueno, 2006), adjusting teaching strategies (Talavera & Gaudioso, 2004), and improving course design (Hung & Crooks, 2009). Each of these needs can be addressed by mining learners’ behavioral activities through data mining techniques.
Data mining (DM) is a series of data analysis techniques applied to extract hidden knowledge from server log data (Roiger & Geatz, 2003) by performing two major tasks: pattern discovery and predictive modeling (Panov, Soldatova, & Dzeroski, 2009). Pattern discovery involves extracting
unknown interesting patterns. For example, online instructors can utilize pattern discovery techniques to classify students based on their shared learning preferences, to identify outlier students, and to depict the frequent navigational paths in the course. Predictive modeling involves analyzing current or historical facts to make predictions about future events. For example, online instructors can utilize predictive modeling techniques to identify key predictors of students’ academic performance and then interventions can be developed for performance improvement.
Related techniques have been widely used in business fields, especially in e-commerce, for providing personalized business services (Ngai, Xiu, & Chau, 2009), identifying potential customers (Zhang, Edwards, & Harding, 2007), adjusting marketing strategies
(Levin & Zahavi, 2010) improving Website design (Asllani & Lari, 2007), and more. Modern online education relies heavily on learning management systems (LMS) or course management systems (CMS). These LMS/CMS automatically record navigational behavior of individual users as server logs. By mining these server logs, teachers are able to provide personalized instruction, to identify potential at-risk students, to adjust teaching strategies, to improve course design, and more. However, Educational Data Mining (EDM, hereafter) is faced with special challenges due to the dynamic characteristics of e-learning in five aspects:
Behaviors: Learning behaviors are complex, including different types of interactions (content, student-student, and student-instructor) and varied sequences of learning interactions (Hung & Crooks, 2009; Hung & Zhang, 2008; Pahl, 2006).
Target variables: The most common target variable in e-commerce studies is buying or not buying. In e-learning studies however, a common target variable is learning outcomes or performance (Romero, Ventura, & Bra, 2004), which require a rather wide range of different assessments and indicators.
Goals: The major goal of data mining in e-commerce is to increase profit, which is tangible and can be measured quantitatively. On the other hand, the major goal of data mining in e-learning is to improve online teaching and learning, which might be hard to measure or quantify (Romero &Ventura, 2006). Techniques: With different behaviors, target variables, and goals, only specific data mining techniques are suitable for •
•
•
•
analyzing educational questions (Pahl, 2006; Romero, &Ventura, 2006). In addition, data for EDM need different modifications from e-commerce studies. Data collection: Only interactions which occurred in LMS/CMS can be tracked. However, a great deal of learning might occur outside the LMS.
Currently, all EDM studies follow a generic data mining model constructed by statisticians and database researchers. Because a model provides “conceptual and communication tools that can be used to visualize, direct and manage processes for creating high quality instruction. Models also assist us in selecting or developing appropriate operational tools and techniques as we apply the model” (Gustafson & Branch, 2002, p. 1), a customized model for EDM is necessary for the following reasons:
Provide a generic procedure for EDM studies—EDM is a relatively new field in educational settings. Scholars, especially educators, who do not have backgrounds in machine learning, need a generic procedure for research guidance.
Consider the unique characteristics of EDM—Because of the unique characteristics of EDM, the current model needs to be customized for educational purposes. Construct a framework for creating embedded analytic tools—Today, automated decision support systems are widely used. The model can work as a framework for creating embedded analytic tools.
2. Purpose of the study
The purpose of this study was to propose a customized model to guide the analytic processes of EDM. The paper will (a) examine
•
•
•
the EDM review literature, (b) propose an EDM model based on that literature review and the existing data mining model, and (c) demonstrate the procedures of the EDM model by analyzing two fully online courses.
3. examination of edM studies
This section will discuss three review articles which discussed trends and state of art in EDM Research. Romero & Ventura (2007) reviewed 81 EDM articles from 1995 to 2005. The same authors extended the review to 2009 and the number of articles increased to 306 (Romero & Ventura, 2010). The authors grouped these 306 articles into 11 categories:
Analysis and Visualization of Data Providing Feedback for Supporting Instructors
Recommendations for Students Predicting Students’ Performances Student Modeling
Detecting Undesirable Student Behaviors Grouping Students
Social Network Analysis Developing Concept Maps Constructing Courseware Planning and Scheduling
The authors suggested that future EDM research focus on the following aspects: (a) make EDM tools easier for educators and non-expert users; (b) integrate EDM tools with the e-learning system; (c) standardize data and models; and (d) customize traditional mining algorithms for an educational context.
On the other hand, Baker &Yacef (2009) conducted a review on the top eight most cited articles in 2005 and the Proceedings of EDM’08 and EDM’09 conferences. The authors summarized the most popular EDM methods: (a) Prediction, (b) Clustering, (c) Relationship mining, (d) Distillation of data for human judgment, and (e) Discovery
• • • • • • • • • • •
with models. The first three categories are traditional data mining methods. The fourth and fifth categories are research approaches, which involve the combination of data mining methods with traditional statistical methods, data visualization, human judgment, and educational models.
This study addresses Romero & Ventura’ s first and third suggestions by developing a more accessible, standardized model for educators and non-expert users. Baker &Yacef’s (2009) review categorized which EDM methods in the past few years were most popular. Because the first three categories they identified utilize traditional data mining tools and methods, these methods will be included in the proposed EDM model. Researchers can conduct fourth and fifth category studies if they are familiar with traditional statistical methods and educational theories.
4. data Mining Model
The term “data mining” is used most by statisticians and database researchers. It represents the application of specific algorithms for extracting patterns (models) from data. It is a particular step in Knowledge Discovery in Databases (KDD) (Fayyad, Pitatesky-Shapiro, &Smyth, 1996). Therefore, researchers usually follow the KDD process when conducting data mining studies. The KDD process includes the following major steps (Fayyad et al., 1996): (a) identifying the goal and creating a target dataset, (b) data preprocessing, (c) data transformation, (d) data mining, and (e) interpretation and evaluation. 5. edM Model
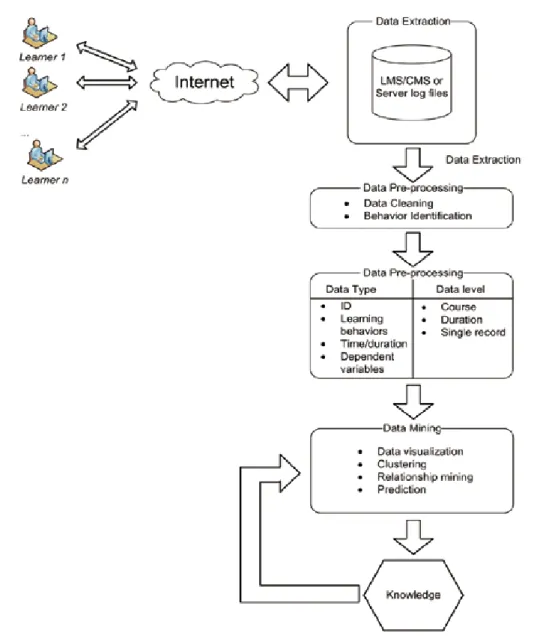
Figure 1 is a model proposed for EDM in this study. The model was derived from the KDD model and EDM review literature review.
Figure 1. The EDM model
5.1. Data Source and Data Extraction
Based on Romero & Ventura (2010) and Backer &Yacef (2009), EDM data can be collected from the following sources:
LMS’s activity logs—Currently, most online courses are hosted in Learning
Management Systems. These platforms, such as Moodle and Blackboard, record students’ activity logs in the database. This provides online instructors and researchers convenient instruments for data collection.
Server Logs—A Web server usually keeps logs of server activities. If course materials
are hosted on a Web server, server logs are another possible source of data.
Public Data—The Pittsburgh Science of Learning Center has opened a public data repository. If the instructor/ researcher cannot collect data on his/her own, the center provides increasingly popular free access to these cleaned datasets.
5.2. Data Pre-processing
The data pre-processing stage includes two steps: data cleaning and behavior identification. This is to remove all useless, irregular, or missing records, and to identify learning behaviors from logs.
5.2.1. Data cleaning. What is considered “useless data” may change depending on the purpose of the study. In common educational settings, the following data would be considered for filtering out at this step:
1. Entries which were beyond the data collection period.
2. Entries that had status of error or failure such as login failure.
3. Server log data containing requests for associated files such as images, videos, animations, javascript, and cascade style sheets.
5.2.2. Behavior identification. The major goal of this step is to define useful learning behaviors from the collected data and associate them with the rest of the variables such as identifiers and time stamps. The case study below will provide one possible example of defined learning behaviors.
5.3. Data Transformation
In the data transformation stage, variables are aggregated for analysis. Four types of variables—IDs (e.g. user ID or course ID), learning behaviors (e.g., reading materials or posting discussions), time/duration (e.g., time stamp/duration), and dependent variables (e.g., grades or pass/fail)—are suggested for three levels of accumulation (Lv1: Course, Lv2: Duration, and Lv3: Single record). Table 1 recommends variables and aggregation levels
Table 1. Data Types and Levels at the Data Transformation Stage
Type Lv1: Course Lv2: Duration Lv3: Single Record
ID StudentID
CourseID StudentIDCourseID WeekID DayID
StudentID CourseID
Learning
Behaviors Frequency of learning behaviors Frequency of learning behaviors on duration basis Individual learning behaviors Time Time spent in course
level Time spent in duration level Time stamp of individual learning behaviors Dependent
5.4. Data Mining
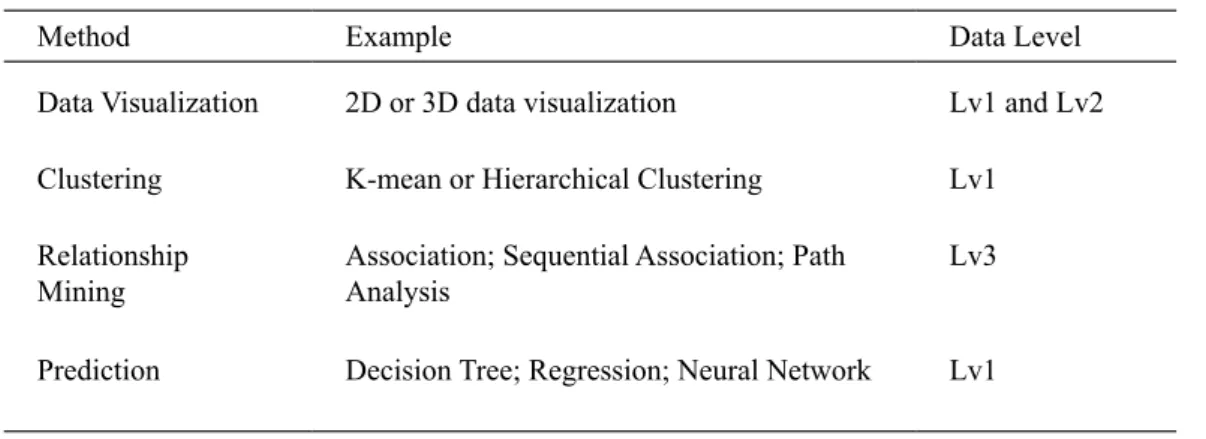
Based on purposes of the study, techniques of pattern discovery and predictive modeling are applied to data analyses. Table 2 recommends data mining techniques and data levels at this stage.
Table 2. Data Mining Techniques and Data Levels at the Data Mining Stage
Method Example Data Level
Data Visualization 2D or 3D data visualization Lv1 and Lv2
Clustering K-mean or Hierarchical Clustering Lv1
Relationship
Mining Association; Sequential Association; Path Analysis Lv3
Prediction Decision Tree; Regression; Neural Network Lv1
5.5. Evaluation/Interpretation
Finally, valuable rules and patterns are discovered through data interpretation and evaluation. Through data triangulation, domain experts evaluate and identify interesting rules and patterns for decision-making. If the results are not deemed valuable, stages of data mining and data interpretation and evaluation are repeated. 6. Case study
The following case study demonstrates how the EDM model can be applied in online educational settings. The case study was guided by the proposed EDM model, showing how it can provide information for the following purposes:
A. Generate personalized advice (Tai, et. al., 2008)
B. Identify struggling students (Ueno, 2006)
C. Adjust teaching strategies (Talavera & Gaudioso, 2004)
D. Improve course design (Hung & Crooks, 2009)
6.1. Data Source
Data were collected from an online graduate program at a Northwestern University in the USA. The program offers approximately 20 graduate-level courses, hosted in Moodle (an open-source Learning Management System) each semester. In order to compare learning patterns (within and between courses), two graduate courses (X and Y) were selected randomly for data analysis. Each course had two separate sections (X1: 18 students; X2: 19 students; Y1: 18 students; Y2: 22 students).
6.2. Analytic Tool
SAS (Institute Inc., Cary, NC, USA) Enterprise Miner 6.1 was employed to conduct data mining in this study. SAS EM provides a series of tools in the categories of sample, explore, modify, model, access, and utility to streamline the data mining process and perform pattern discovery and predictive modeling.
6.3. Data Extraction
The data for mining were collected from Moodle activity logs over the course of one semester. Because these logs contain personal information, the authors cannot include a screen shot of these activities logs; however, a sample screen shot can be found on the Moodle site: http://docs.moodle.org/20/en/Logs. A total of 2,744,433 activity logs in the target courses were extracted from the LMS at this stage.
6.3 Data Pre-processing
The purpose of data-preprocessing is to delete redundant information from raw server logs and to form appropriate datasets for data mining. In the EDM model, the major steps of data pre-processing include data cleaning and behavior identification.
6.3.1. Data cleaning. These raw logs contain a whole semester’s requests from all authorized users (including instructors and students). However, not all of the log entries are useful data for analysis. Based on the purposes of this case study, the following logs were removed, with a total of 195,933 logs kept for behavior identification after data cleaning.
1. Entries which were beyond the semester period (1/19/2010-5/9/2010)
2. Entries from non-students.
6.3.2. Behavior identification. Appendix A lists all behavioral variables for this study. Each of the behavioral records was associated with a time stamp and a user ID. A target variable, each student’s final grade, is also associated with the student ID.
6.4. Data Transformation
The previous steps collected users’ requests into the four primary variables: user ID, session ID, learning behaviors, and
time stamp of individual learning behaviors. Derived variables were generated by calculating or accumulating primary variable data on a varying duration basis to three levels of datasets. Appendix A lists example fields in all three levels.
6.5. Data Mining
This case study applied the following data mining techniques in the EDM model: data visualization (fourth category of Baker & Yacef (2009)’s taxonomy), clustering (second category), path analysis (third category), and decision tree (first category).
6.5.1. Data visualization (level 1 and level 2)
The purpose of data visualization is to construct an overview of how all students were doing in a given timeframe. Processed data can be visualized through graphics. The graphical display also illustrated basic tendencies, distributions, and group information at a glance. Such an overview is necessary for gaining a better understanding of how to apply further data mining techniques. In the EDM model, course level (lv1) and duration level (lv2) datasets are suitable for data visualization. Figure 2 is an example at the course level. Figures 3 and 4 are examples at the duration level.
Figure 2 (Lv1) shows daily patterns of activity frequency by week for all four target courses. In the case study, courses X1 and X2 are the two sections of course X and courses Y1 and Y2 are the two sections of course Y. Figure 2 reveals the following results: (a) X1 students were more active than students in X2, and (b) assignments for all courses were due on Tuesdays. Courses X2, Y1, and Y2 show higher activity frequencies than the other days. However, students in X1 preferred to work one day before the assignment was due.
Figure 2. Weekday patterns of courses Figure 3 (Lv2) includes four students
(S1, S2, S3, and S4) randomly selected from X1. The results show that S1 and S3 shared similar activity patterns. S2 is significantly more active than the other three students and
preferred to work ahead. The frequency of S4 is similar to S1 and S3. However, S4 showed different learning preferences from the other two students.
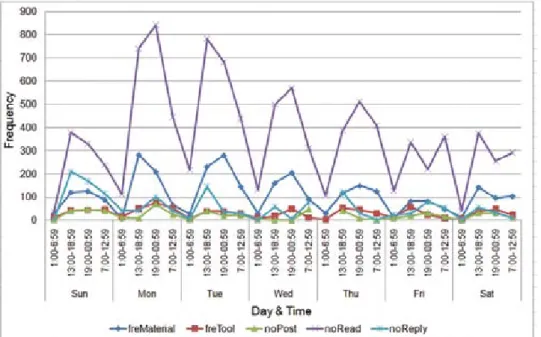
Figure 4 (Lv2) illustrates the activity patterns of course X1. The following behaviors—frequency of course pages accessed, number of discussions read, number of discussions posted, number of discussions answered, and frequency of tools accessed— were accumulated on different time sections and days of the week. The results revealed the following behavioral characteristics: (a) reading is the major activity because reading posts and materials are the top two most frequent behaviors. In addition, these two
behaviors showed similar patterns, which indicates that when students read course materials, they will read discussions too; (b) Sunday is the most popular day for replying to discussions; and (c) most learning behaviors occurred on Monday and Tuesday, and between 13:00 and 00:59.
Although individual students and courses might show different activity patterns (Figures 2 to 4), the results indicate that assignment due dates influenced overall learning activities.
Figure 4. Weekday and time patterns of different learning behaviors for X1
6.5.2. Clustering
Clustering algorithms were used to categorize students into homogeneous groups. K-means clustering techniques were applied to group students based on their shared characteristics: learning preference, time, duration, frequency, and learning performance. This method was based on distance concepts
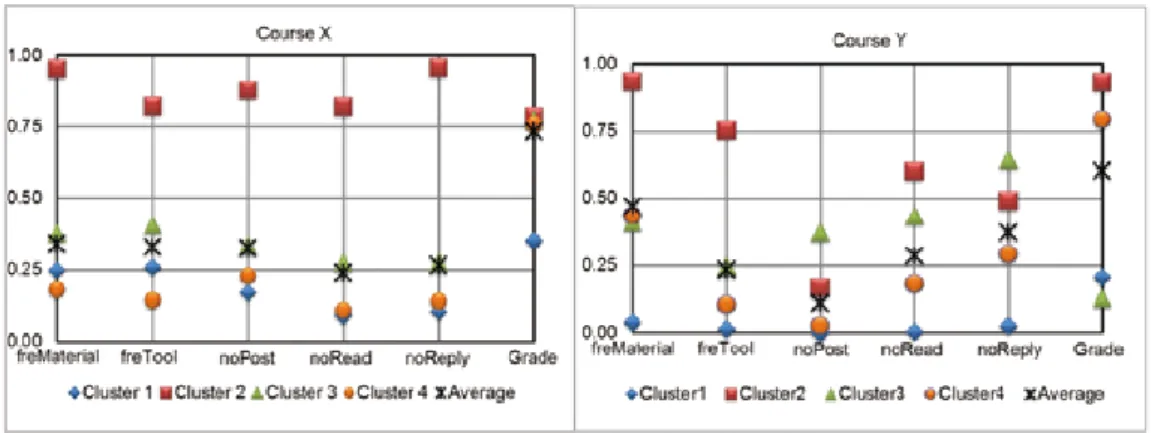
among individual participants, and was intended to gather individuals who were “close” into the same group for further analysis (Roiger & Geatz, 2003). Figure 5 compare students’ learning characteristics for courses X (X1 + X2) and Y (Y1 + Y2), in terms of frequency of course material accessed, frequency of “tools” link accessed, number of discussion posted, number of discussions read, number
of discussion replied, and final grade. In order to compare results, the cluster number was limited to four. Because highly skewed data will influence the results of clustering analysis, normalization methods were applied to the highly skewed fields.
To display relationships of all clusters, the min-max normalization was applied to transform all values between 0 and 1 (Jain, Nandakumar, & Ross, 2005).
The left diagram in Figure 5 shows shared student characteristics for course X. The data in Cluster 1 (3 students) indicate a relatively low level of engagement (frequency of course materials accessed: 0.25, frequency of tool links accessed: 0.26; number of discussion posted: 0.17; number of discussion read: 0.09; number of discussion replied: 0.1) which resulted in lower performance (final grade: 0.35). The data in Cluster 2 (3 students) indicates relatively higher level of engagements (0.95, 0.82, 0.88, 0.82, and 0.96 accordingly) which resulted in higher performance (0.78). Data in Cluster 3 (17 students) represents students who are around
average on all indicators (0.38, 0.41, 0.34, 0.27, 0.28, and 0.77 accordingly). Cluster 4 (14 students) are efficient students who have lower engagement level (0.18, 0.14, 0.23, 0.11, and 0.14) with higher learning outcomes (0.76).
The right diagram in Figure 5 reveals the following characteristics of course Y. Cluster 1 (2 students) are relatively low-engaged students (0.04, 0.01, 0, 0, and 0.02 accordingly), which resulted in lower performance (0.2). Cluster 2 (23 students) are relatively high-engaged students (0.93, 0.75, 0.17, 0.6, and 0.49), which resulted in higher performance (0.93). The other two groups (Cluster 3, 13 students and Cluster 4, 2 students) are of particular interest for doing research and adjusting teaching strategies. Cluster 3 represents students who need further facilitation. They are relatively high engaged (0.41, 0.25, 0.38, 0.44, and 0.64 accordingly), but their performances are the lowest in the course (0.13). Group 4 students are high performers (0.79) with low discussion participation (noPost: 0.3, noRead: 0.18, and noReply: 0.29). Based on results, these students are more efficient than other students in the class. Further investigations on critical thinking and learning strategy might help to improve the data interpretation.
Based on the results of Figures 5, clustering analysis provides an overview of students’ learning profiles, identifies interesting groups for further analysis, and suggests possible teaching strategy adjustments.
6.5.3. Association rules
Path analysis is one of the association rule techniques for analyzing data to determine the most frequent sequential paths taken by users within one session. An example of association rules in this study would be “homepage view => material view, support = 12.87%, confidence = 25.36%”. Support, in the association rule, means the percentage of observed events out of total events. Therefore, the above association rule indicates that among all analyzed events, 12.87% of them included homepage view and material view. Confidence, in the association rule, is a measure of how likely it was that material view would follow when homepage view occurred. Statisticians refer to this as the conditional probability of material view given homepage view. Therefore, the above association rule indicates that when the homepage view was observed, there was a 25.36% chance that users would view the course materials. In this case study, path analysis technique was applied to find sequential relationships among learning behaviors in order to construct the most frequent learning patterns.
In order to conduct path analysis, all learning variables in appendix A were imported into path analysis. The link graphics (Figure 6) display association results by using nodes and links. The default size of a node indicates the behavior counts in the association rules (support). Larger nodes have greater counts than smaller nodes. The thickness of links between nodes indicates the confidence level of a rule. Thicker links indicate higher
confidence. In order to show frequent learning paths, rules below a 10% support rate were discarded in the results.
The left link graphic in Figure 6 shows results of path analysis for Course X. The results reveal that the course homepage is the center of course activities. The most frequent learning paths involved reading. Reading discussions and course materials are highly associated with the homepage.
The right link graph includes results of path analysis for course Y. The results revealed that students were involved in more types of interactions, including reading course materials and discussions (student-content) and posting discussions (student-student or student-teacher). The following two factors might influence how students acted in the course X and course Y.
Course structure design: The instructor of course X adopted Moodle’s topic design and students can access course components though direct links on the course home page. Conversely, the instructor of course Y adopted Moodle’ s page design and organized course components hierarchically by using drop-down menus.
Teaching strategy: Discussion grades for course X were based on discussion participation. On the other hand, students in course Y needed to work as discussion facilitators in turn. In addition, discussion grades were based on quality of discussion (via peer evaluation) and discussion participation.
According to results of figures 6, teaching strategy played a more important role on facilitating discussion participation in this case study. The influence of course structure design is less influential in this study.
•
Figure 6. The link graphic of course X and course Y
6.5.4. Predictive Models
The decision tree is a predictive model. It classifies instances by sorting them down the tree from the root to the leaf nodes (Quinlan, 1986). In the tree structures, leaf nodes represent classifications, and branches represent conjunctions of features that lead to different target values. The study applied decision tree techniques to build a predictive model for online learning performance.
Records of courses X1 and X2 are combined into a single dataset for Course X. Courses Y1 and Y2 are combined into another dataset for Course Y. The following learning behaviors—frequency of course material accessed, number of discussions read, number of discussion replied, number of discussions posted, and frequency of tools accessed—were used as independent variables. Final grades of individual students were used as the dependent variable. In order to obtain better results, students were classified into four groups based on their performance level. Two principles were applied for grouping: (1) each group should have a similar number of students, and
(2) the cut-off point must have higher Gini value (Gini coefficient, 2010). Based on these two principles, course X was grouped into XA: 11 students; XB: 8 students; XC: 10 students; and XD: 8 students. On performance levels, group XA represents students with the highest performance and group XD represents students with the lowest performance. Course Y was grouped into YA: 10 students; YB: 10 students; YC: 10 students; and YD: 10 students.
The left decision tree in Figure 7 reveals that discussion participation (reply to or post a discussion) was the most important variable for predicting the final grades of participants in course X. Students performed better if they made 27 or more replies throughout the semester. However, the results also show some lower performers had high reply numbers (larger or equal to 43). These students might have posted non-meaningful replies such as “good job” or need further facilitation. Further content analysis investigations are needed.
In addition, discussion participation shows as the most important predictor in course X. However, results show students tended to read
discussions instead of replying or posting. The instructor might consider changing the course design to facilitate discussion participation.
The right decision tree in Figure 7 shows that the number of discussions read was the most important predictor in course Y. Students who read 378 or more messages performed better than other students. Students with fewer discussions read could achieve a higher grade when they posted more replies. Seventeen students failed to complete above those two standards. However, 5 out of 17 students obtained a higher grade if they accessed course materials more frequently than the other 12 students.
B o t h c o u r s e s s h o w e d d i s c u s s i o n participation (replies and posts) as the most important behavior for predicting students’ overall performance. Courses X and Y allocated similar grade ratio on discussion participation (20% and 24% accordingly). However, the discussion grade for course X was based on participation only while the design of Course Y required small groups of students to work in turn as discussion board facilitators to encourage more meaningful discussions. The design used in Course Y improved the quality of discussion and influenced students’ behaviors (Figure 6). As a result, course Y students obtained benefits from reading discussions (Figure 7).
Figures 7. Decision trees of course X and course Y 7. Conclusions
The case study demonstrated how instructors can use the EDM model to generate information in support of decision making on online teaching and learning. The following sections conclude with authors’ suggestions and recommendations as a result of this study.
7.1. Incorporate More Learning Behaviors and External Data
The case study limited its analysis to students’ LMS behaviors. Because EDM is the process of knowledge exploration, researchers might want to include all possible learning behaviors in the first round of analysis. In
addition, external datasets such as students’ demographic data, learning preferences, and surveys could also be incorporated into analysis for data interpretation. Incorporating external factors is difficult to achieve in business data mining, but feasible in EDM.
7.2. Construct Tools and Methods for Educational Purposes
More effective mining tools, like ViSION (Sheard, Albrecht, & Butbul, 2005) and CouseVis (Mazza & Dimitrova, 2007), that integrate educational domain knowledge into data mining techniques are required. Education-specific mining techniques can help to improve instructional design and pedagogical decision making. Traditional mining algorithms need to be tuned to take into account the educational context.
7.3. Publish Textbooks in EDM
Based on the literature review, EDM is still a new field. There is no EDM textbook available for teaching and learning EDM. Publish related textbooks can promote popularity of EDM methods in both practice and research.
7.4. Utilize Educational Text Mining
In addition to encouraging students’ active engagement, meaningful discussion and critical thinking are important means for successful online learning. Traditionally, scholars or teachers rely on content analysis to evaluate the quality of text information. Content analysis of discussion board posts in this study would have helped explain the anomaly of low performers with high reply numbers in both courses. However, this method is labor intensive and time consuming. The development of text mining can save time and effort on content analysis so scholars
and teacher can focus on data interpretation. Although text mining is a part of data mining, the procedures do not fit the EDM model in this study.
7.5. Create Embedded EDM Tools for LMS
Data mining tools are normally designed more for power and flexibility than for simplicity. Most of the current data mining tools are too complex for educators to use, and their features go well beyond the scope of what an educator may want to do. Therefore, these tools need a more intuitive and user-friendly interface, with parameter-free data mining algorithms to simplify the configuration and execution, and with good visualization facilities to make their results meaningful to educators and e-learning designers.
references
Asllani, A., & Lari, A. (2007). Using genetic algorithm for dynamic and multiple criteria web-site optimizations. European Journal of Operational Research, 176(3), 1761-1777.
Baker, R., &Y acef, K. (2009). The State of Educational Data Mining in 2009 : A Review and Future Visions. Journal of Educational Data Mining, 1(1), 3–17. Retrieved from http://www. educationaldatamining.org/JEDM/images/ articles/vol1/issue1/JEDMVol1Issue1_Ba kerYacef.pdf
Fayyad, U.M., Piatetsky-Shapiro, G., & Smyth, P. (1996). The KDD process for extracting useful knowledge from volumes of data. Communications of the ACM, 39(11), 27-34.
Gini Coefficient. (n.d.).In Wikipedia. Retrieved from http://en.wikipedia.org/ wiki/Gini_coefficient
Gustafson, K. L., & Branch, M. (2002).
ed.). Syracuse, NY: ERIC Clearinghouse on Information & Technology.
Hung, J.L., & Zhang, K. (2008). Revealing online learning behaviors and activity patterns and making predictions with data mining techniques in online teaching. MERLOT Journal of Online Learning and Teaching, 4(4), 426-437. Retrieved from http://jolt. merlot.org/vol4no4/hung_1208.htm
Hung, J.L., & Crooks, S. (2009). Examining online learning patterns with Data Mining techniques in peer-moderated and teacher-moderated course. Journal of Educational Computing Research, 40(2), 183-210. Jain, A., Nandakumar, K., & Ross, A. (2005).
Score normalization in multimodal biometric systems. Pattern Recognition, 28, 2270-2285.
Mazza, R., & Dimitrova, V. (2007). CourseVis: A graphical student monitoring tool for facilitating instructors in web-based distance courses. International Journal of Human-Computer Studies, 65(2), 125-139.
Ngai, E.W.T., Xiu, L., & Chau, D.C.K. (2009). Application of data mining techniques in customer relationship management: a literature review and classification. Expert Systems with Applications, 36, 2592-2602. Pahl, C. (2006). Data mining for the analysis of content interaction in web-based learning and training systems. In C. Romero & S. Ventura, (Eds.), Data Mining in E-learning (pp. 41-56). Billerica, MA: WitPress.
Panov, P., Soldatova, L., & Dzeroski, S. (2009). Towards an ontology of data mining investigations.Lecture Notes in Artificial Intelligence, 5808, 257–271.
Quinlan, J. R. (1986). Induction of decision trees, Machine Learning, 1, 81-106. Roiger, R.J., & Geatz, M.W. (2003).Data
Mining - A Tutorial-Based Primer. Boston, MA: Addison Wesley.
Romero, C., & Ventura, S. (2006). Data
Mining in E-learning. Southampton, UK: Wit Press.
Romero, C., & Ventura, S. (2007). Educational data mining: A survey from 1995 to 2005.
Expert Systems with Applications, 1(1), 135-146.
Romero, C., & Ventura, S. (2010). Educational data mining: A review of the state of the art. IEEE Transactions on Systems Man and Cybernetics Part C. Applications and Reviews, 40(6), 601-618.
Romero, C., Ventura, S., & Bra, P. D. (2004). Knowledge discovery with genetic programming for providing feedback to courseware author. User Modeling and User-Adapted Interaction. The Journal of Personalization Research, 14(5), 425– 464.
Sheard, J., Albrecht, D., & Butbul, E. (2005). ViSION: Visualizing student interactions online. Proceedings of the 11th Australasian World Wide Web Conference (AusWeb05), Queensland, Australia, July 2-6.
Tai, D.W.S., Wu, H.J., & Li, P.H.(2008). Effective e-learning recommendation system based on self-organizing maps and association mining. The Electronic Library, 26(3), 329-344.
Talavera, L., & Gaudioso, E. (2004). Mining student data to characterize similar behavior groups in unstructured collaboration spaces. In R. Lopez de Mantaras& L. Saitta (Eds.), Proceedings of the 16th European Conference on Artificial Intelligence (pp. 17–23), Amsterdam, Netherlands: IOS Press. Ueno, M. (2006). Online outlier detection of
learners’ irregular learning processes. In C. Romero & S. Ventura (Eds.), Data Mining in E-learning (pp. 261-278). Billerica, MA: WitPress.
Zhang, X., Edwards, J., & Harding, J. (2007). Personalised online sales using web usage data mining. Computers in Industry, 58,
appendix: LMs Learning Behaviors
Category Variable Lv1: Course Lv2: Duration (Weekly/Daily/ Session)
Lv3: Single
Record Descriptions Assignments noAsg Number of
Assignments Completed Number of Assignments Completed Access
assignment Access assignment link Course
Materials freHome Frequency of home page accessed
Frequency of home
page accessed Access home page Access course home page freMaterial Frequency of
course materials accessed
Frequency of course
materials accessed Access course materials
Access course material page Forums noRead Number of
discussion read Number of discussion read Read discussion Read a discussion post noPost Number of
discussion posted Number of discussion posted Post discussion Add a discussion post noReply Number of
discussion replied Number of discussion replied Reply discussion Reply a discussion post noDelete Number of
discussion deleted Number of discussion deleted Delete discussion Delete a discussion post freForum Frequency of
view forum link accessed
Frequency of view
forum link accessed View forums View all discussion forums Tools freTool Frequency of
“tools” links accessed
Frequency of “tools”
links accessed Access blog tool Click on the blog tool Access
dimdim tool Click on the dimdim tool Access
glossary tool Click on the glossary tool Access wiki
tool Click on the wiki tool Access chat
tool Click on the chat tool Access
survey tool Click on the survey tool Quiz noQuiz Number of quiz
completed Number of quiz completed Take quizQuit quiz Take a quiz Quit a quiz Review quiz Review quiz
Contact the authors
Jui-Long Hung
Boise State University
Email: [email protected]
Kerry Rice
Boise State University Email: [email protected]
Anthony Saba
Boise State University