University of Tennessee, Knoxville
Trace: Tennessee Research and Creative
Exchange
Doctoral Dissertations Graduate School
8-2012
Effects of Highway Geometric Features and
Pavement Quality on Traffic Safety
Ximiao Jiang xjiang10@utk.edu
This Dissertation is brought to you for free and open access by the Graduate School at Trace: Tennessee Research and Creative Exchange. It has been accepted for inclusion in Doctoral Dissertations by an authorized administrator of Trace: Tennessee Research and Creative Exchange. For more Recommended Citation
Jiang, Ximiao, "Effects of Highway Geometric Features and Pavement Quality on Traffic Safety. " PhD diss., University of Tennessee, 2012.
To the Graduate Council:
I am submitting herewith a dissertation written by Ximiao Jiang entitled "Effects of Highway Geometric Features and Pavement Quality on Traffic Safety." I have examined the final electronic copy of this dissertation for form and content and recommend that it be accepted in partial fulfillment of the requirements for the degree of Doctor of Philosophy, with a major in Civil Engineering.
Baoshan Huang, Stephen Richards, Major Professor We have read this dissertation and recommend its acceptance:
Lee Han, Russell Zaretzki
Accepted for the Council: Dixie L. Thompson Vice Provost and Dean of the Graduate School (Original signatures are on file with official student records.)
Effects of Highway Geometric Features and Pavement
Quality on Traffic Safety
A Thesis Presented for the
Doctor of Philosophy
Degree
The University of Tennessee, Knoxville
Ximiao Jiang
August 2012
Copyright © 2012 by Ximiao Jiang. All rights reserved.
ACKNOWLEDGEMENTS
I would like to express my sincere gratitude to my advisor, Dr. Baoshan Huang, and my co-advisor, Dr. Stephen Richards, for their guidance, support, help, and encouragement throughout my doctoral study. Without their insightful suggestions on the research topics, I could not have been where I am now.
I earnestly thank my advisor for Statistics Master's Degree, Dr. Russell Zaretzki, for his professional guidance and his enduring assistance on both my PhD's research and overall academic well-being. A special thank has to be addressed to my committee member, Dr. Lee Han, who provided extensive support and understanding on my research.
Great thanks go to Mr. Tom Every in the Department of Transportation, who has provided the required data in my research. I would also like to recognize the Highway Safety Information System for providing Illinois Highway Safety Database.
Great thanks go to Dr. Xiang Shu for his help and suggestions on my research. I would like to extend my appreciation to my colleagues and friends, Dr.Qiao Dong, Dr. Hao Wu, Dr. Jingsong Chen, Sheng Zhao, Changjun Zhou, Benjamin Bowers for their help and friendship. I would also like to recognize Tennessee Department of Transportation and Southeastern Transportation Center for the financial support.
Finally, I would like to thank my wife, Bin Zhang. She has always been supportive in my research career. Further thanks go to my parents, my sister and my brother in law. Their best wish, although from thousands of miles away, is always my best gift. Their love and encouragement deserve special recognition.
ABSTRACT
Curbs are commonly used on roadways to serve for drainage managing, access controlling and other positive functions. However, curbs may also bring about unfavorable effects on drivers’ behavior and vehicles’ stability when hitting curbs, especially for high-speed roadways. In addition, numerous pavements have been experiencing wear off rapidly in recent decades, which significantly affected driving quality. However, previous study of pavement management factors as related to the happening and outcome of traffic-related crashes has been rare. The objective of this dissertation is to evaluate the influences of outside shoulder curbs, pavement management factors, and other tradition traffic engineering factors on the occurrence and outcome of traffic-related crashes.
The Illinois Highway Safety Database from 2003 to 2007 and the Tennessee crash data from 2004 to 2009 was employed in this research. A few advantage statistics models were built to study the effects of curbs, pavement quality and other typical factors on both the occurrence and the outcome of crashes. These models include: the Zero-Inflated Negative Binomial models (ZINB), the Zero-Inflated Ordered Probit (ZIOP) model, the random effect Poisson and Negative Binomial model, as well as the Bayesian Ordered Probit (BOP) model.
The findings of this study suggest that the employment of curbed outside shoulders on high-speed roadways would not pose any significantly harmful effect on the occurrence
of crashes. On high-speed roadways with curbed outside shoulders in terms of the crash frequency, reducing speed limit from 55 mph to 45 mph would not achieve any safety benefit. Crashes occurring on roadways with curbed outside shoulders are more likely to be no and minor injury related as compared to crashes on roadways without curbs. The increase of speed limit from 45 to 55 has relatively small effects on single vehicle crashes occurring on roadways with curbed outside shoulders. Rough pavements were associated with higher overall crash frequency but lower level of injury severity given that a two vehicle involved rear-end, head-on and angle crash has occurred. Pavements with more severe distress were related to lower crash frequency.
TABLE OF CONTENTS
ACKNOWLEDGEMENTS ... iii ABSTRACT ... v TABLE OF CONTENTS ... i LIST OF TABLES ... iv LIST OF FIGURES ... v LIST OF ACRONYMS ... 1PART 1 RESEARCH BACKGROUND AND OBJECTIVES ... 2
1.1 Problem Statement ... 3
1.2 Research Objectives and Significance ... 4
1.3 Research Methodology ... 5
PART 2 INFLUENCE OF CURBS ON TRAFFIC CRASH FREQUENCY IN HIGH-SPEED ROADWAYS... 7
2.1 Abstract ... 8
2.2 Introduction ... 10
2.3 Methodology ... 13
2.3.1 Data Preparation ... 13
2.3.2 Crash Rate Comparison ... 17
2.3.3 Crash Frequency Regression Analysis ... 19
2.4 Results ... 24
2.4.1 Analysis of Crash Rates ... 24
2.4.2 Analysis of Crash Rates ... 28
2.4.3 Regression Analysis for the Segments with Curbed Outside Shoulders ... 36
2.5 Conclusions ... 38
PART 3 INVESTIGATION THE INFLUENCE OF CURBS ON SINGLE-VEHICLE CRASH INJURY SEVERITY UTILIZING ZERO-INFLATED ORDERED PROBIT
MODELS ... 44 3.1 Abstract ... 45 3.2 Introduction ... 46 3.3 Literature Review ... 48 3.4 Methodology ... 52 3.4.1 ZIOP Model... 53 3.4.2 Marginal Effects ... 60 3.4.3 Model Evaluation ... 62 3.5 Data Preparation ... 63 3.6 Results ... 68 3.6.1 Parameter Estimates ... 68 3.6.2 Marginal Effects ... 73 3.7 Model Evaluation ... 78 3.8 Conclusion ... 81 References ... 83
PART 4 ESTIMATING SAFETY EFFECTS OF PAVEMENT MANAGEMENT FACTORS UTILIZING BAYESIAN RANDOM EFFECT MODELS ... 89
4.1 Abstract ... 90
4.2 Introduction ... 91
4.3 Data Preparation ... 98
4.4 Methodology ... 101
4.4.1 Poisson and Negative Binomial model ... 101
4.4.2 Random effect models ... 104
4.5 Results ... 108
4.5.1 Model comparison ... 108
4.5.2 Posterior inference... 111
4.6 Conclusions ... 117
References ... 119
PART 5 TWO-VEHICLE INJURY SEVERITY MODELS BASED ON INTEGRATION OF PAVEMENT MANAGEMENT AND TRAFFIC ENGINEERING FACTORS ... 124
5.1 Abstract ... 125
5.3 Methodology ... 132
5.3.1 Data Preparation ... 132
5.3.2 The OP and BOP Model... 140
5.4 RESULTS... 146
5.4.1 Two-vehicle Rear-End Collisions ... 146
5.4.2 Two-vehicle Sideswipe Collisions ... 151
5.4.3 Two-vehicle Angle Collisions ... 154
5.5 CONCLUSIONS ... 156
References ... 158
PART 6 CONCLUSIONS AND RECOMMENDATIONS ... 166
6.1 Conclusions ... 167
6.2 Recommendations ... 168
APPENDICES ... 172
LIST OF TABLES
Table 2.1 Summary statistics of variables ... 15
Table 2.2 Wilcoxon test on crash rates over outside shoulder types by speed limits ... 27
Table 2.3 Wilcoxon test on crash rates over speed limits by outside shoulder types ... 27
Table 2.4 Likelihood ratio statistics for Type 3 analysis ... 29
Table 2.5 Model comparison between NB model and ZINB model ... 31
Table 2.6 Parameter estimates of ZINB model ... 32
Table 2.7 Parameter estimates of ZINB model on curbed outside shoulders ... 37
Table 3.1 Variables Classification Criteria ... 65
Table 3.2 Injury severity distribution on key variables ... 67
Table 3.3 Parameter estimates from the ZIOP model ... 70
Table 3.4 Marginal effects on no injury ... 75
Table 3.5 Marginal effects on minor injury, incapacitating and fatality ... 76
Table 3.6 Performance of the ZIOP model and the OP model ... 78
Table 4.1 Summary statistics of the overall factors ... 102
Table 4.2 The performance of models ... 110
Table 4.3 Posterior statistics of classical and one random effect models ... 112
Table 5.1 Distribution of overall pavement management factors ... 135
Table 5.2 Variables classification criteria ... 136
Table 5.3 Injury severity distribution on key variables ... 138
Table 5.4 Parameter estimates for two-vehicle Rear-End collisions ... 147
Table 5.5 Parameter estimates for two-vehicle Sideswipe collisions ... 152
LIST OF FIGURES
Figure 1.1 Research Flow Chart ... 6
Figure 2.1 The Distribution of Crash Rate ... 17
Figure 2.2 Mean crash rates for outside shoulder types by speed limit ... 25
Figure 3.1 States usage of curbs by speed limitation on highways ... 47
Figure 3.2 Sketch of the ZIOP model ... 59
Figure 3.3 Probability difference of injury severity between 55 mph and 45 mph... 80
LIST OF ACRONYMS
AADT Annual Average Daily Traffic AIC Akaike’s Information Criteria BOP Bayesian Ordered Probit DIC Deviance Information Criteria HSIS Highway Safety Information System
HPMA Highway Pavement Management Application LTPP Long Term Pavement Program
NB Negative Binomial
NCHRP National Cooperative Highway Research Program OP Ordered Probit
PSI Present Serviceability Index PDI Pavement Distress Index RD Rutting Depth
SBC Schwarz Bayesian Criteria
TRIMS Tennessee Roadway Information Management System TDOT Tennessee Department of Transportation
VMR Variance to Mean Ratio ZIP Zero-Inflated Poisson
ZINB Zero-Inflated Negative Binomial ZIOP Zero-Inflated Ordered Probit
1.1 Problem Statement
Traffic safety has been a major concern for the general public and various government agencies for decades. In 2002, the World Health Organization (WHO 2002) reported that traffic crashes ranked tenth among top killers in terms of years of life lost world wide. In 2004, 42,636 people lost their lives in U.S. motor-vehicle crashes (NHTSA 2005a). In the U.S., traffic crashes cause more loss of human life (as measured in human-years) than almost any other cause-falling behind only cancer and heart disease (NHTSA 2005b).
Traffic safety is complexly determined by various components of human-environment-vehicle system. Numerous traffic accident studies have attempted to determine the impacts of all kinds of factors on the occurrence and outcome of traffic accidents. However, the research results so far are still controversial, and until this point, a few factors have seldom been accounted for in traffic safety researches.
First of all, there is a gap in the safety evaluation process between pavement management and highway design groups. Traditionally, skid resistance and surface texture, roughness (e.g., IRI), pavement friction and surface conditions (ruts, faults, potholes, cracks, spalls, etc.) related to different paving materials and types are the most common pavement management indicators of safety problems. While these pavement engineering factors are important for pavement design and maintenance, they are not utilized for traffic safety considerations by highway design and planning groups. In fact, these pavement management factors are complexly correlated with highway design factors, such as highway type, profile, alignment, the number of lanes, lane width, shoulder types, median
types, traffic characteristic, etc. For example, curve segments have a higher demand for surface friction to reduce lane-departure crash rates. Therefore, there is a need for integrating pavement management and road geometric factors into traffic safety management for high speed facilities.
In addition, roadway geometric design has always been a major concern in traffic safety research. As the development of suburbanization on city peripheries, the increasing traffic volume may exceed the capacity of the original two-lane rural highways, which will prompt the need to increase the number of lanes. However, the increase number of lanes will bring about a series of issues regarding drainage performance, speed limit control, as well as cross section design. Particularly, whether the installation of curbs for drainage purpose will conflict with original speed limit in terms of traffic safety is still questionable.
1.2 Research Objectives and Significance
The objective of this study is to investigate the influence of typical geometric features, pavement quality, as well as their interactions with general environmental, human and vehicle factors on the occurrence and outcome of traffic related accidents. The original contribution includes:
Ø Incorporate real-time pavement quality measurements into statistics models to investigate their influences on both crash frequency and traffic related crash injury on State Route roadways;
Ø Account for both the temporal and spatial correlations in evaluating the effects of pavement management factors on crash frequency;
Ø Employ large-scale dataset to investigate the safety effects of curbs and their interactions with speed limits on traffic safety;
Ø First introduce Zero-Inflated Ordered Probit model into the study of traffic safety issues;
Ø Fully evaluate the performance of the Bayesian method in comparison with Maximum Likelihood Estimate method in traffic safety prediction models.
1.3 Research Methodology
This dissertation primarily include four parts of research. In the first part, the influences of outside shoulder curbs on the occurrence of crashes were studied utilizing Zero-Inflated Negative Binomial (ZINB) model; in the second part, the influences of outside shoulder curbs on the injury severity of traffic-related crashes were evaluated employing the Zero-Inflated Ordered Probit (ZIOP) model; in the third part, the effects of pavement management factors on the occurrence of crashes were estimated utilizing random effect Bayesian models, including: Poisson, Negative Binomial (NB), One Random Effect Poisson (OREP), One Random Effect Negative Binomial (ORENB), Two Random Effect Poisson (TREP), Two Random Effect Negative Binomial (TRENB) models; in the fourth part, the effects of pavement management factors on the outcome of traffic-related crashes were evaluated employing both the traditional Ordered Probit (OP) model and the Bayesian Ordered Probit (BOP) model. The overall research approach is shown in Figure 1.1.
Figure 1.1 Research Flow Chart Illinois Accident Data HSIS Impacts of curbs on crash frequency Impacts of curbs on Injury severity ZINB Model ZIOP Model Tennessee Accident Date TRIMS HPMA Impacts of pavement quality on crash frequency Impacts of pavement quality on injury severity REP Model RENB Model OP Model BOP Model
PART 2
INFLUENCE OF CURBS ON TRAFFIC CRASH
This part is based on a published journal paper (Jiang, et al. 2011). This paper was submitted to the journal Traffic Injury Prevention in January, 2011. The authors have revised a few issues according to the suggestions of reviewers in February and March, 2011. This paper was final accepted in April, 2011, and published in July, 2011.
The authors that have contributed to this paper include Dr. Xuedong Yan, Dr. Baoshan Huang, Dr. Stephen Richards and myself. Dr. Yan's major contribution is collecting the data for this research, and providing help in statistics modeling. Dr. Huang and Dr. Richards have contributed to providing funding and the consultant help in highway geometric design related knowledge. Myself has contributed to the data mining, statistics modeling construction, literature review, result interpretation and the composing of the text.
2.1 Abstract
Curbs are commonly used on roadways to serve for drainage managing, access controlling and other positive functions. However, curbs may also bring about unfavorable effects on drivers’ behavior and vehicles’ stability when hitting curbs, especially for high-speed roadways. The objective of this part of research is to investigate if the presence of curbs along outside shoulders has produced adverse effects on traffic safety on high-speed roadways, and whether increasing speed limits has created any further harmful effects.
evaluate the effects of curbs over traffic safety on 2-lane and 4-lane non-freeways with the speed limits of 45, 50 and 55 mph. The Wilcoxon/Kruskal-Wallis nonparametric tests were conducted to compare the road-segment crash rates between three types of outside shoulders (curbed shoulder, soft flush shoulder, and hard flush shoulder) and between the three types of speed limits. In addition, the Zero-Inflated Negative Binomial models were developed for all the roadway segments combined, as well as the curbed outside shoulder only segments. The models were used to estimate the influences of curbed outside shoulder, speed limit level, as well as other roadway characteristics on the crash frequency.
It was found that road segments with different types of outside shoulders were from different populations in terms of the distribution of crash rates, so did segments with different speed limits. Further, the crash frequency analysis indicates that the curbed outside shoulders are not likely to result in a higher crash frequency compared to the other two types of outside shoulders. In addition, there was no evidence that a decrease in speed limit results in reduction in crash frequencies for road segments with curbed outside shoulders.
The findings of this study suggest that the employment of curbed outside shoulders on high-speed roadways would not pose any significantly harmful effect on the occurrence of crashes, and on high-speed roadways with curbed outside shoulders, reducing speed limit from 55 mph to 45 mph would not achieve any safety benefit.
2.2 Introduction
Due to the development of suburbanization on city peripheries, the traffic volume of the original two-lane rural highways, typically with 55 mph speed limit, may exceed their capacities. In order to enhance driving quality and reduce traffic delay, the two-lane rural highways need to be widened to four-lane highways to mitigate traffic pressure. In these highway improvement projects, curbs are frequently installed along the new four-lane highways to provide drainage and address issues such as access control, difficult terrain, and limited right-of-way.
According to AASHTO, curbs are used extensively on all types of urban highways, but should be used cautiously on high-speed rural highways because they may lead to vehicles losing control or tires going airborne during impact (AASHTO, 2005). Therefore, on one hand, the use of curbs is generally discouraged in many states in the U.S. on roadways with design speeds over 45 mph, and whenever they are necessary for drainage control or other special functions, only certain types of curbs are permitted to be used with specified requirements of placement. On the other hand, the usage of curbs when updating and widening rural two-lane highways into four-lane highways, frequently results in reducing the speed limit from 55 mph to 45 mph.
However, lowering speed limits may confuse drivers and create an enforcement problem since many drivers do not perceive the danger and try to travel as fast as they had before the road was improved. As a result, although the highway conditions are significantly enhanced, the projects may be viewed negatively by the public, design professionals, and
law enforcement personnel (Baek et al., 2006). Thus, whether or not to cut speed limits is a dilemma for engineers when updating and widening two-lane rural roadways with 55 mph speed limit into four-lane highways with the presence of curbs along outside shoulders.
There is lack of literatures specifically focusing on whether and to what extent the existence of curbs would add to the occurrence of traffic crashes on high-speed roadways. Hadi et al. (1995) evaluated the effects of cross-section elements on total fatality and injury crash rates for different types of rural and urban highways at various traffic levels. The results indicated that the presence of raised curbs in the medians of all urban highways except four-lane undivided highways has an adverse effect on vehicular safety. Similarly, Bligh and Mak found that curbs and other non-rigid or low-profile fixed objects are involved in many more rollover accidents compared to rigid fixed objects (Bligh et al., 1999). Moreover, the study conducted by Plaxico et al. reported that curbs pose a significant hazard to the security of motorcyclists. Besides, their analyses on the NASS-GES and 1996-1997 Michigan and Illinois HSIS data showed that the proportion of rollover involved in curb crashes increased as the assigned operating speed increased (Plaxico et al., 2005). However, none of these studies were specifically focused on the safety effects of curbed outside shoulders on high-speed roadways.
There are also previous research indicating that curbs would not increase crash rate for highspeed roadways. Baek et al. (2008) conducted a research to identify the mean crash rates difference between roadways at speed limit of 45 mph and 55 mph with the
presence of curbs next to each direction of the outside lanes. The results suggest that there is no significant difference between them in both total and curb-involved crashes. This study was based on the data collected from 60 selected sites in North Carolina, which might be limited to draw any sound conclusion. The further research conducted by Baek and Hummer (2008) indicated that multilane highways with curbed outside shoulders were associated with fewer total collisions and equal injury collisions as compared to no curbs, and the segments with speed limit of 55 mph had more collisions than those of 45 mph. This study included 2,274 collisions occurring on 191.85 miles of directional multilane highway segments in North Carolina from 2001 to 2003. However, this study is lack of the exploration into the interaction impact of speed limit and curbed outside shoulders on the collision frequency. Besides, taking crash rate (the number of collisions per mile per year) as the predicted variable ignored the possible non-linear relationship between the number of crashes and segment length, which has been raised by increasing number of researchers (Milton et al., 1998; Qin et al., 2004; Sawalha et al., 2001).
It can be conclude from the literature review that the research on the effects of curbs on the occurrence of crashes in high speed limit conditions is very limited and the results are still controversial. Crash frequency prediction models taking into account the presence of curbed outside shoulders, as well as typical geometric and traffic features are also lacking. Hence a comprehensive analysis of curb-related safety influence considering speed limit change on high-speed roadways is desired.
The objective of this part of research aims at investigating the safety effect of curbs along outsider shoulders on high-speed roadways, utilizing the Illinois Highway Safety Database from the year 2003 to 2007. This research specifically focused on crash rate comparison and crash frequency modeling analysis of the non-freeway 2-lane and 4-lane road segments with posted speed limits of 45, 50 and 55 mph.
2.3 Methodology
2.3.1 Data Preparation
The Illinois Highway Safety Database (IHSD) was selected for this study. Illinois is one member of the Highway Safety Information System (HSIS), which is a multistate database that contains crash, roadway inventory, and traffic volume data for a select group of States. The HSIS dataset contains the subset of 1985-2007 accidents that occurred on the Illinois State-inventoried system. The Illinois transportation database includes Accident Data, Roadlog File, Bridge (Structures) File, Railroad(RR) Grade Crossing File (Council et al. 2009). The IHSD Accident Data and Roadlog File from 2003 to 2007 were extracted and linked to each other using three common variables: county, route, and milepost.
The combined dataset was further cleaned according to the following criteria:
n Freeway segments were excluded since the use of curbs on freeways is limited to
special conditions in Illinois and specific features of curbs are required as well (IDOT, 2001);
n Intersection related segments were excluded as the traffic patterns are different
from continuous segments;
n Speed limits of 45, 50 and 55 mph were selected since this study is focusing on
high-speed roadways;
n The road segments with 2 lanes and 4 lanes were selected since they are quite
common in sampled area;
n Crash rates (Equation 2.1) greater than 200 per million vehicle miles travel
(MVMT) were excluded as outliers, because these observations have very low frequency and extraordinarily large variance (26124.89). Besides, they either had low AADT or short segment length according to the database, which may introduce AADT data collection errors or unidentified factors into the regression analysis. AADT l CF MVMT CF CR × × × = = 365 10 / 6 (2.1)
where CR is crash rate, CF is crash frequency, l is segment length.
n Segment length of 2.74 mi was removed as an outlier since it is extraordinarily
large in sampled segments;
The cleaned dataset applied in this part of research includes 48,831 total crashes occurring on 3,553.32 miles of 36,132 homogeneous segments during the 5 years from 2003 to 2007. The number of crashes occurring on each of these segments ranges from 0 to 128, with the average of 1.35 and the standard deviation of 3.64. Table 2.1 summarizes the descriptive statistics for the explanatory variables employed in this study. The outside
Table 2.1 Summary statistics of variables
Description of categorical variables
Variables label Categories Frequency Percent (%)
Spd_limt Speed limit
45 45 mph 4922 13.62 50 50 mph 2235 6.19 55 55 mph 28975 80.19 No_lanes Number of lanes 2 2 lanes 31530 87.26 4 4 lanes 4602 12.74 Outshtp Outside shoulder type
Outshd_curb Curbed outside
shoulder 1807 5.00
Outshd_soft Soft flush outside
shoulder 8684 24.04
Outshd_hard Hard flush outside
shoulder 25641 70.96
Medtype Median type
Med_raise Raised median 2668 7.38
Med_flush Flush median 2772 7.67
Med_none No median 30692 84.95
Rururb Rural or Urban 1 RURAL 27632 76.48
2 URBAN 8500 23.52
Description of continuous variables
Variables Label Min Max Mean Median Standard
deviation ThAADT Thousand of AADT 0.10 49.37 6.14 3.47 7.30 Seg_lng Segment length (mi) 0.01 1.88 0.09 0.06 0.13 Lanewid Lane width (ft) 8.00 30.00 11.89 12.00 1.07 Outshwd Outside shoulder width (ft) 0.00 12.00 5.22 4.00 3.28 Medwid Median width (ft) 0.00 99.00 2.81 0.00 8.96
shoulder type specified in this part of research is restricted to the shoulders adjacent to both directions of the travel lanes. Thousand of AADT (ThAADT) is employed in the regression modeling as an exposure variable, which is calculated through dividing AADT by 1000, since the change of crash frequency with increment by one vehicle is meaningless.
The outside shoulder types and median types were re-categorized into new classes from the original records according to the following rules:
Median types:
§
“No median” is categorized into the class of segments without medians, symbolized as Med_none;§
“Unprotected-sodded, treated earth, or gravel surface”, “Painted median” and “Rumble strip or chatter bar” are categorized into the class of segments with flush medians, symbolized as Med_flush;§
“Curbed-raised median, any width” and “Positive barrier-fencing, guardrail, retaining walls, or other barriers” are categorized into the class of segments with raised medians, symbolized as Med_raise;
Outside shoulder types:
§
“Earth” and “Sod” are categorized into soft flush outside shoulder type, symbolized as Outshd_soft;§
“Curb and gutter” is categorized into curbed outside shoulder type, symbolized as Outshd_curb;§
“Aggregate”, “Surface treated”, “Bituminous” and “concrete-tied” are categorized into hard flush outside shoulder type, symbolized as Outshd_hard.2.3.2 Crash Rate Comparison
The crash rate distribution histogram (Figure 2.1) clearly illustrates that the distribution of crash rate is extremely non-normal. The normality test shows that the skewness is 4.45 and the kurtosis is 27.68, which strongly rejects the null hypothesis that the crash rate follows the normal distribution.
To compare crash rates between different outside shoulder types in related to various speed limit levels, Wilcoxon/ Kruskal-Wallis tests were conducted. Wilcoxon Rank Sum test is a non-parametric test based solely on the order of each observation from two samples, and the Kruskal–Wallis test is the extension of Wilcoxon Rank Sum test used for more than two groups’ comparison.
Figure 2.1 The Distribution of Crash Rate 0% 10% 20% 30% 40% 50% 60% 0 8 2 4 4 0 5 6 7 2 8 8 1 0 4 1 2 0 1 3 6 1 5 2 1 6 8 1 8 4 2 0 0 P e rc e n ta g e Crash Rate
To apply this test, independent random samples of sizes from populations are obtained in the first place, and then the data from all these samples is arranged in ascending order in a single series ( in the case of repeated value, assign ranks to them by averaging their rank position). Once this is completed, ranks of the different samples are separated and summed up. Assume that there are observations in total, let be the sum of the ranks of the observations in the sample. The Kruskal-Wallis statistic can be expressed as:
(2.2)
where is the Kruskal-Wallis Test statistic. When the sample sizes are large and all populations have the same continuous distribution, then has an approximate chi-square distribution with degrees of freedom. If the calculated value of Kruskal-Wallis Test is less than the chi-square table value, then the null hypothesis will be accepted. If the calculated value of Kruskal-Wallis Test is greater than the chi-square table value, then we will reject the null hypothesis and say that these samples come from different populations. For this research, the null hypothesis is that segments of different shoulder types or speed limits are from identical populations in terms of the distribution of crash rates, and the alternative hypothesis is that they are from different populations, only with respect to the distribution of crash rates.
In order to identify underlying associations between variables in the Kruskal-Wallis test, the log-linear model was employed. The log-linear model computes the means of cell
counts in contingency tables by describing the association patterns among a set of categorical variables without specifying any variable as a response variable.
To investigate associations between categorical variables, the saturated log-linear model is first established, where the main effects and all interactions are included. Then insignificant interactions are removed in descending order, and a new model will be fitted in each step. The new model is deemed as reasonably well if the p value of the likelihood ratio test is greater than 0.05, and all insignificant interactions are excluded.
In this part of research, associations between speed limit, outside shoulder type, and rural or urban, number of lanes, median type was investigated. To our point of interest, only the main effects and two-way interaction in related to speed limit and outside shoulder type were analyzed in the model. the higher order interaction may exist but will not affect the judgement. All the variables of significant interaction (p<0.05) in this model can be considered as highly related.
2.3.3 Crash Frequency Regression Analysis
Poisson model is known as the simplest and most common model for count data regression analysis, which has been widely used in crash frequency modeling studies (Jovanis et al. 1990, Joshua et al. 1993, Miaou et al. 1993). It assumes that the observed count datayi,given the vector of covariatexi, follows a Poisson distribution. The density
,... 2 , 1 , 0 , ! = − = = i y i y i y i i e i x i y i Y P µ µ (2.3)
where, the parameter ui, conditional mean number of events for each covariate xi, is
given by Equation 2.4.
(
β)
µi =Exp x'i (2.4)
where β is a (k+1)×1 parameter vector (β0 is the coefficient for intercept, and β1, β1,
2
β …βkare for k regressors).
In the Poisson regression, the conditional variance of the count variable is equal to the conditional mean, as shown in Equation 2.5.
(
yi xi)
E(
yi xi)
iV = =µ (2.5)
However, this assumption is contradict to the fact that the vehicle accident data are always significantly overdispersed relative to its mean. In this situation, the common Poisson regression model is inappropriate as it can result in bias and inconsistent of parameter estimates. Therefore, the more general probability distribution like Negative Binomial (NB) regression became popular in modeling crash count data in the last few
years, since it can address the issue of overdispersion (Milton et al. 1998, Shankar et al. 1995, Carson et al. 2001).
The general form of NB regression model can be expressed as Equation 2.6. There are many variants of NB, while in this part of research, we will focus on the negative binomial model with quadratic variance function (p=2).
ui =Exp
(
xiβ +εi)
= ! ,! "#$$#%& %& (2.6)
where, xi is the covariate of road segment geometric and traffic features in each record
including the intercept; ui is the conditional mean of the crash frequencyyi; β is the
parameter coefficients vector to be estimated for each independent variable including intercept; '(is a heterogeneity component accounting for unobserved heterogeneity in the crash count data , which is independent of xi. It is assumed that '( follows a
"#$$#%& %& distribution with '( and )'( %.
The negative binomial distribution (the density of each crash count) can be derived as:
(
)
(
)
( )
, 0,1,2,... ! 1 1 1 1 1 1 = + + Γ + Γ = − − − − − − i y i i i i i i i y y y x y f i µ α µ µ α α α α α (2.7)However, there is always large density of zeros in crash count data, which can hardly be predicted by traditional NB model. For this situation, zero inflated regression models were developed in the crash frequency related research area (Lee et al. 2002, Lord et al. 2005).
Zero-inflated count models provide a way of modeling the excess zeros in addition to allowing for overdispersion. For each road segment, there are two possible data generation processes. Process 1 is chosen with probability ωi and process 2 with probability 1−ωi. Process 1 generates only zero counts, whereas process 2 generates
counts from either a Poisson or a negative binomial model. In this part of research, the probability ωi depends on the geometric and traffic features of segment , can be
obtained from the logistic function *, as shown in Equation 2.8.
γ)
'
exp(
1
)
γ
'
exp(
)
γ
'
(
γ)
'
(
i i i i iz
z
z
z
F
+
=
Λ
=
=
ω
(2.8)where z'iis the vector of independent variables specified in the logistic regression model
(geometric and traffic features) and intercept; + is the vector of zero-inflated coefficients to be estimated.
) , (yi xi zi p =
(
)
)
(
> − = − + 0 , ) 1 ( 0 , ) 1 ( i i i i i i i i i y x y g y x y g ω ω ω (2.9)where g
(
yi xi)
follows either Poisson distribution or NB distribution, xi is the vector of covariates of observation (geometric and traffic features) specified in the model.In general, the log-likelihood function of zero-inflated models fully incorporates the logistic and Poisson or NB process, which can be expressed as Equation 2.10 (Lambert, 1992; Greene, 1994). Therefore, zero-inflated models jointly estimate the incidence of zero crash along with the positive counts.
, -./01 2345 (2.10)
where n is the total number of observations.
In this study, both NB and Zero-inflated Negative Binomial (ZINB) models were used for initial regression efforts. Akaike’s Information Criteria (AIC) (Akaike, 1973), Schwarz Bayesian Criteria (SBC) (Sawa, 1978) and Vuong test (Greene, 1994) were employed to identify which one was more appropriate for this crash frequency regression analysis. The model with the smaller AIC or SBC among all competing models is deemed as the better model. The Vuong’s test (Vuong, 1989) is an addition to and even outperform AIC and SBC in comparing models from different regression series. Given Equation 2.11,
(
)
(
)
= i i i i i x y P x y P Log m 2 1 (2.11) where(
i i)
N y xp is the predicted probability of observed crash frequency for segment i
from model N. Then, the Vuong statistic is computed to test whether the two models are significantly different in predicting true crash count or not, which can be expressed as Equation 2.12.
(
)
2 1 1 1 1 m m n m n n V i n i i n i − ∑ ∑ = = = (2.12)where V is the Vuong statistic. If V >1.96, the first model is preferred. If V <-1.96, then
the second one is preferred.
2.4 Results
2.4.1 Analysis of Crash Rates
The mean crash rates of different outside shoulder types by various speed limits are shown in Figure 2.2.
It can be observed that, compared to the other two types of outside shoulders without curb, the curbed outside shoulders were associated with higher mean crash rates for the 45 and 50 mph speed limits, while for the 55 mph speed limit there was no apparent difference in the mean crash rates between the three types of shoulders. Furthermore, the
Figure 2.2 Mean crash rates for outside shoulder types by speed limit 0 2 4 6 8 10 12 45 mph 50 mph 55 mph Overall M e a n C ra s h R a te Speed Limit
55 mph speed limit was involved in a lower mean crash rate than the 45 and 50 mph speed limits.
In order to identify whether the crash rate distributions of road segments with different types of outside shoulders significantly varied or not, a series of Wilcoxon/Kruskal-Wallis tests with a significance level of 0.05 were executed under various speed limit conditions (45mph, 50mph, 55mph), respectively. Table 2.2 is a summary of the test results.
As is shown in Table 2.2, in each of the studied speed limit conditions, as well as the overall speed limit conditions, road segments with curbed outside shoulders always had higher mean Wilcoxon scores of crash rates than those with soft flush outside shoulders and hard flush outside shoulders. The p values of these tests are all less than 0.05, indicating that the segments with various outside shoulder types were from different populations of crash rates.
Furthermore, Wilcoxon/Kruskal–Wallis tests were also conducted on crash rates on road segments with different outside shoulder types by different speed limits. Table 2.3 summarizes the test results in detail.
It was found that for all the studied road segments combined, as well for those with different outside shoulders except the soft flush type, the mean Wilcoxon scores of crash
Table 2.2 Wilcoxon test on crash rates over outside shoulder types by speed limits
Speed limit Outside shoulder type N Mean
Score DF Chi-square Pr>chisquare
45 Outshd_curb 1098 2699.45 2 51.32 <.0001 Outshd_soft 560 2246.48 Outshd_hard 3264 2418.34 50 Outshd_curb 291 1257.38 2 36.35 <.0001 Outshd_soft 372 970.44 Outshd_hard 1572 1127.12 55 Outshd_curb 418 15579.96 2 10.27 0.0059 Outshd_soft 7752 14393.85 Outshd_hard 20805 14501.14 Overall Outshd_curb 1807 21083.85 2 208.44 <0.0001 Outshd_soft 8684 17567.45 Outshd_hard 25641 18022.87
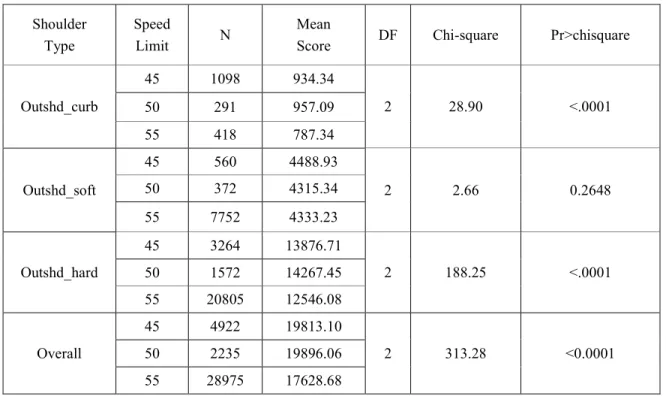
Table 2.3 Wilcoxon test on crash rates over speed limits by outside shoulder types
Shoulder Type
Speed
Limit N
Mean
Score DF Chi-square Pr>chisquare
Outshd_curb 45 1098 934.34 2 28.90 <.0001 50 291 957.09 55 418 787.34 Outshd_soft 45 560 4488.93 2 2.66 0.2648 50 372 4315.34 55 7752 4333.23 Outshd_hard 45 3264 13876.71 2 188.25 <.0001 50 1572 14267.45 55 20805 12546.08 Overall 45 4922 19813.10 2 313.28 <0.0001 50 2235 19896.06 55 28975 17628.68
rates were always lowest for the speed limit of 55 mph, with the p value less than 0.05, indicating that the crash rates were from different populations of crash rates. This result in some ways supports the findings of Baek et al. (2006): “when there was a difference in collision rate or severity, it was usually the 55 mph segments that had the lowest rates.”
Through the Wilcoxon/Kruskal–Wallis tests over the distribution of crash rates, it can be concluded that segments with curbed outside shoulders and the other two types of outside shoulders without curb were from different populations, as were the segments with different speed limits.
However, the likelihood ratio statistics of the log-linear model (Table 2.4) show that there are significantly strong associations (p<0.0001) between outside shoulder types, speed limits and number of lanes, rural or urban, as well as median type. Hence, the results of the Wilcoxon/Kruskal-Wallis tests may subject to the underlying association among these geometric and roadway features, and even other factors not identified in this part of research. Bearing this concern in mind, a more sufficient analysis method is needed to precisely identify the safety effects of curbed outside shoulders and speed limits change.
2.4.2 Analysis of Crash Rates
Both NB and ZINB models were fitted with SAS Countreg Procedure. For the NB model
and the NB regression part of the ZINB model, crash frequency (Tot_n) was specified as the dependent variable. The regressors included segment length (Seg_lng), thousand average annual day traffic (ThAADT), lane width (Lanewid), median width (Medwid),
Table 2.4 Likelihood ratio statistics for Type 3 analysis
Source DF Chi-Square Pr > ChiSq
Spd_limt 2 810.31 <.0001 Outshtp 2 7990.57 <.0001 Rururb 1 54.43 <.0001 No_lanes 1 1474.58 <.0001 Spd_limt*Rururb 2 7088.94 <.0001 Spd_limt*No_lanes 2 1512.05 <.0001 Spd_limt*Medtype 4 1369.26 <.0001 Spd_limt*Outshtp 4 114.47 <.0001 Outshtp*No_lanes 2 2964.42 <.0001 Outshtp*Rururb 2 2028.09 <.0001 Outshtp*Medtype 4 1981.57 <.0001
outside shoulder width (Outshwd), speed limit (Spd_limt), number of lanes (No_lanes), rural or urban (Rururb), median type (Medtype), outside shoulder type (Outshtp). In the final version of logistic regression part of the ZINB model, only variables that are significant (p<0.05) were included to estimate the likelihood of zero crash frequency.
The performance of each model is shown in Table 2.5. Both models have 36132 numbers of observations, and the Newton-Raphson optimization method was employed. The result shows that both the AIC and SBC values of ZINB model are smaller than that of NB model, indicating that the ZINB model outperformed the NB model. The result of Vuong’s Test is 20.50, which is much greater than 1.96, also indicating that the ZINB model is preferred.
In terms of AIC, SBC and Vuong’s Test results, the ZINB model appears to bring about a clear improvement in the overall fitness of crash frequency compared to the NB model. Therefore, the ZINB model is selected and further analyzed in the remaining section of this part of research.
The ZINB model parameter estimates have two parts: NB regression and logistic regression. Table 2.6 presents the parameter estimates and the significance tests of the ZINB model. It was found that median types, number of lanes, speed limit, rural or urban, thousand AADT, segment length and lane width were significantly associated with the crash frequency, while outside shoulder type, outside shoulder width and median width were not significantly related to crash frequency. Further, the measure of _Alpha in table
Table 2.5 Model comparison between NB model and ZINB model Model Number of observations Optimization method Log-likelihood Maximum Absolute Gradient AIC SBC NegBin 36132 Newton-Raphson -47271 4.632E-6 94582 94752 ZINB -46196 3.656E-7 92450 92696
Table 2.6 Parameter estimates of ZINB model
Parameter DF Estimate Standard Error t Value P Value
Negative Binomial Regression Part
Intercept 1 -0.307773 0.113655 -2.71 0.0068 Med_none 0 0 . . . Med_flush 1 -0.145379 0.045709 -3.18 0.0015 Med_raise 1 -0.100170 0.038979 -2.57 0.0102 Nolane_2 0 0 . . . Nolane_4 1 -0.185290 0.039690 -4.67 <.0001 Spdlimt_55 0 0 . . . Spdlimt_50 1 0.159994 0.031707 5.05 <.0001 Spdlimt_45 1 0.151024 0.025880 5.84 <.0001 Rururb_r 0 0 . . . Rururb_u 1 0.324692 0.027500 11.81 <.0001 Outshd_hard 0 0 . . . Outshd_curb 1 0.013165 0.042568 0.31 0.7571 Outshd_soft 1 -0.015626 0.021488 -0.73 0.4671 Thaadt 1 0.076724 0.001640 46.78 <.0001 Seg_lng 1 3.240140 0.059981 54.02 <.0001 Outshwd 1 -0.000583 0.003139 -0.19 0.8528 Medwid 1 -0.000422 0.001380 -0.31 0.7596 Lanewid 1 -0.036865 0.009447 -3.90 <.0001
Logistic Regression Part
Inf_Intercept 1 2.265432 0.361664 6.26 <.0001 Inf_Thaadt 1 -0.069838 0.006236 -11.20 <.0001 Inf_Seg_lng 1 -49.916395 2.070501 -24.11 <.0001 Inf_Nolane_2 0 0 . . . Inf_Nolane_4 1 0.319464 0.102276 3.12 0.0018 Inf_Rururb_r 0 0 . . . Inf_Rururb_u 1 -0.344662 0.085421 -4.03 <.0001 Inf_Outshwd 1 0.027374 0.008865 3.09 0.0020 _Alpha 1 0.728132 0.015750 46.23 <.0001
2.6 is 0.73, with the p-value less than 0.001, displaying a very strong overdispersion effect, indicating the superiority of the ZINB model over the Zero-inflated Poisson (ZIP) model.
The coefficient estimates of the model parameters in the NB regression part reflect how these independent variables correlated with crash frequency: when the value of independent numerical variable increases, the mean number of expected crashes increases if the coefficient is positive, or decreases if the coefficient is negative.
According to the parameter estimates in the NB regression part of this model, the p values for the variable Outshd_curb (P = 0.7571) and Outshd_soft (P = 0.4671) are much greater than the 0.05 significance level, indicating that there was no significant difference in crash frequency between segments with different types of outside shoulder. In other words, curbed outside shoulder did not show a significantly adverse effect on the occurrence of crashes compared to soft flush and hard flush outside shoulders. In addition, the large p value for variable Outshwd (P = 0.8528) suggests that the increase of outside shoulder width did not show a significant effect on the probability of crashes. However, it was found that the correlation between outside shoulder width and outside shoulder type was as high as 0.5198 in the sampled data. Therefore, the parameter estimate of outside shoulder width is plausible as it may be highly affected by the outside shoulder type.
median types, number of lanes, speed limit, rural or urban, thousand AADT, segment length and lane width. The positive coefficients for ThAADT and Seg_lng indicate that the crash frequencies increased as the AADT increased by 1000 vehicles per day, and also increased with each mile increase of segment length. These findings are consistent with many previous research results (e.g. Persaud et al., 1993; Abdel-Aty et al., 2000). It is noteworthy that the effect of segment length is non-linear with the crash frequency ( =3.2401), indicating that the crash frequency is likely to increase by as large as 25.44 times with each one-mile increase of segment length. Since the segment length is limited to 1.88 mi in this study, this coefficient should only be used to address crash occurrences in short segments. This finding is consistent with the previous analysis of Milton and Mannering (1998): this exponential relationship can be explained by the fact that there are too many short segments included in the study, where crash frequency is highly sensitive to the increase of segment length.
Moreover, road segments without median have higher crash frequency than those with either flush medians or raised medians, wherein flush medians are associated with the lowest crash frequency. The p value for Medwid (0.7596) indicates that the increase of median width did not significantly affect the crash frequency. This result does not match most of the previous findings, which suggest that increases of median width may serve to the reduction of crash frequency (Abdel-Aty et al., 2000; Knuiman et al., 1993). However, median width and median types are highly correlated (correlation coefficient is as high as 0.63) in the sampled data. Hence the parameter estimate for median width is to some extent subject to the distribution of median types.
It was also observed that urban regions appeared to have a higher crash frequency than rural regions. This is to be expected since urban regions involve more complex traffic conditions, high traffic volume, congestion, bad pavement conditions and so on. 4-lane roadways were found to be associated with lower number of crashes than 2-lanes in this model. This is reasonable because this comparison was based on the assumption of same traffic exposure so that the segments with 4 lanes should have lower traffic volume per lane. In addition, the increase of lane width is predicted to reduce crash frequency in this model, which is consistent with many other research results (Hadi et al., 1995; Andrew, 1998; Garber et al., 2000)
The coefficient for the speed limit of 45 mph is 0.1510, and for 50 mph is 0.1600, where the speed limit of 55 mph is the reference level. This result indicates that crash frequencies for the speed limits of 45 and 50 mph are significantly higher than that for the speed limit of 55 mph (P values are less than 0.05 for both cases).
The logistic regression part of the model predicts the likelihood of zero crash occurrence. The modeling results reveal that the variables of segment length (Inf_Seg_lng), thousand average annual daily traffic (Inf_ThAADT), number of lanes (Inf_No_lanes), rural or urban (Inf_Rururb), and outside shoulder width (Inf_Outshwd) are significant in estimating the probability of roadways belonging to the zero crash occurrence group. In terms of the parameter coefficients estimated, the higher the traffic exposure (thousand of AADT and segment length), the lower the possibility of zero crash occurrences, and urban regions are associated with a lower probability of zero crash than rural regions. In
addition, a larger outside shoulder width and higher number of lanes appear to be positively related to the likelihood of zero crash occurrences.
2.4.3 Regression Analysis for the Segments with Curbed Outside Shoulders
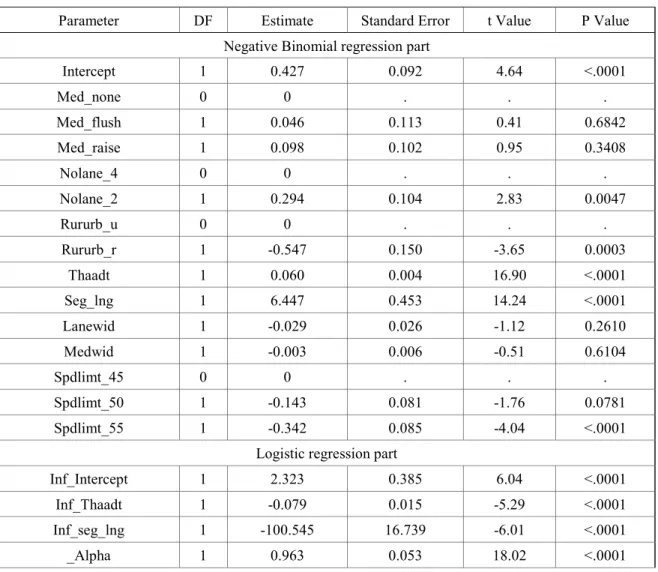
In order to further investigate the safety factors on the road segments with curbed outside shoulders, a ZINB crash frequency regression model was developed only for segments with curbed outside shoulders. The data applied in this analysis includes all 1,801 segments with curbed outside shoulders extracted from the previous cleaned dataset. Consequently, there were overall 8097 crashes in 113.75 miles of segments selected in this section. The number of crashes occurring on each of these segments ranges from 0 to 114 during the 5 study years. The model estimation is shown in Table 2.7.
It can be observed that thousand of AADT, segment length, number of lanes, road locations (rural or urban), speed limit of 55 mph are significant in predicting crash frequency in segments with curbed outside shoulders, whereas only intercept, thousand of AADT and segment length are significant in estimating the probability of zero crashes.
Regarding our point of interest, having a speed limit of 45 mph as the reference level, the negative coefficients of variable Spdlimt_50 (-0.1427) and Spdlimt_55 (-0.3424) indicate that the decrease of speed limit from 55 or 50 to 45 mph are not likely to have any safety benefit and may even possibly increase the crash frequency. In terms of the p values, the comparison between speed limits of 45 and 50 mph is marginally significant (p=0.0781) while the comparison between speed limits of 45 and 55 mph is essentially significant
Table 2.7 Parameter estimates of ZINB model on curbed outside shoulders
Parameter DF Estimate Standard Error t Value P Value
Pr > |t| Negative Binomial regression part
Intercept 1 0.427 0.092 4.64 <.0001 Med_none 0 0 . . . Med_flush 1 0.046 0.113 0.41 0.6842 Med_raise 1 0.098 0.102 0.95 0.3408 Nolane_4 0 0 . . . Nolane_2 1 0.294 0.104 2.83 0.0047 Rururb_u 0 0 . . . Rururb_r 1 -0.547 0.150 -3.65 0.0003 Thaadt 1 0.060 0.004 16.90 <.0001 Seg_lng 1 6.447 0.453 14.24 <.0001 Lanewid 1 -0.029 0.026 -1.12 0.2610 Medwid 1 -0.003 0.006 -0.51 0.6104 Spdlimt_45 0 0 . . . Spdlimt_50 1 -0.143 0.081 -1.76 0.0781 Spdlimt_55 1 -0.342 0.085 -4.04 <.0001
Logistic regression part
Inf_Intercept 1 2.323 0.385 6.04 <.0001
Inf_Thaadt 1 -0.079 0.015 -5.29 <.0001
Inf_seg_lng 1 -100.545 16.739 -6.01 <.0001
(p<0.001) . Therefore, the common practice in the U.S., reducing the speed limit from 55 mph down to 45 mph when applying curbs for updating and widening rural two-lane highways into four-lane highways, is not likely to address the curb-related safety concern.
2.5 Conclusions
There have been numerous efforts to investigate crash occurrences as related to roadway design features, environmental conditions, drivers’ characteristics and traffic features. However, very few of them have specifically considered the influence of curbs on high-speed roadways. The research presented in this section was primarily motivated by the dilemma of speed selection in roadways with the presences of curbs next to each direction of road lanes.
On the basis of the Illinois Accident Data and Roadlog File from 2003 to 2007, Wilcoxon/Kruskal–Wallis tests were performed to preliminarily identify the distribution of crash rates. Different populations of crash rates were found for road segments with different outside shoulder types, as well as various speed limits. The results, however, may be confouned by underlying associations between outside shoulder type, speed limit, and other geometric or roadway features.
ZINB models were further developed in this part of research to precisely identify the effects of curbed outside shoulders combined with other road variables on the occurrence of crashes in high speed roadways. The results suggest that the presence of curbed
outside shoulders in high-speed roads is not likely to result in a higher crash frequency compared to other types of outside shoulders. The decrease of speed limit from 55 to 50 or 45 mph will not have a positive effect on road safety because crash frequencies for the speed limits of 45 and 50 mph are significantly higher than that for the speed limit of 55 mph.
The ZINB models estimated here incorporate the safety effects of several roadway geometric designs and traffic features of interest to traffic and transportation engineers. Based on the ZINB models, the other conclusions that can be drawn include:
§
Crash frequency increases as AADT and segment length increase;§
Road segments with 4 lanes have a lower crash frequency than those with 2 lanes;§
Roads in urban regions are associated with a higher crash frequency than those in rural regions;§
Flush median appears to be associated with the lowest crash frequency, followed by raised median. Roads without medians had the highest crash frequency;§
Outside shoulder width and median width are not significantly related to the number of crashes;§
Increases of lane width were found to be related to lower crash frequency;However, there are other factors of interest not been considered in these models, for example, vertical and horizontal curves, intersections, traffic signs, weather, light, pavement defects and drivers’ characteristics. In addition, potential interactions existing among explanatory variables (such as median type and median width, outside shoulder
type and outside shoulder width) were ignored in these models, and should be examined in the future endeavors. Moreover, the crash frequency by different severity level (fatality, injury, property damage only, and so forth) across different types of crash (curb involved, run out of road, sideswipe and so forth) are also suggested as topics for the futher research.
To sum up, curbed outside shoulders are acceptable in high-speed (up to 55 mph) roadways in terms of the crash frequency, and lowering the speed limit from 55 mph to 45 mph on high-speed roadways with curbed outside shoulders is not recommended.
References
AASHTO, 2005. A policy on geometric design of highways and streets, Washington, D.C.
Abdel-Aty, M.A., Radwan, A.E., 2000. Modeling traffic accident occurrence and involvement. Accid. Anal. Prev. 32, pp. 633–642.
Akaike, H., 1973. Information theory and an extension of the maximum likelihood principle. In B.N. Petrov and F.Csaki (Eds.), Second international symposium on information theory, pp. 267-281.
Andrew, V., Bared, J., 1998. Accident Models for Two-Lane Rural Segments and Intersections, paper presented at the 77th Annual Meeting of the Transportation Research Board.
Baek, J., Hummer, J., Williams, B.M., Cunningham, C.M., 2006. Reasonable speed limits on suburban multilane highways with curbs. Transport. Res. Record 1969, pp. 10-11.
Baek, J., Hummer, J., 2008. Collision models for multilane highway segments to examine safety of curbs. Transport. Res. Record 2083, pp. 128-136.
Bligh, R.P., Mak, K.K., 1999. Crashworthiness of roadside features across vehicle platforms. Transport. Res. Record 1690, pp. 68–77.
Carson, J., Mannering. F., 2001. The effect of ice warning signs on accident frequencies and severities. Accident Anal. Prev. 33(1), pp. 99-109.
Council, F.M., Mohamedshah, Y.M., 2009. Guidebook for the Illinois state datafiles, FHWA, U.S. Department of Transportation.
Garber, N. J., Ehrhart, A. A., 2000. Effect of Speed, Flow, and Geometric Characteristics on Crash Frequency for Two-Lane Highways. Transport. Res. Record 1717, pp. 76– 83.
Greene, W., 1994. Accounting for Excess Zeros and Sample Selection in Poisson and Negative Binomial Regression Models, Working Paper, Department of Economics, New York University.
Hadi, M.A., Aruldhas, J., Chow, L.F., Wattleworth, J.A., 1995. Estimating safety effects of cross-section design for various highway types using negative binomial regression. Transport. Res. Record 1550, pp. 169-176.
IDOT, 2010, Illinois Department of Transportation, Bureau of design and environment manual-cross section elements 32-2.04.
Jovanis, P.P., Chang, H.L., 1986. Modeling the relationship of accidents to miles traveled. Transport. Res. Record 1068, pp. 42-51.
Joshua, S.C., Garber, N.J., 1990. Estimating truck accident rate and involvements using linear and Poisson regression models. Transportation Planning and Technology 15(1), pp. 41-58.
Knuiman, M.W., Council, F.M., Reinfurt, D.W., 1993. Association of median width and highway accident rates. Transp. Res. Rec. 1401, pp. 70-82.
Lambert, D.,1992. Zero-inflated Poisson regression, with an application to defects in manufacturing. Technometrics. 34(1), pp.1-14.
Lee, J., Mannering, F., 2002. Impact of roadside features on the frequency and severity of run-off-roadway accidents: an empirical analysis. Accident Anal. Prev. 34(2), pp. 149-161.
Lord, D., Washington, S.P., Ivan, J.N., 2005. Poisson, Poisson-gamma and zero inflated regression models of motor vehicle crashes: balancing statistical fit and theory. Accident Anal. Prev. 37(1), pp. 35-46.
Miaou, S.P., Lum, H., 1993. Modeling vehicle accidents and highway geometric design relationships. Accident Anal. Prev. 25 (6), pp. 689–709.
Milton, J., Mannering, F., 1998. The relationship among highway geometrics, traffic-related elements and motor-vehicle accident frequencies. Transportation 25, pp. 395– 413.
Persaud, B., Dzbik, L. 1993. Accident prediction models for freeways. Transp. Res. Rec. 1401, pp. 55–60.
Plaxico, C.A., Ray, M.H., Weir, J.A., Orengo, F., Tiso, P., 2005. Recommended guidelines for curb and curb-barrier installations. Transport. Res. Board, NCHRP Report 537.
Qin, X., Ivan, J.N., Ravishanker, N., 2004. Selecting exposure measures in crash rate prediction for two-lane highway segments. Accident Anal. Prev. 36, pp. 183–191. Sawalha, Z., Sayed, T., 2001. Evaluating safety of urban arterial roadways. J. Transp.
Eng. 127 (2), pp. 151–158.
Shankar, V., Mannering, F., Barfield, W., 1995. Effect of roadway geometrics and environmental factors on rural accident frequencies, Accident Anal. Prev. 27(3), pp. 371-389.
Sawa, T., 1978. Information criteria for discriminating among alternative regression models. Econometrica 46, pp. 1273-1282.
Vuong, Q.H., 1989. Likelihood Ratio Tests for Model Selection and Non-Nested Hypotheses, Econometrica 57(2), pp. 307-333.
PART 3
INVESTIGATION THE INFLUENCE OF CURBS ON
SINGLE-VEHICLE CRASH INJURY SEVERITY UTILIZING
3.1 Abstract
The severity of traffic-related injuries has been studied by many researchers in recent decades. However, previous research has seldom accounted for the effects of curbed outside shoulders on traffic-related injury severity. This study introduces the Zero-inflated Ordered Probit (ZIOP) model to evaluate the influences of curbed outside shoulders, speed limit change, as well as other traditional factors on the injury severity of single-vehicle crashes. Crash data from 2003 to 2007 in the Illinois Highway Safety Database were employed in this study.
The ZIOP model assumes that injury severity comes from two distinct sources: injury propensity and injury severity when this crash falls into the injury prone category. The
modeling results show that on one hand, single-vehicle crashes that occurring on roadways with curbed outside shoulders are more likely to be injury prone. On the other
hand, the existence of a curb decreases the likelihood of severe injury if the crash was in the injury prone category. As a result, the marginal effect analysis implies that the
presence of curbs is associated with a higher likelihood of no injury and minor injury involved crashes, but a lower likelihood of incapacitating injury and fatality involved crashes. In addition, in the presence of curbed outside shoulders, the increase of speed limit from 45 to 55 mph is found to add only a small impact to the injury severity of single-vehicle crashes.
Moreover, the modeling results also highlight some interesting effects caused by vehicle type, light and weather conditions, and drivers’ characteristics, as well as crash type and