Master's Projects Master's Theses and Graduate Research
Spring 5-2016
The Effect of Mapping Technology on Fire-Based
EMS Response Times in Santa Clara County
Angela Borland San Jose State University
Follow this and additional works at:https://scholarworks.sjsu.edu/etd_projects
Part of theEmergency and Disaster Management Commons, and thePublic Administration Commons
This Master's Project is brought to you for free and open access by the Master's Theses and Graduate Research at SJSU ScholarWorks. It has been accepted for inclusion in Master's Projects by an authorized administrator of SJSU ScholarWorks. For more information, please contact
Recommended Citation
Borland, Angela, "The Effect of Mapping Technology on Fire-Based EMS Response Times in Santa Clara County" (2016).Master's Projects. 481.
DOI: https://doi.org/10.31979/etd.7bvs-qq44
The Effect of Mapping Technology on
Fire-Based EMS Response Times in Santa Clara County
by Angela Borland
A Thesis Quality Research Paper Submitted in Partial Fulfillment of the
Requirements for the Masters Degree
In
PUBLIC ADMINISTRATION
Prof. Frances Edwards. Ph.D. Adviser
The Graduate School San Jose State University
Table of Contents
List of Figures ... 5
List of Tables ... 7
Introduction ... 9
Background ... 11
The Structure of the EMS System in Santa Clara County ... 12
Dispatching Aid to Those in Need ... 15
The Anatomy of an EMS Call ... 18
Incident Development and Response Timeline ... 19
Methodology ... 21
Data Collection ... 22
Literature Review ... 25
History of Fire-Based EMS ... 25
The Importance of Response Times ... 26
San Jose Fire Department Response Times ... 29
Fire Department Staffing Levels ... 33
ISO Ratings and Their Effect On Cities ... 34
Findings ... 37
Map Technologies Used During Calls for Service ... 41
The Use of Paper Maps ... 42
Hydrant Location on GIS Maps ... 47
Changes in Department Mapping Technology Since 2012 ... 48
Signal Preemption Technology ... 49
Call Response Models ... 50
Response Times & Call Volume ... 51
Analysis ... 55
CAD Technology ... 55
Geographic Information Systems ... 57
Paper Maps ... 59
Traffic Signal Preemption ... 60
Google Maps and Waze ... 62
Conclusion ... 65
Areas for Future Study ... 67
References ... 69
Appendices ... 77
Appendix A: Survey Questions ... 77
Appendix B: Survey results for questions 1-8 ... 79
List of Figures
Figure 1: Call for service progression. ... 18
Figure 2: Service Population of Surveyed Fire Departments ... 38
Figure 3: 2015 Service Area of Surveyed Fire Departments ... 39
Figure 4: 2015 Population Density of Surveyed Fire Departments ... 40
Figure 5: Map Technology Used in Surveyed Fire Departments ... 42
Figure 6: Staff in Charge of Paper Maps Updates in Surveyed Fire Departments. ... 44
Figure 7: Frequency of Paper Map Updates in Santa Clara County ... 45
Figure 8: Frequency of Paper Map Updates in the San Francisco Bay Area Fire Departments Surveyed. ... 46
Figure 9: Hydrant Location Reference in Surveyed Fire Departments ... 47
Figure 10: Upgrades to Map Technology Since 2012 in Surveyed Fire Departments. .... 48
Figure 11: The Use of Signal Preemption Technology in Surveyed Fire Departments. .. 49
Figure 12: Call Response Models in Surveyed Fire Departments. ... 50
Figure 13: 2015 Average Response Times of Surveyed Fire Departments for All Calls.52 Figure 14: 2015 Calls for Service for 29 Departments. ... 53
List of Tables
Table 1: Santa Clara County Fire Service ... 11
Table 2: Population Density for Geographic Areas ... 16
Table 3: Response Time Requirement in Urban Response Zone ... 16
Table 4: Response Time Requirement in Suburban Response Zones ... 17
INTRODUCTION
When an emergency call comes in to dispatch, a quick and regimented chain of events begins. The response is influenced by several factors, but the ultimate goal in that moment is to identify the immediate need and assign appropriate emergency assets. However, as fire departments struggle to adjust to growing populations and declining budgets they may find themselves revisiting procedures in an effort to maintain current levels of service with fewer resources.
Response times are a crucial measurement tool in fire departments because they can contribute to determining whether the outcome of an event will be positive or
negative. Cutting edge life-saving measures and technologies will not matter if help does not arrive within the window of time that will make a difference. Therefore, it is
imperative that fire departments and their companies eliminate any obstacles that may impede their ability to respond within mandated times.
One issue that could hinder response times is the use of inadequate or outdated map technology on emergency apparatuses.
In 2014, an audit ordered by the Santa Clara County Board of Supervisors found that San Jose Fire Department was not meeting the response times for emergency medical services (EMS) calls set forth by the Santa Clara County Public Health Director in the Emergency Medical Services (EMS) Provider Agreement that covers the department’s emergency medical technician (EMT) and paramedic-staffed units. The audit, conducted by Roger Mialocq, a county auditor with Harvey M. Rose Associates, found that two
contributing factors stood out among the rest: inadequate mapping technology and poor or non-existent signal preemption technology. Both of these factors were found to impact response times by impeding the ability of a fire company to safely travel to calls for emergency medical service within the contracted response times (Santa Clara County Board of Supervisors, 2014). While traffic volumes and infrastructure limitations like median strips and one-way streets also contribute to slower response times, the traffic signal preemption system is designed to mitigate the traffic effects, while accurate maps with information needed to create efficient routing from station to call should mitigate infrastructure challenges. Therefore, the focus of this research is on the availability and quality of the mitigating factors: maps and signal preemption systems.
The goal of this research is to determine whether map technology and signal preemption technology contribute to lowering fire-based EMS response times in Santa Clara County. The research uses benchmarking among fire departments in Santa Clara County, the Bay Area, and large Western urban fire departments to determine which factors contribute to the success in meeting contracted response times. Findings from this evaluation were used to create recommendations for fire service leadership regarding resource use along the continuum of fire department-based EMS response to 9-1-1 calls for medical service.
Background
The County of Santa Clara is located at the south end of the San Francisco Bay, in what is commonly referred to as “Silicon Valley.” The county encompasses 1,304 square miles of land and water, and is home to more than 1.8 million people (U.S. Census, 2010).
Santa Clara County is served by 13 fire departments. Of these departments, eight are municipal, two are state run, one is a multi-city fire district,, one is a volunteer department, and one possesses federal exclusivity. Many of these departments offer Advanced Life Support (ALS) services and employ paramedics accredited through the California Emergency Medical Services Authority (EMSA) (Santa Clara County Certification, Accreditation and Credentialing, n.d.).
Table 1
Santa Clara County Fire Service
Department Name Type Service Provision
California Dept. of Forestry State BLS
Gilroy Fire Department Municipal ALS
Milpitas Fire Department Municipal ALS
Morgan Hill Fire Department Municipal/State ALS
Mountain View Fire Department Municipal ALS
NASA/Ames Fire Department Federal ALS
Palo Alto Fire Department Municipal ALS
San Jose Fire Department Municipal ALS
Santa Clara County Fire Department Multi-City ALS
Santa Clara Fire Department Municipal ALS/BLS
South County Fire Department State ALS
Spring Valley Volunteer Fire Department Volunteer BLS
Sunnyvale Dept. of Public Safety Municipal BLS
The EMSA issues and oversees California’s EMS Systems Standards and Guidelines, standards that are primarily based on California laws and regulations. The purpose of the EMS Systems Standards and Guidelines document is “to guide local EMS agencies in the planning, organization, management, and evaluation of local EMS systems,” which the agency does by working closely with local and regional EMS authorities (Emergency Medical Services Authority, 1993).
The municipal fire departments within the county are granted authority through their respective city charters. Santa Clara County Fire Department operates as a fire protection district under the authority of the California Health & Safety Code’s Fire Protection District Law of 1987 (California Health and Safety Code, n.d.) which grants the department with “the power and responsibility to equip and maintain a fire
department within its territory, except for areas or services that fall under the jurisdiction of federal, state or other local governmental agencies” (Waldvogel, 2010). The other fire departments each have governing documents that comply with state or federal laws, depending on their jurisdiction.
The Structure of the EMS System in Santa Clara County
Santa Clara County Emergency Medical Services (SCC EMS) is managed by an EMS Director and an EMS Medical Director and is divided into three branches. The first branch oversees the Response, Enforcement, and System Coordination Programs, which are responsible for policy development, training and education of EMS providers, contract administration of Exclusive Operating Area (EOA) contracts with ambulance service providers, communications and data recordkeeping. The second branch
supervises Medical Direction, Clinical Quality Improvement (CQI) and Performance Analysis Programs. This branch is responsible for county medical protocols, pre-hospital CQI, and resource allocation. The third branch is the Business Services Program, which offers financial and administrative support for the entire EMS system (Santa Clara County, n.d.).
Fire departments in Santa Clara County operate their EMS services under a contract with SCC EMS. The number of fire personnel that each department staffs on an apparatus varies depending on the needs of the communities they serve. Some
departments employ a four-person staffing model on each apparatus, while others may staff with three fire personnel. Several departments within the county staff their apparatuses with cross-trained/dual-role firefighter EMTs and paramedics, offering communities the benefit of having personnel on scene that can function effectively in fire suppression, rescue, and EMS activities as needed (IAFF, 1997). Fire stations are
strategically placed throughout the county in order to be able to respond to emergencies within county mandated response times.
In 2010, the Santa Clara County Board of Supervisors approved a 5-year contract with Rural/Metro to provide paramedic ambulance services in Santa Clara County. The City of Palo Alto, which provides its own ambulance service, and NASA Ames Research Center, which maintains federal exclusivity, were excluded from the 2010 contract (Davies & Schenck, 2011). Agreements prior to 2010 existed between the fire
departments and the county’s previous ambulance service provider; however, the 2010 contract enacted a crucial change. It facilitated a direct relationship between fire departments and the county EMS authority. It established the county as the regulatory
authority for the collection and disbursement of First Responder Funds: funds provided by Rural/Metro to fire departments when departments meet response time performance standards (Davies & Schenck, 2011). The new contract also ensured that fire departments would meet the Health and Safety Code requirements identified in section 1797.204 of the Emergency Medical Services and Ambulance Provider Agreement (Santa Clara County, 2011).
The response time standard was established by the EMSA in the California EMS System Standards and Guidelines. Section 4.05 of the EMSA Standards and Guidelines the minimum standard states the following:
“Each local EMS agency shall develop response time standards for medical responses. These standards shall take into account the total times from the receipt of the call at the primary public safety answering point (PSAP) to the arrival of the responding unit at the scene, including all dispatch intervals and driving time.”
Contractual response times, as set forth in Santa Clara County’s 9-1-1 Emergency Medical Services Provider Agreement vary according to population density and the nature of the request for service. Santa Clara County’s ambulance service provider, Rural/Metro, is held to a different response time standard and is required to respond to EMS requests within 12:59 minutes of dispatch for at least 92 percent of calls (Abaris Group, 2013).
Dispatching Aid to Those in Need
Some cities in Santa Clara County operate their own public service answering points (PSAP). However, a number of cities, as well as county resources, use Santa Clara County Communications (SCCC) to provide 9-1-1 call taking and radio dispatch services (Abaris Group, 2013). SCCC uses a computer aided dispatch (CAD) system designed and supported by the county’s Information Services Department. Timely upgrades and lower costs demonstrate some of the advantages of this system design over a vendor-provided CAD system. However, one important limitation to note is that the current system does not employ a comprehensive geographical information system (GIS), which uses latitude and longitude coordinates. As a result, the GIS finds the closest cross streets to the call origin and dispatches ambulances based on that information rather than from where the call is actually originating (Abaris Group ,2013). Furthermore, the Mobile Area Routing and Vehicle Location Information System (MARVLIS) creates discrepancies in response time estimates due to a lack of pinpoint accuracy on call location (Abaris Group, 2013).
When a request for service is received dispatchers use the Medical Priority Dispatch System (MDPS) in order to determine the appropriate response mode as well as the amount and type of resource(s) to send (Abaris Group, 2013). Dispatchers assign each call a priority classification of Alpha through Echo. The classification is determined by the perceived acuity of the call: Alpha and Bravo being of low acuity, and Charlie, Delta and Echo requiring more intervention (Sporer & Johnson, 2011). Response intervals in Santa Clara County are measured from the time that the call is dispatched to the time the apparatus arrives at the location of the emergency (Davies & Schenck, 2011).
Once call priority is assigned, fire departments are dispatched and required to arrive at an incident within the response times shown in the following four tables:
Table 2
Population Density for Geographic Areas
Classification Population
Urban >101 people per square mile
Suburban 51-100 people per square mile
Rural/Wilderness <50 people per square mile
Note. Adapted from the National Fire Protection Association 1710
Table 3
Response Time Requirement in Urban Response Zone Dispatch Classification Provider Maximum
Response Time
Notes
Alpha 12:59 First response unit ALS or BLS Bravo 7:59 First response unit ALS or BLS Charlie 7:59 First response unit ALS
Delta 7:59 First response unit ALS
Echo 7:59 First response unit ALS
Table 4
Response Time Requirement in Suburban Response Zones Dispatch Classification Provider Maximum
Response Time Notes
Alpha 14:59 First response unit ALS or BLS Bravo 9:59 First response unit ALS or BLS Charlie 9:59 First response unit ALS
Delta 9:59 First response unit ALS
Echo 9:59 First response unit ALS
Note. Adapted from the National Fire Protection Association 1710
Table 5
Response Time Requirement in Wilderness Response Zones Dispatch Classification Provider Maximum
Response Time
Notes
Alpha 21:59 First response unit ALS or BLS Bravo 11:59 First response unit ALS or BLS Charlie 11:59 First response unit ALS
Delta 11:59 First response unit ALS Echo 11:59 First response unit ALS
Note. Adapted from the National Fire Protection Association 1710
Response time compliance must occur 90% of the time for each dispatch classification. Each response that exceeds the response time results in the accrual of liquidated damages. Fines range from $50-$7,500 per response, depending on the amount of time exceeded (Davies & Schenck, 2011).
The Anatomy of an EMS Call
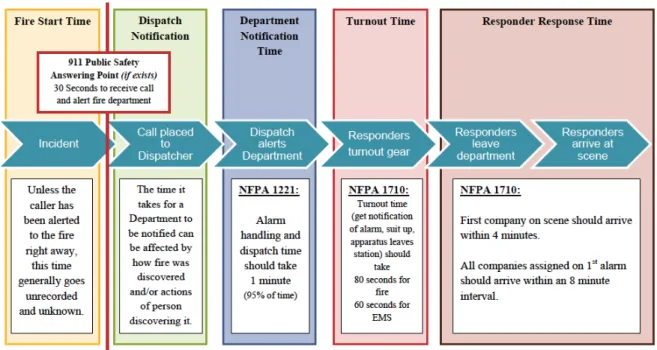
When a citizen places an emergency call to 9-1-1, a chain of events is activated. The following diagram illustrates a call for fire service and includes estimated times for each segment based on National Fire Protection Association (NFPA) 1221 Standards. While figure 1 shows the progress of a call for fire service, a call for emergency medical services unfolds in similar fashion.
Figure 1. Call for service progression.
Incident Development and Response Timeline
Alarm transfer time: The time interval from the receipt of an emergency alarm at the public service answering point until the alarm is first received at the fire department communications center. Alarm transfer time should not exceed 30 seconds for 95% of the alarms processed (NFPA 1221).
Alarm answering time: The time interval that begins when the alarm is received at the fire communication center and ends when the alarm is acknowledged at the fire
communication center. Each department shall establish a performance objective of not more than 15 seconds for at least 95% of alarms, and not more than 40 seconds for 99% o alarms (NFPA 1221).
Alarm processing time: The time interval from when the alarm is acknowledged until response information is transmitted via voice or electronic means to emergency response facilities (Fire stations). Departments should establish a performance objective of having an alarm processing time of no more than 60 second for at least 90% of alarms and not more than 90 seconds for 99% of alarms.
Turnout time: Begins at alarm answering time and ends at the beginning point of travel time. NFPA 1710 requires that turnout time should be 80 seconds for fire incidents and 60 seconds for EMS incidents. The time differential is based on the extra time needed to don personal protective equipment for firefighting. EMS response is conducted in the same uniforms worn in the station.
Travel time: The time interval that begins when a unit is sent en route to the emergency incident and ends when the unit arrives at the scene. NFPA 1710 states travel time to a fire incident should be four minutes or less.
The standards set forth by Santa Clara County are derived from standards recommended by the NFPA. However, the NFPA 1710 says that firefighters should be able to depart their station or other current location within 60 seconds of receiving notification of the call, and that advanced life support crews, once en route, should be able to travel to and arrive at the scene within 8 minutes (NFPA, 2016). The NFPA does not include turnout time in travel time; therefore, the NFPA’s total response time
standard is one minute longer than the standard in the contract between cities and the county (Santa Clara County Board of Supervisors, 2014).
Once en route to a call, fire companies are dependent on route-finding technology to guide them to a call origin. Fire departments employ several different types of route-finding methods. Computer-aided dispatch (CAD) data sent directly to a mobile data terminal (MDT) is used in a majority of fire apparatuses in Santa Clara County.
Additionally, fire companies may use hard copy map books and wall maps, as well as run books and run cards created and maintained by firefighters. Accurate and up-to-date maps are essential to a successful EMS response; however, CAD databases do not always include new developments, or may not provide street directionality for responding units, which creates a potential delay in response.
METHODOLOGY
This research was conducted using process evaluation and benchmarking methods. Process evaluation requires identifying the problem (efficient route-finding to calls for EMS service), the solutions (traffic signal preemption, routing information through various mapping techniques), implementation (installation and use of signal preemption and use of various types of maps) and evaluation of the solution’s effectiveness, the focus of this research.
The problem of extended response times was identified. The solutions
implemented in the past to decrease response times included MDTs, various types of physical maps and the use of traffic signal preemption systems. An evaluation of the response times generated by the San Jose Fire Department suggested that there was a problem with the attainment of the mandated EMS response times which might be based on the failed implementation of these technologies: the maps might be outdated or otherwise inadequate, and the traffic control device systems might not be working. The research question was whether outdated or otherwise inadequate maps might be the proximate cause of the failure to reach EMS 911-call sites within the mandated response times.
To determine whether maps were a central cause of slow response times data were gathered on the types of maps and mapping technologies used by fire departments in Santa Clara County and other Bay Area fire departments. The City of San Jose’s Fire Department’s response times were benchmarked against the other Bay Area fire
in charge of Training & Operations for each fire department in Santa Clara County. Data for the seven cities served by the Santa Clara County Fire Department were aggregated under that department. Additionally, telephone interviews of Training and Operations Chiefs throughout the other eight Bay Area counties were conducted to gather a sample to benchmark from. The interviews consisted of a series of questions designed to elicit a better understanding of the navigational challenges fire departments face, including outdated or non-existent map technology, broken or ineffective traffic signal preemption systems, rapid population growth and an increase in urban density. Data collected also included average EMS response times and call volume data. Collected data was analyzed by benchmarking the county’s fire departments against the other departments in the San Francisco Bay Area.
Data Collection
This research compared map technology used by fire departments in the San Francisco Bay Area to that used by departments within Santa Clara County.
Departments that were funded and operated by city or town governments were selected to participate in interviews. County-run fire departments were excluded. A list was established by researching which Bay Area governments met the aforementioned qualification. Initially 42 fire departments were identified as potential benchmark
departments. Phone surveys generated a 57% response. Interviews took between 10 and 15 minutes each.
The survey requested information on the different types of route-finding technologies being used by a department, whether paper maps were still being used,
changes in technology since 2012, the use of traffic signal preemption technology, and response models used. The survey questions are in Appendix One. The survey was intended to explore how departments are employing different available technologies and whether the selected technology impacts response times. The information was recorded on a spreadsheet for analysis.
The US Census, Google Maps and other public documents were used to collect factual data on communities and fire departments.
LITERATURE REVIEW
History of Fire-Based EMS
Fire departments have offered emergency medical services since the development of a pre-hospital care system. Fire-based EMS services were formally introduced in 1960 after President John F. Kennedy identified trauma as a public health “crisis,” and named automobile accidents as a leading public health concern. As Americans’ love affair with the automobile grew, so did the number of traumatic and fatal traffic accidents on the nation’s highways. In addition to trauma, the public’s attention was being shifted to the growing concern of cardiovascular disease (Shah, 2006).
In 1966, the President’s Commission on Highway Safety established pre-hospital transportation of the injured as a community action program (Shah, 2006). Up until this point the government had focused on vehicle design safety, road design, preventative programs, and safety education as a means to decrease highway death tolls. This report acknowledged that a system of caring for and transporting injured motorists was needed to address the growing trauma “crisis.”
In 1973, Congress enacted the EMS Systems Act, which officially defined EMS as the provision of “…health care services under emergency conditions…” (Robbins, 2005). The EMS Systems Act of 1973 amended the Public Health Service Act, signed by President Roosevelt in 1944, and paved the way for the development of a comprehensive emergency medical service system (Emergency Medical Services Systems Act, 1973). The EMS Systems Act also funded and authorized the Department of Health Education and Welfare (DHEW) to develop a nationwide EMS system (Baez & Pozner, 2009).
The EMS system of today operates much differently than it did in its early years. At its inception, EMS transports were thought to be no more than large cars “with a stretcher that can transport the sick and injured to the hospital. Treatments and protocols were based on assumptions and anecdotes. (Gerber, n.d.).” EMS today focuses largely on acute disease and injury interventions that are proven to be effective by way of rigorous medical research (Gerber, n.d.). Advances in medical technology, patient safety, and response times have all led to improved outcomes for those in need of emergency intervention and transport (Gerber, n.d.).
The Importance of Response Times
In EMS there are two widely known and largely adhered to concepts that increase the chance of a positive outcome for patients during emergency events. The first, named the “Golden Hour,” was observed and developed by R. Adams Cowley, MD, at the
University of Maryland Medical Center in Baltimore after his experiences and
observations during World War II. The principle of the Golden Hour dictates that trauma patients have the best chance of survival if they can be transported and begin to receive definitive care within 60 minutes of being injured (Eisele, 2008).
While some experts debate the validity of the one-hour time limit, the principle provides the underlying framework for EMS today. When an emergency transpires, three things must happen in quick succession in order to give patients the best chance for survival: 1) get to the patient quickly, 2) fix what can be fixed in the field, and 3) rapidly get the patient to the right hospital (Eisele, 2008).
The second rule is known as the “Platinum Ten.” This principle dictates that a patient needs to be assessed, have treatment initiated and transport underway by the end of ten minutes on scene in order to provide the best chances of recovery or survival (Watson, 2001).
In order for these two rules to benefit the public, EMS providers need to be able to reach the scene of an emergency with all necessary equipment within a certain amount of time, the “total response time.” Total response time is measured from the time a call is received by the emergency communications center to the time the first unit arrives on scene (U.S. Fire Administration, 2006). The time includes all communication a citizen has with an emergency dispatcher, the relay of information between dispatch and the station crew, the time it takes for firefighters to get suited up, and travel time to the call origin.
Several professionally recognized national associations have issued response time standards that they believe need to be met in order to adequately protect communities.
The National Fire Protection Association (NFPA) is a nationally recognized trade association that works to develop a cohesive set of standards that serve as a framework for the fire protection industry. While the standards are a set of ideals to strive for, differences in needs between agencies make the level of service the standards dictate difficult to attain consistently. Station geography, residence dispersion, traffic issues, and road design can make NFPA response times unrealistic (ESRI, 2007).
The NFPA recognizes that each department is presented with a set of unique challenges and has developed these standards to give communities a benchmark, formed
EMS operating protocols. For example, the goal in the NFPA 1710: Standard for the Organization and Deployment of Fire Suppression Operations, Emergency Medical Operations, and Special Operations to the Public by Career Fire Departments is as follows: 60 seconds to turn-out, 4 minutes for the first engine company to arrive, and 8 minutes for the full first-alarm assignment for at least 90 percent of all fire calls (National Fire Protection Association, 2015). The rationale behind this is the fact that a room fire will reach a critical stage in fire development (point of flashover) in about 8 to 10 minutes.
While the NFPA standard is fire-based, and does not directly correspond to medical emergencies, the standard still benefits the public in all emergency
circumstances. For example, the 8-minute response time standard widely used by EMS personnel is in place to ensure early intervention to patients in cardiac arrest (Shah, 2006).
Failure to meet these standards can lead to deadly consequences. In his New York Post article titled Slow FDNY EMS Response Times in Bronx, Aaron Short states, “A rapid EMS response significantly increases a patient's chance of survival. Brain death can occur in four to six minutes in respiratory arrest, cardiac arrest and overdose cases” (Short, 2015).
As departments fail to meet response time goals, and administrative leaders are forced to explain why, often the prevailing reason has to do with staffing levels. Since 2009, cities across the nation have been forced to cut public safety budgets to make up for short falls elsewhere. In California, several fire departments have instituted hiring freezes in an effort to save money through employee attrition. Other departments may be
required to lay off personnel to compensate for budget shortfalls. As a result, fire departments are forced to do more work with less manpower. Smaller departments are forced to rely heavily on mutual aid (Walters, 2011).
While staffing levels may be the largest contributor to response time non-compliance, it is certainly not the only one.
San Jose Fire Department Response Times
In 2014, the Santa Clara County Board of Supervisors launched an audit of San Jose Fire Department’s (SJFD) emergency response times. The audit was requested and approved after SJFD failed, for 14 consecutive months, to meet the terms of its contract with the county as stated below (Santa Clara County Board of Supervisors, 2014).
• “On a monthly basis, participating fire agencies submit detailed reports of
all 911-EMS call responses to the Emergency Medical Services Agency of the County Public Health Department (County EMS). County EMS
analyzes the reported data and determines the timeliness of performance of each participating fire agency against the contract standards for Code 2 (no lights and sirens) and Code 3 (lights and sirens) 911-EMS responses. Based on actual performance each month, County EMS authorizes
payment of First Responder incentive funds to the fire agencies, which are then paid by the County ambulance service provider (Rural/Metro)
pursuant to the 2010 ambulance contract between the County and Rural/Metro. The contract performance standards require a minimum of 90 percent of all Code 3 911-EMS responses to arrive within seven
minutes and 59 seconds (7:59), and 90 percent of all Code 2 911-EMS responses to arrive within 12 minutes and 59 seconds (12:59).”
• “In accordance with Section IX of the contract between the County and the City,
failure to achieve the 90 percent performance standard for three consecutive months, or four months in any 12-month period, is deemed to be a material breach of the contract and may result in termination of the ability to participate in the first responder funding program and/or forfeiture of first responder funding” (Santa Clara County, 2011).
Instead of meeting the 90 percent compliance standard, SJFD was in compliance an average of 88 percent of the time over the 14-month period (Rosenberg, 2014).
The audit, and subsequent in-person interviews with SJFD personnel, exposed several factors that contributed to the department’s failure to meet response time standards. The first complaint was that the department’s maps were outdated and
inefficient. Fire departments operating in Santa Clara County typically use three types of mapping sources Mobile Data Terminals (MDT), Lynx maps, and run books.
MDTs are computers mounted to the apparatus that provide a suggested route to the call and track the vehicle’s progress to the call. When asked about the efficiency of MDTs while on calls firefighters cited several problems including slow vehicle tracking, and the inability of the software to offer directionality, which makes it difficult to
determine which direction to turn when en route to a call. Additionally, firefighters stated that the map data available on an MDT often does not include new street development in
a district (Santa Clara County Board of Supervisors, 2014).
Lynx maps are laminated maps of both specific districts and the entire city. Again, the downside to Lynx maps is that they are often outdated. SJFD’s most recent Lynx map book was last updated in 2004 (Santa Clara County Board of Supervisors, 2014).
Run books, or run cards, are books or cards hand made by firefighters that offer routes to streets within a response area. These cards may not be used consistently and therefore are not always kept up to date (Santa Clara County Board of Supervisors, 2014).
The changes in development patterns can also affect response times. Development in and around Santa Clara County is shifting from single-family homes to multi-family projects such as condominiums, townhomes, and apartments. These projects often contain multiple addresses in condensed areas and non-public internal streets, which are not usually included in mapping resources (Santa Clara County Board of Supervisors, 2014).
An additional issue that was found to affect response time involved faulty or nonexistent signal preemption on major roadways, forcing fire apparatuses to travel at lower rates of speed to calls (Santa Clara County Board of Supervisors, 2014). SJFD uses the Opticom signal preemption system. The Opticom system uses an infrared signal emitter, placed on the front of an emergency apparatus, which transmits a secure signal to a detector on a traffic light. When the system is functioning properly, the signal light will stop cross traffic by turning their signal red, and change the signal to green for the
service (Opticom IR System - GTT, n.d.).
Another problem cited by SJFD, and recently highlighted by NBC Bay Area News (“Traffic Congestion,” 2015) concerns traffic congestion resulting from street design and medians. Medians eliminate the option of crossing over into opposing lanes to circumvent stopped traffic. During high traffic periods fire apparatuses may not be able to navigate city streets quickly and safely enough to meet response time standards during Code 3 calls. Stewart Gary, former chief of Livermore-Pleasanton fire department, says a city’s “response times should be matched to risks, desired outcomes, topography, and road network challenges” (Bialik, 2012).
Congestion can also occur within the 9-1-1-system. Frequently, the overburden of the 911-system stems from convalescent homes and areas where the homeless
congregate. Calls for service to these areas are often not “true” emergencies. These calls tie up resources, thus making it difficult to respond to real emergencies within county response time standards. A study published in the Annals of Emergency Medicine in 2010 “found that frequent (emergency department) users comprise 4.5 percent to 8 percent of all ED patients, yet account for 21 to 28 percent of all visits” (LaCalle & Rabin, 2010). One proposed solution to this problem would be the implementation of a Community Paramedicine Program, which could be used to address the needs of those who need assistance but are not in a true state of emergency. Community Paramedicine Programs are being piloted in several cities in the U.S. and are increasingly seen as a viable option to reduce congestion in the 9-1-1-system (Emergency Medical Services Authority, 2015).
Fire Department Staffing Levels
Reducing response time is critical to producing positive outcomes in both fire and medical emergencies, however, current staffing levels in several Santa Clara County fire departments do not meet the minimum staffing standards set by national, state, or local agencies. When a company is sent to a call, fire or medical, they are essentially out of service for any other emergency that may happen in their district. They are “first due” on scene, leaving the district they serve uncovered. Therefore, a second company must assume responsibility for the next emergency that occurs, however, that second company is now out of the district it is responsible for. If an emergency occurs, the second due engine will need to travel farther, and into less familiar territory, adding to response time. Fire departments plan for these possibilities, but with a minimally staffed department these occurrences happen more frequently. NFPA response times are “not widely being met at this point because of how much (sic) resources are needed to comply with those,” according the Ken Willette, manager of the NFPA public fire protection division (Bialik, 2012).
The NFPA standard recommends four people per apparatus: two members trained at the emergency medical technician-paramedic level, and two members trained at the emergency medical technician-basic level (NFPA, 2016). SJFD adheres to this staffing model; however, there are some cities that operate companies with three people per apparatus instead of four. If a three-person company is dispatched to a fire event, they must either wait for a Battalion Chief to arrive on scene to meet the “2 in/2 out” standard, or they must wait for a second company to arrive. When there is a known rescue, a fire company can enter a building to perform rescue operations without having four personnel
on scene. However, if there is no known rescue, and property is engulfed in flames, the first company must wait for a second company to arrive before charging the hoses and entering the building, wasting valuable moments that may delay extinguishment and increase property loss. The NFPA is not the only association to advocate for a four-person company. The U.S. Occupational Safety and Health Administration (OSHA) advises four-person companies in order to adhere to the 2 in/2 out rule of firefighting (U.S. Department of Labor, n.d.), and the California Professional Firefighters follows NFPA standards for response times and fire suppression personnel (National Fire Protection Association, 2016).
ISO Ratings and Their Effect On Cities
There are obvious consequences when departments fail to meet response times, such as loss of life or property, but the consequences extend farther than those that occur on scene. Consistent failure to meet contract standards can financially impact a municipality and all of its residents. The Insurance Service Office (ISO), an agency that provides statistical risk assessment information to insurance companies, periodically evaluates municipalities in Santa Clara County. According to the website, Fire Chiefs Online, this evaluation “provides up-to-date information about municipal fire protection service throughout the country” (How the PPC Program Works, n.d.).
The ISO Fire Suppression Rating Schedule (FSRS) evaluates a community’s fire suppression system and generates a Public Protection Classification (PPC) rating. Cities are rated on a scale of 1-10, with one being the best possible rating, and 10 being the worst. The FSRS draws upon standards set by the NFPA, the Association of Public
Communications Officials (APCO), and the American Water Works Association (AWWA), and provides a benchmark that local governments can measure against. It evaluates the following four categories of fire suppression:
1. The fire department: This evaluation reviews the number of engine, ladder, or service companies, the distribution of fire stations and fire companies, the equipment carried on an apparatus, pumping capacity, reserve apparatuses, department personnel, and training. It counts for 50% of the total classification. 2. Emergency Communications: This evaluation looks at community facilities and support used for handling and dispatching fire alarms. It counts for 10% of the total classification.
3. Municipal Water Supply: This evaluation determines the adequacy of a community’s water supply for fire suppression purposes. Hydrant size, type, frequency of inspection, and condition are all taken into consideration. This counts for 40% of the total classification.
4. Community risk reduction: This evaluation can serve to offset negative
evaluations in the prior three categories. It is based on the efficacy of community programs that focus on fire safety and prevention. It does not count toward the total classification but can be looked upon as extra points (Ready, Set, Go & ISO, n.d.).
Insurance companies use PPC information to determine policy prices, establish deductibles, and offer coverage for both homes and businesses. “Assuming all other
factors are equal, the price of property insurance in a community with a good PPC is lower than in a community with a poor PPC” (Wileman, 2015).
Since 50% of the total classification is determined by the quality of the fire department itself, decreased personnel levels can drastically impact ISO PPC ratings, significantly increasing homeowner insurance premiums. According to the ISO’s FSRS Item 560, “The built-upon area of a city should have a first-due engine company within 1-1/2 miles and a ladder-service company within 2-1/2 miles” (Fire suppression rating schedule, n.d.).
Another factor that impacts the PPC rating is the proximity of a residence or business to either a fire station or a fire hydrant. In order for a structure to be considered protected it must be within 5 miles of a fire station, or within 1,000 feet of a fire hydrant. Many residents in rural areas falsely believe they meet these criteria if they are within proximity of a Fire or U.S. Forest Service station. However, ISO identifies both Cal-Fire and U.S. Forest Service as wildland fire stations that “do not meet the minimum equipment requirements for structural fire suppression and therefore are not approved by the ISO for structural fire suppression” (Wileman, 2015).
Examples of these situations can be found along California’s Sierra Nevada foothills, where rural communities are abundant and depend largely on volunteer
departments or Paid Call Staffing (PCS) programs. ISO PPC ratings can deteriorate when PCS levels are reduced. Staffing levels can impact ratings in any community.
FINDINGS
Included in this section are the results of a survey administered via phone interview. Out of the 42 Bay Area fire departments that were identified, 24 provided information to support this research. This section is divided into the following segments: Map Technology Comparison, The Use of Paper Maps, Hydrant Location on GIS Maps, Changes in Map Technology Since 2012, The Use of Signal Preemption Technology, Call Response Models Used, and Volume of Calls for Service and Average Response Times.
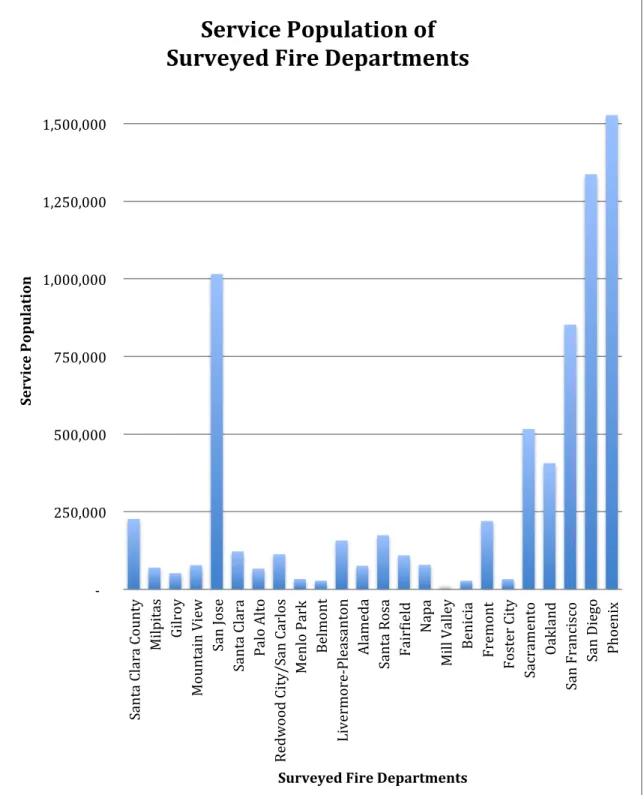
Additionally, five large Western fire departments (San Francisco, Oakland, Sacramento, San Diego, and Phoenix) were identified to provide a comparison for the city of San Jose. Phone interviews from these departments were requested, however, only one responded. As a result, demographic information for the remaining four departments was gathered through 2015 U.S. Census data. Survey information related to map
technologies used by these departments was not gathered and is not included in
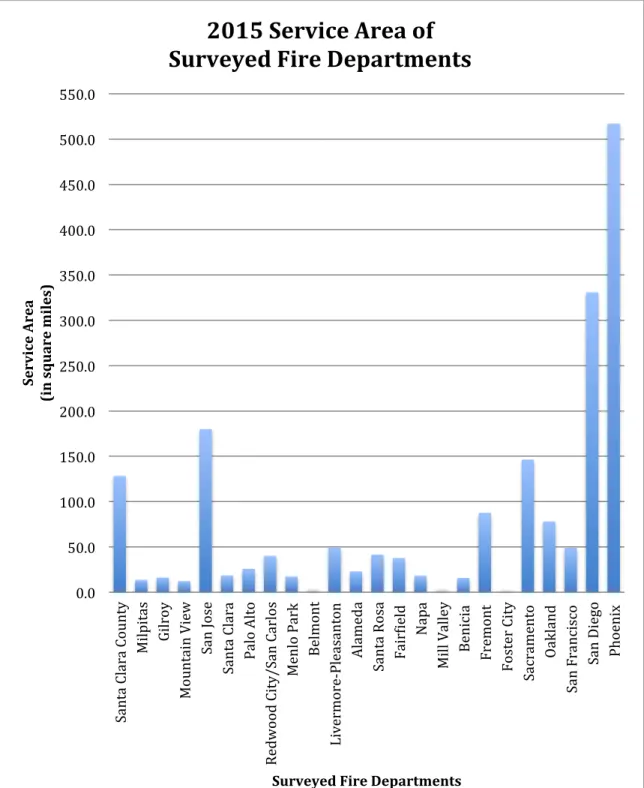
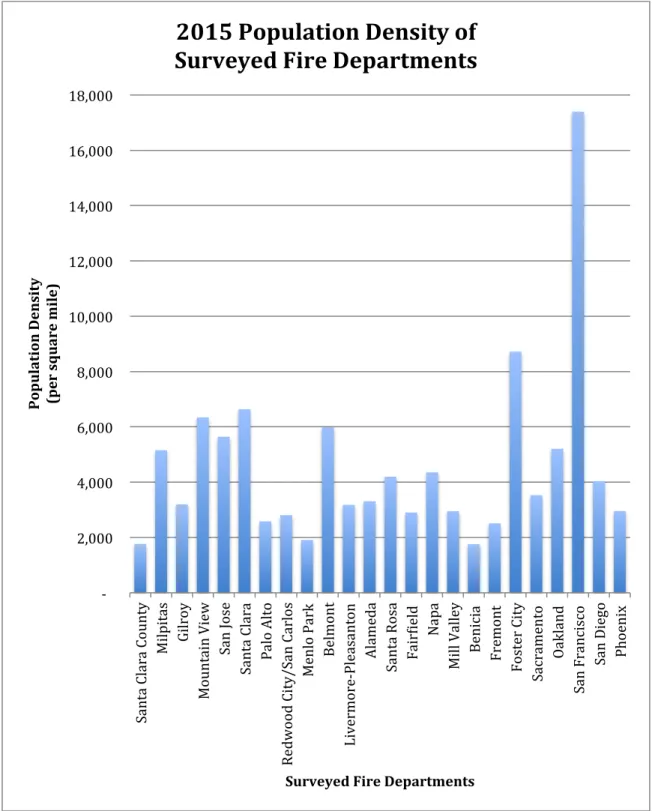
corresponding results. Figures 2 through 4 show the population size, area and density of all respondents and the five large Western fire departments.
Figure 2. Service Population of Surveyed Fire Departments. Data from U.S. Census 2015 population estimates. Retrieved from http://www.census.gov/quickfacts/table/PST045215/00
-‐ 250,000 500,000 750,000 1,000,000 1,250,000 1,500,000 Santa C lar a C ounty Mi lpi tas Gil roy Mo untai n V ie w San J ose Santa C lar a Pa lo Al to Redwood C ity/San C ar los Me nlo P ar k B el mo nt Li ve rmo re -‐P le as an to n Al ame da Santa Rosa Fa irYiel d Na pa Mi ll V alle y Be ni ci a Fr emo nt Fost er Cit y Sa cr ame nt o Oakland San F rancisco San D iego Phoenix Servic e Population
Surveyed Fire Departments
Service Population of
Surveyed Fire Departments
Figure 3. 2015 Service Area of Surveyed Fire Departments. Datat from 2015 U.S. Census Quick Facts. Retrieved from http://www.census.gov/quickfacts/table/PST045215/00
0.0 50.0 100.0 150.0 200.0 250.0 300.0 350.0 400.0 450.0 500.0 550.0 Santa C lar a C ounty Mi lpi tas Gil roy Mo untai n V ie w San J ose Santa C lar a Pa lo Al to Redwood C ity/San C ar los Me nlo P ar k B el mo nt Li ve rmo re -‐P le as an to n Al ame da Santa Rosa Fa irYiel d Na pa Mi ll V alle y Be ni ci a Fr emo nt Fost er Cit y Sa cr ame nt o Oakland San F rancisco San D iego Phoenix Servic e Area (i n sq u ar e m il es)
Surveyed Fire Departments
2015 Service Area of
Surveyed Fire Departments
Figure 4. 2015 Population Density of Surveyed Fire Departments. Data from 2015 U.S. Census Quick Facts. Retrieved from http://www.census.gov/quickfacts/table/PST045215/00
-‐ 2,000 4,000 6,000 8,000 10,000 12,000 14,000 16,000 18,000 Santa C lar a C ounty Mi lpi tas Gil roy Mo untai n V ie w San J ose Santa C lar a Pa lo Al to Redwood C ity/San C ar los Me nlo P ar k B el mo nt Li ve rmo re -‐P le as an to n Al ame da Santa Rosa Fa irYiel d Na pa Mi ll V alle y Be ni ci a Fr emo nt Fost er Cit y Sa cr ame nt o Oakland San F rancisco San D iego Phoenix P op u la ti on D en si ty (p er sq u ar e m il e)
Surveyed Fire Departments
2015 Population Density of
Surveyed Fire Departments
Map Technologies Used During Calls for Service
Of the 42 departments contacted for an interview, 24 Training & Operations Chiefs, or approximately 57%, responded to complete the survey.
Each department was asked about what type of map technology they use to guide equipment to calls for service. Research found that departments generally employed the use of multiple route finding technologies, rarely depending on any single one. Of departments that responded, 100% use computer-aided dispatch integrated with geographic information system data. This result was expected, as CAD is a
well-established technology that has been used by police and fire departments for decades. The survey also found that 86% of Santa Clara County respondents, and 96% of total
respondents use or carry paper maps, or run books, on the apparatuses to calls. Twenty-nine percent of respondents from Santa Clara County said their department uses commercial map technology, such as Google Maps, to assist them in responding to calls, compared to 75% use Bay Area wide. Some respondents stated that Google Map technology is integrated into the tablets and IPads that they use
operationally. However, the survey found that there are departments whose CAD is so antiquated that Google Maps provides a more accurate and timely route to calls, and is a favored technology over CAD routing.
Mobile route finding applications, such as Waze, are used by 14% of SCC departments, compared to 13% in the Bay Area. While departments do not rely on this technology at this time, several respondents acknowledged that it could be a helpful tool to use in the future as the population of the area continues to grow and impact traffic
Fourteen Bay Area fire departments acknowledged that they were using other technology than those listed as options in the survey. Two platforms that respondents spoke of were Mobile Area Routing and Vehicle Location Information Systems, or MARVLIS, and Avtive911. Both of these technologies offer a blend of other survey options including GIS/CAD, GPS, and real time traffic analysis.
Figure 5. Map Technology Used in Surveyed Fire Departments
The Use of Paper Maps
For the first question, regarding who is responsible for updating the maps, respondents were given four options to choose from: dedicated mapping staff within the fire
department, dedicated mapping staff within another city department, apparatus captains update their service areas, or “other.” The survey found that 43% of Santa Clara County
0% 20% 40% 60% 80% 100%
CAD/GIS Paper Maps Commercial
Maps Applications Mobile Other
Map Technology Used in
Surveyed Fire Departments
department. Forty-three percent of Santa Clara County used dedicated mapping staff in another city department and the same number assigned the job to apparatus Captains, while 38% of Bay Area departments used city staff and 29% used apparatus Captains. None of the respondents selected “other” as an option, but one Santa Clara County department and three Bay Area departments chose “not applicable.”
The survey found that this was an area of overlapping responsibilities between fire and city personnel. Many larger departments employed a GIS analyst dedicated solely to mapping for the fire department. In smaller departments, the responsibility often fell to Training & Operations Chiefs to perform the duties. Of the departments that used Training & Operations Chiefs to update maps, 30% worked closely with city staff from other departments to accomplish this task.
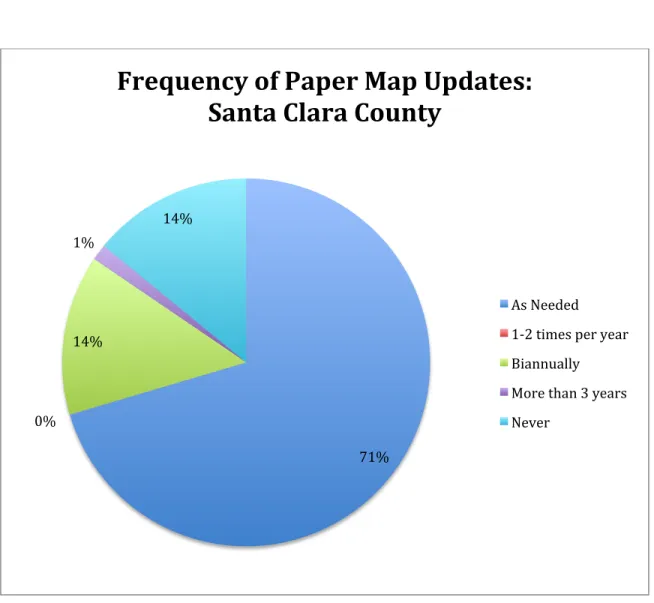
The second survey question regarding maps requested information to discern the frequency with which maps and run books were updated. Respondents were asked to choose from four options: as needed, 1-2 times per year, more than 3 years, or not
applicable. The survey found that the majority of departments both in Santa Clara County (71%), as well as the entire Bay Area (54%), updated their maps on an as needed basis. This means that maps are revised as new developments are constructed, or whenever a captain finds an inconsistency between the map and the actual city geography.
Of the remaining 11 respondents representing the Bay Area, six updated their run books 1 or 2 time per year. Two respondents’ departments had not updated their maps for more than three years.
Bros. maps. The Thomas Bros. map company ceased operations in 2009, and no updates have been issued since then. The third department stated that they were moving away from paper maps in general and increasingly relying on GIS for call location information.
One respondent stated that the department no longer uses paper maps and does not carry run books on apparatuses, relying solely on MARVLIS technology.
Figure 6. Staff in Charge of Paper Maps Updates in Surveyed Fire Departments.
0% 10% 20% 30% 40% 50% 60% 70% Dedicated FD
Staff Dedicated City Staff FD Captains Other N/A
Staff in Charge of Paper Map Updates
in Surveyed Fire Departments
Figure 7. Frequency of Paper Map Updates in Santa Clara County. Data from Fire Department Route-Finding Technology Survey and information collected during phone interviews with Battalion Chiefs, or Captains, from responding departments.
71% 0%
14% 1%
14%
Frequency of Paper Map Updates:
Santa Clara County
As Needed 1-‐2 times per year Biannually More than 3 years Never
Figure 8. Frequency of Paper Map Updates in the San Francisco Bay Area Fire Departments Surveyed. Data from Fire Department Route-Finding Technology Survey and information collected during phone interviews with Battalion Chiefs, or Captains, from responding departments.
58% 21%
5% 5%
11%
Frequency of Paper Map Updates:
San Francisco Bay Area
As needed
1-‐2 times per year Biannually
Longer than 3 years Never
Hydrant Location on GIS Maps
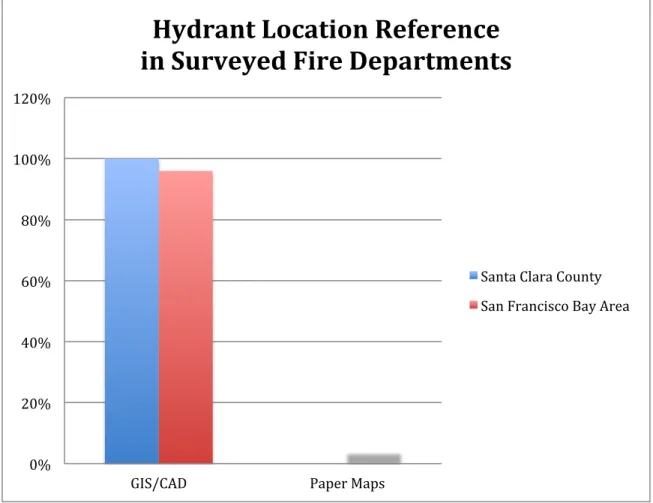
The next survey question offered a yes/no option and asked if hydrant location was available on GIS maps. The purpose of the question was to determine whether GIS technology in the Bay Area could provide hydrant location information, or if Captains were still reverting to run books to determine that information. Of the departments interviewed in Santa Clara County, 100% were referencing their GIS/CAD maps for hydrant location when needed for calls. Of the 24 responding Bay Area departments, 96% were using GIS/CAD, while 4% were still referencing paper maps.
Figure 9. Hydrant Location Reference in Surveyed Fire Departments.
0% 20% 40% 60% 80% 100% 120%
GIS/CAD Paper Maps
Hydrant Location Reference
in Surveyed Fire Departments
Santa Clara County San Francisco Bay Area
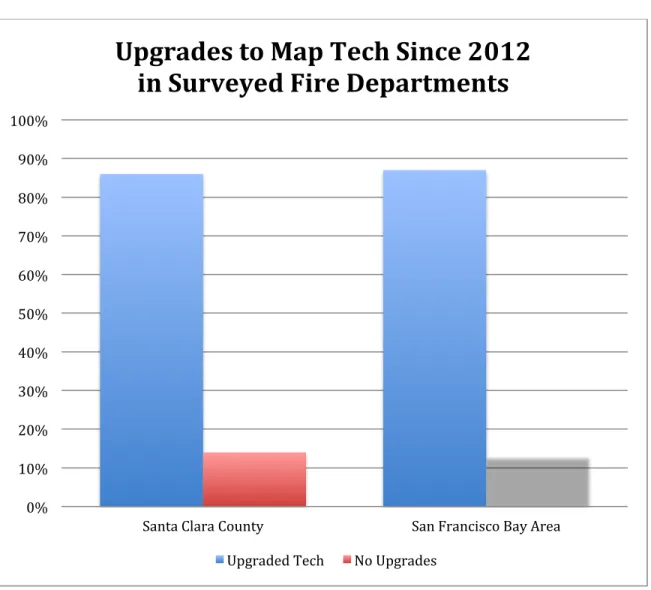
Changes in Department Mapping Technology Since 2012
The next survey question requested information on recent changes to route finding technology. The survey found that in the period of time following 2012, fire departments have been actively upgrading their mapping technology. Eighty-six percent of Santa Clara County departments, and 87% of all Bay Area departments have performed upgrades.
Figure 10. Upgrades to Map Technology Since 2012 in Surveyed Fire Departments.
0% 10% 20% 30% 40% 50% 60% 70% 80% 90% 100%
Santa Clara County San Francisco Bay Area
Upgrades to Map Tech Since 2012
in Surveyed Fire Departments
Signal Preemption Technology
Respondents were asked if their department uses signal preemption technology in apparatuses. Seventy-eight percent of respondents said that their departments possess signal preemption technology, but there was variance on how it was employed. Responding departments used strobe technology, Opticom, or dispatch-initiated
preemption. Two departments possessed preemption technology on their trucks, but their city did not have the corresponding technology on street signals; however, they were able to use the technology when responding to calls for automatic aid.
Figure 11. The Use of Signal Preemption Technology in Surveyed Fire Departments.
0% 10% 20% 30% 40% 50% 60% 70% 80% 90% 100% Santa Clara County
San Francisco Bay Area
The Use of
Signal Preemption Technology
in Surveyed Fire Departments
Call Response Models
Respondents were asked about what model of response their departments use and were given two options to choose from: Emergency Zone Response or Closest Unit Response. The survey found that 53% of respondents used an Emergency Zone Response, while the remaining 47% used a Closest Unit Response. Through interviews, it was found that the departments using a Closest Unit Response Model were also using some form of
Automatic Vehicle Location (AVL) technology, and these departments often had boundary drop agreements with neighboring cities.
Figure 12. Call Response Models in Surveyed Fire Departments.
0% 10% 20% 30% 40% 50% 60% 70% 80% 90% 100% Santa Clara County
San Francisco Bay Area
Call Response Models
in Surveyed Fire Departments
Response Times & Call Volume
All 24 interviewees were asked for 2015 call volume, and average response times for years 2012-2015. Call volume data was typically readily available and easy to obtain, but average Response Time data proved more difficult to acquire. Some departments were able to give actual time data, however, others maintained their records in the form of percentages, and many only had records for 2015. Therefore, to provide for comparability only 2015 data was used in the analysis.
The figures below illustrate response times and the number of calls for service in surveyed departments. Since San Jose Fire Department serves a larger population than other cities in the San Francisco Bay Area, response time and call volume information was gathered from comparable western cities. Oakland, San Francisco, Sacramento, San Diego, and Phoenix Fire Departments were researched for comparison. This brought the total number of departments surveyed to 29 for this portion of the research. Of the 29 respondents that were able to offer average response time data, all departments but two (both in Santa Clara County) were meeting the NFPA recommended response time standard of 7:59, and many were far exceeding this benchmark.
Figure 13. 2015 Average Response Times of Surveyed Fire Departments for All Calls. Data from Fire Department Route-Finding Technology Survey and information collected during phone interviews with Battalion Chiefs, or Captains, from responding departments, and fire department Annual Reports.
0:00 1:00 2:00 3:00 4:00 5:00 6:00 7:00 8:00 9:00 10:00 Santa C lar a C ounty Mi lpi tas Gil roy Mo untai n V ie w San J ose Santa C lar a Pa lo Al to Redwood C ity/San C ar los Me nlo P ar k B el mo nt Li ve rmo re -‐P le as an to n Al ame da Santa Rosa Fa irYiel d Na pa Mi ll V alle y Be ni ci a Fr emo nt Fost er Cit y Sa cr ame nt o Oakland San F rancisco San D iego Phoenix R esp on se T im e (i n m in u te s)
Surveyed Fire Departments
2015 Average Response Time of
Surveyed Departments for All Calls
Figure 14. 2015 Calls for Service for 29 Departments. Data from Fire Department Route-Finding
Technology Survey and information collected during phone interviews with Battalion Chiefs, or Captains, from responding departments, and fire department Annual Reports.
17,495 4,913 5,211 5,703 80,875 8,992 8,472 10,148 6,288 2,709 12,630 6,422 25,111 11,995 8,969 2,000 2,485 12,815 2,028 154,980 80,000 135,091 142,288 180,000 Santa Clara County
Milpitas Gilroy Mountain View San Jose Santa Clara Palo Alto Redwood City/San Carlos Menlo Park Belmont Livermore-‐Pleasanton Alameda Santa Rosa FairYield Napa Mill Valley Benicia Fremont Foster City Sacramento Oakland San Francisco San Diego Phoenix
2015 Calls for Service
for 29 Departments
ANALYSIS
The results of the survey indicate that, while new mapping technologies are available for use, many fire departments are operating on technology that has been in place for
decades. Reasons for this may include budget constraints, staffing difficulties, or political influences. Improvements to route finding technology, such as consolidated CAD
operations, or automatic vehicle locators, may help to improve response times.
Additionally, departments would do well to maintain updated paper maps and run books for back-up and emergency use.
CAD Technology
The research found that several versions of CAD software are used in Santa Clara County. The lack of CAD uniformity between departments could impact response times during periods where a neighboring department is providing automatic aid. Paper maps would be available during these periods, but their efficiency is based on how up-to-date they are. If the information were outdated, outside departments would be forced to use GPS or other map technology to find call origins.
San Jose Fire Department (SJFD) Deputy Fire Chief Robert Sapien, Jr. stated in his interview that SJFD currently uses the Intergraph Incident Response Management System. This system was selected because the Public Works Department uses it for citywide mapping functions. (Edwards, Personal Communication, 5/3/16). It is a good system but updating the geographic information to it takes time. Chief Sapien said that the current rate of growth in San Jose outpaces the fire department’s schedule for updating its CAD technology. This gap in updates can leave new development
unrepresented, forcing companies to rely on paper maps and personal mobile map technology, such as Google Maps, to reach their calls (Sapien, Phone Interview, 4/5/16).
San Jose is working to implement an interim solution to this problem. Sapien stated that the department is working toward utilizing a parallel tablet-based system, which would give personnel access to private technologies with up-to-date maps as well as real-time traffic information and route alternatives via mobile applications (Sapien, Phone Interview, 4/5/16).
Some counties in the Bay Area operate consolidated dispatch centers that provide dispatch services for multiple departments. Select agencies in both San Mateo and Alameda Counties use this model, and operate using a shared CAD system and Automatic Vehicle Location (AVL). One benefit of using AVL technology is that it allows a dispatch center to identify the closest available unit and deploy it to a call, theoretically reducing response times. While departments are typically responsible for covering their emergency response zone, consolidated dispatch centers allow agencies to provide services to neighboring cities through automatic aid and boundary drop
agreements.
During his interview, Palo Alto Fire Department (PAFD) Deputy Fire Chief Geo Blackshire stated that the AVL system is also beneficial to managers in his department because it allows a viewer to see where all units are at any given time (Blackshire, Phone Interview, 4/10/16). Chief Blackshire also stated that the system eliminated a problem that would previously arise when assigning next due units. Prior to the implementation of the AVL, PAFD’s old protocols contained an embedded fire engine dispatch order, which would assign a next due unit based on a predetermined procedure, even when that unit
was not the closest available when needed, resulting in lengthier response times.
According to Blackshire, AVL technology allows dispatchers to determine which unit is truly the closest to an emergency and is generally accurate to within 25 feet of the unit’s actual location.
Geographic Information Systems
The interviews found that all surveyed cities are using GIS technology integrated into their existing CAD systems. The efficacy of GIS integration fluctuates from city to city due to variances in data set comprehensiveness. GIS provides several benefits that could impact response times and fire personnel safety.
One benefit of GIS is that it has the ability to layer data. GIS begins with a base map, or “a map depicting background reference information such as landforms, roads, landmarks, and political boundaries, onto which other thematic information is placed” (ESRI, n.d.). Spatial data of this base map is divided up into a grid upon which map layers may be applied. The layered information can include almost anything a local
government chooses to keep data on, such as aerial or satellite imagery, street maps,
hydrant location information, utility connection information, highway maps, and topography maps. In order to access this information on demand, apparatuses must be continuously connected to the Internet, resulting in additional costs for equipment, maintenance, and staff time.
In order to realize the maximum benefits of GIS, cities should focus on building a comprehensive database that can be updated quickly. With a resurging economy, the Santa Clara Valley, as well as the entire San Francisco Bay Area, is experiencing growth
in both population and new construction. Many cities in the area are built out, but development trends have suggested that builders are planning to build upward,
constructing high density, multi-family dwellings (Thrasher, Phone Interview, 4/15/16), further challenging departments to meet response times. Planners can use the GIS maps to estimate the need for new firefighting infrastructure and to anticipate traffic congestion resulting from high density construction and seek workarounds for faster fire response, like flexible bollards instead of stiff or concrete delineators for traffic control, and medians with low curbs and low plantings that fire apparatus can cross in emergencies.
GIS can also be used to create comprehensive preplans. Preplan layouts allow responding personnel to analyze detailed maps to plan for search operations and attack strategies. GIS can also provide information on standpipe and hydrant locations, stairwell locations, alarm panel and control room locations, and any existing equipment caches. With GIS, fire departments can obtain map layers as planning departments upload them.
One limitation of GIS use is that the data is only as accurate as the data set it originates from. Also, departments may not have easy access to qualified GIS analysts that can explain the functions and limitations of the technology. Research showed that some of the larger departments in the area employed a department-specific full time GIS specialist, but many smaller fire departments must rely on analysts working in other city departments.
Research also revealed that there is no uniform time interval for GIS map updates in the county. Updating the GIS map requires specialized knowledge of GIS software and functions, and some cities do not have the resources to maintain completely up to date GIS maps. Out of date maps would be a threat to effective response times.