Dissertation
VTT PUBLICATIONS 732
Venkata Gopalacharyulu Peddinti
Data integration, pathway analysis
and mining for systems biology
Jure.url
VTT PUBLICATIONS 732
Data integration, pathway analysis
and mining for systems biology
Venkata Gopalacharyulu Peddinti
Department of Biomedical Engineering and Computational Science
Doctoral dissertation for the degree of Doctor of Science in Technology to be
presented with due permission of the Faculty of Information and Natural
Sci-ences, The Aalto University School of Science and Technology, for public
exami-nation and debate in Auditorium F239a at Aalto University (Otakaari 3, Espoo,
Finland) on the 14
thof May, 2010 at 12 noon.
ISBN 978-951-38-7385-1 (soft back ed.) ISSN 1235-0621 (soft back ed.)
ISBN 978-951-38-7386-8 (URL: http://www.vtt.fi/publications/index.jsp) ISSN 1455-0849 (URL: http://www.vtt.fi/publications/index.jsp) Copyright © VTT 2010
JULKAISIJA – UTGIVARE – PUBLISHER VTT, Vuorimiehentie 3, PL 1000, 02044 VTT puh. vaihde 020 722 111, faksi 020 722 4374 VTT, Bergsmansvägen 3, PB 1000, 02044 VTT tel. växel 020 722 111, fax 020 722 4374
VTT Technical Research Centre of Finland, Vuorimiehentie 3, P.O. Box 1000, FI-02044 VTT, Finland phone internat. +358 20 722 111, fax + 358 20 722 4374
Technical editing Maini Manninen
3
Venkata Gopalacharyulu Peddinti. Data integration, pathway analysis and mining for systems biology. Espoo 2010. VTT Publications 732. 62 p. + app. 67 p.
Keywords systems biology, high-throughput data, data integration, data mining, visualisation, bioinformatics, conceptual spaces, network topology
Abstract
Post-genomic molecular biology embodies high-throughput experimental
tech-niques and hence is a data-rich field. The goal of this thesis is to develop
bioin-formatics methods to utilise publicly available data in order to produce
knowl-edge and to aid mining of newly generated data. As an example of knowlknowl-edge or
hypothesis generation, consider function prediction of biological molecules.
Assignment of protein function is a non-trivial task owing to the fact that the
same protein may be involved in different biological processes, depending on
the state of the biological system and protein localisation. The function of a gene
or a gene product may be provided as a textual description in a gene or protein
annotation database. Such textual descriptions lack in providing the contextual
meaning of the gene function. Therefore, we need ways to represent the meaning
in a formal way. Here we apply data integration approach to provide rich
repre-sentation that enables context-sensitive mining of biological data in terms of
integrated networks and conceptual spaces. Context-sensitive gene function
an-notation follows naturally from this framework, as a particular application. Next,
knowledge that is already publicly available can be used to aid mining of new
experimental data. We developed an integrative bioinformatics method that
util-ises publicly available knowledge of protein-protein interactions, metabolic
net-works and transcriptional regulatory netnet-works to analyse transcriptomics data
and predict altered biological processes. We applied this method to a study of
dynamic response of
Saccharomyces cerevisiae
to oxidative stress. The
applica-tion of our method revealed dynamically altered biological funcapplica-tions in response
to oxidative stress, which were validated by comprehensive
in vivo
metabolom-ics experiments. The results provided in this thesis indicate that integration of
heterogeneous biological data facilitates advanced mining of the data. The
meth-ods can be applied for gaining insight into functions of genes, gene products and
other molecules, as well as for offering functional interpretation to
transcriptom-ics and metabolomtranscriptom-ics experiments.
Preface
This research work has been carried out at the Quantitative Biology and Bioinformatics (QBIX) Group at VTT Technical Research Center of Finland (VTT). I thank my advisor, Research Professor
Matej Oreˇsiˇc, for his excellent guidance throughout this work and the broad range of opportunities
he provided to me at work. I thank my supervisor, Professor Kimmo Kaski, Head of the Centre of Excellence, Department of Biomedical Engineering and Computational Science (BECS) of Helsinki University of Technology (TKK; called Aalto University School of Science and Technology since January 2010), for accepting me as a doctoral student and for his excellent support during this period.
I thank my co-advisor, Dr. Jaakko Hollm´en, Chief Research Scientist, Department of Information
and Computer Science, TKK, for his cooperation and excellent advise during thesis writing. The QBIX group has been reorganised into two teams since January 2009: Metabolomics and Biosystems Modelling; I belong to the latter. I thank the leaders of these two teams Dr. Tuulia
Hy¨otyl¨ainen and Dr. Marko Sysi-Aho, respectively, for their continued support to my work. I thank
Technology Manager Dr. Richard Fagerstr¨om for his support. He has readily offered help and advise
on a variety of issues. I am grateful to Dr. Juha Ahvenainen, former Vice President (R&D) (currently Vice President, Customer Management), Dr. Anu Kaukovirta-Norja, Vice President (R&D), and
Research Professor Hans S¨oderlund for the excellent working facilities. I thank Mr. Atul Khanna,
chairman of Tooltech Software Ltd, for his support during the early years of this work.
I thank all researchers who co-authored with me. Without their contributions to my publications this work would have been incomplete. I thank Mr. Erno Lindfors for his enthusiasm and excellent work, which have been crucial for the success of my work. Working with him has always been easy and effective. Working with Dr. Vidya Velagapudi has provided insights into biology. Her positive attitude and perseverance made working with her a motivating experience. I also thank Mr. Jussi
Mattila, Dr. Jyrki L¨otj¨onen, and other members of the Signal and image processing team at VTT
Tampere for their collaboration.
The working environment at VTT has been conducive for the sort of interdisciplinary research presented in the thesis. The interdisciplinary knowledge of the members of QBIX group has created a knowledgeable workspace, and I thank each and every individual of the group. Working at QBIX group has also been full of fun. I thank Mr. Laxman Yetukuri, Dr. Catherine Bounsaythip, Mr. Han Zhao, Ms. Sandra Castillo, and Mr. Pekka Savolahti for their wonderful company. A lot of discussions with them, which included topics such as culture, life, ethics, or simply fun, at the coffee table have been revitalising. Technical discussions with my present and past team mates as well as many other researchers and faculty members at VTT and TKK, have been helpful at different instances.
I thank Professor Garry Wong and Docent Tero Aittokallio for the pre-examination of the thesis. Their valuable comments were insightful and enhanced the presentation of the thesis. I thank all my colleagues who read my thesis and provided their valuable comments. I thank Dr. Kaija Virolainen, Ms. Anna-Kaarina Hakala, and Ms. Sirpa Nygren for their help with many practicalities.
PREFACE
in Finland very smooth and lively. They are, at times, unique sources of some important practi-cal information related to living in Finland. As many of these friends are researchers in biology, bioinformatics or computer science, I also had many useful technical discussions with them.
When I was in my masters at Indian Institute of Technology (IIT) Kharagpur, my friend Dr. Murthy Chavali, then a graduate student, has introduced to me the topic of DNA comput-ing, which subsequently led my interest to the broad variety of applications at the interface of computational sciences and biology. Support provided by Dr. G. P. Raja Sekhar at that time is also gratefully acknowledged.
I thank my wife, Subhadevi Attili, for her unconditional love and trust. I thank my parents and all other family members for their love, affection, and support. What I am today is the net result of my actions in the past and how they were supported by family, friends, teachers, and possibly even people I do not know. Although the names of all of those who played important roles in my life are not mentioned, they are already part of what I am today, and I am indebted to their support.
List of publications
This thesis consists of introductory part and the following publications
Article I. Peddinti V. Gopalacharyulu, Erno Lindfors, Catherine Bounsaythip, Teemu Kivioja, Laxman
Yetukuri, Jaakko Hollm´en, and Matej Oreˇsiˇc. Data integration and visualization system for
enabling conceptual biology. Bioinformatics, 21 Suppl 1:i177–i185, Jun 2005.
Article II. Peddinti V. Gopalacharyulu, Erno Lindfors, Jarkko Miettinen, Catherine Bounsaythip, and
Matej Oreˇsiˇc. An integrative approach for biological data mining and visualisation. Int. J.
Data mining and Bioinformatics, 2(1):54–77, Jan 2008.
Article III. Peddinti V. Gopalacharyulu, Erno Lindfors, Catherine Bounsaythip, and Matej Oreˇsiˇc.
Con-text dependent visualization of protein function. In Juho Rousu, Samuel Kaski, and Esko
Ukkonen, editors, Probabilistic Modeling and Machine Learning in Structural and Systems
Biology, pages 26–31, Tuusula, Finland, Jun 2006.
Article IV. Catherine Bounsaythip, Erno Lindfors, Peddinti V. Gopalacharyulu, Jaakko Hollm´en, and
Matej Oreˇsiˇc. Network-based representation of biological data for enabling context-based
mining. In Catherine Bounsaythip, Jaakko Hollm´en, Samuel Kaski, and Matej Oreˇsiˇc, editors,
Proceedings of KRBIO’05, International Symposium on Knowledge Representation in Bioin-formatics, pages 1–6, Espoo, Finland, Jun 2005. Helsinki University of Technology, Laboratory of Computer and Information Science.
Article V. Peddinti V. Gopalacharyulu, Vidya R. Velagapudi, Erno Lindfors, Eran Halperin, and Matej
Oreˇsiˇc. Dynamic network topology changes in functional modules predict responses to
oxida-tive stress in yeast. Mol. BioSyst., 5:276–287, 2009.
Roman numerals are used to refer to these articles.
Author’s contributions
The research presented in this thesis consists of two themes: data integration and context-sensitive
visualisation (Articles I–IV), and dynamic topology of integrated networks (Article V). Author’s
contributions to each of these papers have been summarised below. Contributions of other authors are mentioned when necessary.
Article Ipresents a heterogeneous data integration system for the integration and visualization of multiple types of biological interaction data and demonstrates its usage with two applications: multiple pathway retrieval and protein neighbourhood search. The author designed the system, performed data modelling, developed the schemas, obtained relevant data, developed parsers, im-plemented the database back-end and developed the semantics for the integration of heterogeneous
PUBLICATIONS
biological entities, and provided guidance to the developement of the overall system. Author wrote the first draft of the paper which was then improved with the contributions of other authors. Erno Lindfors (EL) implemented the integration of biological entities, representation of integration results using complex networks, the Sammon’s mapping algorithm, Graphical User Interface client software and wrote these parts of the manuscript.
Article IIpresents the data integration system with addition of new methods. It presents three applications: system-wide metabolic network and the study of its topological properties, exploration of properties and relationships of a specific set of proteins, and combined visualization and explo-ration of a Type 1 Diabetes gene expression data in mouse together with related pathways and ontologies. Author developed the ideas concerning integration of gene expression data to networks and performed the analyses and wrote the manuscript. EL developed the ideas for topology study and performed analyses and implemented middle-tier and user interface and wrote some parts of the manuscript. The author and EL equally contributed to this work. Jarkko Miettinen (JM) implemented projection algorithms and improved the client and middle-tier software design and code.
Article III presents the application of the data integration framework for context-dependent visualization of protein function using network representation and nonlinear projection methods based on Curvilinear Distance Analysis. The author performed the analyses and wrote the methods and results parts of the paper which was then improved by all authors under the coordination of
Matej Oreˇsiˇc (MO).
Article IVpresents the details of the networks and the distance metrics. It demonstrates with experiments how judicious use of various distance functions can allow emergence of context. The author mainly provided biological details and data, and contributed to the manuscript which was mainly written by Catherine Bounsaythip (CB) and EL.
Article Vpresents an integrative bioinformatics method called Topological Enrichment Analysis of Functional Subnetworks (TEAFS). Author developed the main ideas of the method, implemented some parts of the method, performed the analyses and wrote the manuscript. Vidya R. Velagapudi
(VRV) performedin vivometabolic profiling experiments and data analysis, and wrote the
experi-mental methods and biological details in the manuscript. Author and VRV equally contributed to this work. EL performed biological network construction, provided help with topological analysis, implemented the statistical test and contributed to the writing. Eran Halperin (EH) provided ideas for the statistical test. MO initiated and coordinated the project and contributed to the writing of the paper.
Goals of the thesis
The goals of this thesis are
• to develop integrative bioinformatics tools and methods to integrate heterogeneous biological
data
• to produce knowledge,e.g.,testable hypotheses, from these tools in an exploratory manner
• to apply these tools and methods in mining newly generated experimental data
Contributions presented in this thesis
PUBLICATIONS
• A technical framework for storage and retrieval of biological data achieved through XML and
relational databases.
• The technique of data traversals, achieved by curation of maps database, as the basis for
heterogeneous data integration.
• A platform called MegNet for enabling context-sensitive mining of heterogeneous biological
data through the usage of conceptual spaces as the framework for knowledge representation.
• A new method called Topological Enrichment Analysis of Functional Subnetworks (TEAFS)
for studying the dynamic activity of biological process modules, and its application to studying
Contents
Abstract 3 Preface 4 List of publications 6 List of abbreviations 11 1 Introduction 13 2 Biological data 16 3 Methods 223.1 MegNetplatform for biological data integration . . . 22
3.1.1 Databases . . . 23
3.1.2 Overview ofMegNet . . . 24
3.1.3 Infrastructure . . . 25
3.1.4 Databases and data curation . . . 25
3.1.5 Integration of Gene expression data . . . 28
3.1.6 Context-sensitive data mining . . . 31
3.2 Dynamic topology of integrated networks . . . 35
3.2.1 Transcriptomics . . . 35
3.2.2 Metabolomics . . . 35
3.2.3 Pathway analysis . . . 35
3.2.4 Topology of biological networks . . . 36
3.2.5 Integration of transcriptomics and interactomics data . . . 37
4 Results 39 4.1 MegNetbased data mining . . . 39
4.1.1 Integrated pathway retrieval . . . 39
4.1.2 Protein neighbourhood search . . . 40
CONTENTS
4.1.4 Integrated co-expression and interaction networks . . . 41
4.1.5 Interaction neighbourhood in experimental context . . . 41
4.2 Dynamic topology of integrated networks . . . 42
4.2.1 Oxidative stress . . . 42
4.2.2 Transcriptomic response to Oxidative stress . . . 42
4.2.3 Topological response to Oxidative stress . . . 43
5 Summary and Conclusions 45
Bibliography 47
Articles I–V
Article V is not included in the PDF version.
Please order the printed version to get the complete publication
(http://www.vtt.fi/publications/index.jsp).
List of Abbreviations
Abbreviation Expansion
A absent
API Application Programming Interface
BioGrid General Repository of Biological Interaction Datasets
BIND Biomolecular Interaction Database
CCA Curvilinear Component Analysis
CDA Curvilinear Distance Analysis
cDNA Complementary DNA
DBMS Database Management System
DIP Database of Interacting Proteins
DNA Deoxyribonucleic Acid
DOM Document Object Model
DTD Document Type Definition
EC Enzyme Commission
EMBL European Molecular Biology Laboratory, EMBL Nucleotide
se-quence database
FDR False Discovery Rate
GC Gas Chromatography
GDS GEO Data Set
GEO Gene Expression Omnibus
GI GenInfo sequence identifier
GNEA Gene Network Enrichment Analysis
GO Gene Ontology
GSEA Gene Set Enrichment Analysis
GPL GEO Platform
GSM GEO Sample
GSE GEO Series
HPLC High Performance Liquid Chromatography
JDBC Java Database Connectivity
KEGG Kyoto Encyclopedia of Genes and Genomes
KGML KEGG Markup Language
M Marginal
MINT Molecular Interaction Database
MM Mismatch
mRNA messenger RNA
ABBREVIATIONS
Abbreviation Expansion
NOD Non Obese Diabetic
P Present
PDB Protein Data Bank
PIR Protein Information Resource, PIR-international protein sequence
database
PM Perfect Match
PSI Protein Standards Initiative
PSI-MI PSI-Molecular Interaction format
RDF Resource Description Framework
RNA Ribonucleic Acid
SAGE Serial Analysis of Gene Expression
SAX Simple API for XML
SBML Systems Biology Markup Language
SOAP Simple Object Access Protocol
SOFT Simple Omnibus Format in Text
SQL Structured Query Language
TCA cycle The citric acid cycle or The tricarboxylic acid cycle
TEAFS Topological Enrichment Analysis of Functional Subnetworks
TRANSFAC Database of Transcription Factors
TRANSPATH Database of Signal Transduction Pathways
TrEMBL Translated EMBL
T1D Type 1 Diabetes
UMLS Unified Medical Language System
UniProt Universal Protein Resource
UPLC Ultra Performance Liquid Chromatography
XML eXtensible Markup Language
XPath XML Path Language
XQuery XML Query Language
XSD XML Schema Definition
Chapter 1
Introduction
Systems biology aims to study biological systems at system level (Kitano, 2002). Integrative bioin-formatics provides tools for systems biology. The necessary goal of integrative bioinbioin-formatics is to provide platforms and methods for carrying out systems biology analysis. Ge et al. (2003) noted that, “high-throughput data integration is needed in systems biology approaches”. This thesis con-tributes methods for data integration, visualisation, mining, and study of network dynamics, which are important elements of systems biology Figure 1.1.
Post genomic biology is characterized by rapid accumulation of information and thus biological research can be viewed as information science (Schena et al., 1998). Information is increasing more swiftly than humans resources such as time and cognitive processing power. This forces humans to narrow their focus in processing the information, which in turn causes diminishing awareness. As an example, the literature documenting Raynaud’s disease and fish oils were mutually isolated in the sense that the authors and readers of one literature were not aware of the other. Much later, a cure for Raynaud’s disease with dietary fish oils was found, using a literature-based approach covering both areas (Swanson, 1986). This demonstrates the power of data integration. Thus the methods for efficient retrieval and presentation of results can benefit researchers.
Cytoscape (Shannon et al., 2003; Killcoyne et al., 2009) is a general network visualization, data integration, and analysis software, which has been mainly developed with the modelling requirements of systems biology in mind. The core of Cytoscape mainly features powerful layout algorithms for
visualising networks and is quickly becoming ade factostandard for the visualisation of biological
networks, while its flexible plug-in architecture brings the real power via community-based devel-opment of useful plug-ins. However, Cytoscape does not offer data management capabilities. Bio-logical data management and integration has also attracted significant amount of research (Lacroix and Critchlow, 2003). There are three major approaches in this area: data warehousing approach, distributed or federated approach, and mediator approach. The data warehousing approach involves assembling data sources into a centralised system with a global data schema and an indexing sys-tem for integration and navigation. In the federation approach, underlying data sources remain autonomous, and the federated system maintains a common data model and makes use of schema mapping to translate heterogeneous source database schema to the target schema for integration. The mediator approach introduces a mediator layer, a collection of software components perform-ing integration, to decouple the underlyperform-ing heterogeneous distributed data sources and the client layer. Many popular and important biological data integration systems are discussed in Lacroix and Critchlow (2003). But these systems are limited to providing web based access to multiple reference databases.
CHAPTER 1. INTRODUCTION
Figure 1.1: Systems biology can be viewed as a combination of omics technologies, data integration, analysis, mining, and modelling, often involving use of these techniques iteratively over hypothesis driven systematic experimental design to gain increased understanding of the structure and dynamics of the biological systems. High throughput omics technologies provide the measurements for systems biology. Integrative bioinformatics starts with the integration of multiple data sets from one or more omics and also possibly from multiple organisms, and forms the basis for systems biology analysis. Systems biology analyses include data mining, visualisation, biological networks, and dynamic modelling. The new knowledge generated by these analyses would enable us to build quantitative models. The hypothesis generated by the analysis of these models drive the design of more experiments to gain increased understanding of the biological systems.
The availability of high-throughput data collection techniques of modern biology introduce some
new problems. First, there are many false positive findings and reproducibility is poori.e., a
bio-logical sample analysed by using a single experimental technique at different times or laboratories often lead to unidentical results (Ge et al., 2003; Ein-Dor et al., 2005; Irizarry et al., 2005; Tan et al., 2003). Meta-analyses of multiple data sets or evidences from multiple types of biological experiments may improve the statistical power of the analysis. Second, various types of biological activities or interactions within an organism and between an organism and its environment do not happen in isolation. Biological function is a net result of simultaneous activities and interactions of various types (Kanehisa and Bork, 2003; Ideker et al., 2001a,b; Ge et al., 2003; Papin and Palsson, 2004). Thus the integrated modelling of the biological systems is very important.
This thesis addresses these problems. First, it presents bioinformatics methods to visualise
biological interactions of different types in an integrated manner. Next, it presents methods to facilitate advanced context-sensitive mining of the integrated network data. Finally, it presents
CHAPTER 1. INTRODUCTION
mining of dynamic topological changes of functional modules in integrated networks in response to specific interventions. The methods presented in this thesis can be applied for prediction of gene,
gene product or metabolite functions, and to associate experimental phenotypes with genotypesi.e.,
for interpretation of transcriptomics and metabolomics data in terms of molecular level patterns or changes.
Organisation of the thesis
The research presented in this thesis consists of integrative bioinformatics methods under two themes. The first theme is that of a bioinformatics software platform which embodies methods for integration of heterogeneous biological data: a variety of interaction, annotation, and molecular measurement data (chapter 2). The methodological details of this software platform are presented in section 3.1. The platform achieves integration across different biological data types using data traversals (section 3.1.4). The resulting information forms the basis for context-sensitive data mining (section 3.1.6), which draws on the concepts from the theory of conceptual spaces. Some results of exploratory data mining using this platform are presented in section 4.1. The second theme is the study of dynamic changes of functional modules in an integrated network (section 3.2). An application of
this strategy with a study of dynamic topological response of oxidative stress in Saccharomyces
Chapter 2
Biological data
Cells consist of different types of biomolecule. Reductionist approach of molecular biology deals with studying the properties and roles of individual molecules and produced large amounts of useful knowledge. A discrete biological function, however, can not be attributed to an individual molecule, but to a complex web of interactions between a set of molecules. Therefore, describing biological systems requires explaining how they arise from interactions among components in the cell (Hartwell et al., 1999; Ge et al., 2003). Availability of complete genome sequences of several organisms (Goffeau et al., 1996; Blattner et al., 1997; Adams et al., 2000; Lander et al., 2001; Venter et al., 2001;
Waterston et al., 2002) has opened doors for development of high-throughputomics technologies.
Figure 2.1 provides an overview of some omicsexperimental techniques for measuring different
biological data types, which are elaborated in this chapter. Gene expression microarrays (Schena et al., 1995; Lockhart et al., 1996) and Serial Analysis of Gene Expression (SAGE) (Velculescu et al., 1995), which enable us to measure the abundances of thousands of gene transcripts simultaneously,
have empowered the firstomicsdiscipline known as transcriptomics. The development of proteomics,
large scale study of proteins, followed (Patterson and Aebersold, 2003). Mass spectrometry based protein purification (Rigaut et al., 1999; Aebersold and Mann, 2003) and yeast two hybrid analysis (Ito et al., 2001) have enabled investigating protein-protein interactions in high-throughput manner
(Shoemaker and Panchenko, 2007a). Theomicstechnologies have contributed to rapid accumulation
of knowledge such as gene and gene product annotations, biomolecular interactions. Simultaneously, the availability of genome sequences also enabled development of computational algorithms for se-quence analyses (Altschul et al., 1990; Thompson et al., 1994; Durbin et al., 1998), which also helped to rapidly annotate new sequence data, and predict the structure and interactions (Shoemaker and Panchenko, 2007b; Marcotte et al., 1999). Finally, text mining (Skusa et al., 2005) also helped to retrieve important molecular interaction information, and careful manual literature curation led to higher quality information as compared to high-throughput data (Reguly et al., 2006; Matys et al., 2006). In the spirit of genomic data sharing, many types of the biological data have been made accessible through world wide web.
These web-accessible databases and their associated search and mining tools are primary re-sources serving thousands of biology researchers worldwide. These tools allow researchers to effec-tively mine the databases and answer one’s biological questions (Kanehisa and Bork, 2003). The databases cover a wide range of information including literature, sequences and annotations of genes and gene products, and a variety of molecular interactions such as biochemical reactions, transcrip-tional regulatory interactions, signal transduction pathways, to name a few. This chapter intro-duces some of the commonly used databases for miroarray gene expression profiles, protein-protein
CHAPTER 2. BIOLOGICAL DATA
Figure 2.1: Various types of data in molecular biology and the experimental techniques employed for obtaining the data (by no means exhaustive). High-throughput techniques capable of measuring all or at least a large number of components (several hundreds to thousands) simultaneously are known as
omics techniques. Generally the word interactomeis used to refer to the collection of protein-protein interactions, but in this thesis we also include other types such as metabolic networks and transcriptional regulatory interactions into the interactomecategory for convenience, as we repeatedly refer to all these types of interactions.
CHAPTER 2. BIOLOGICAL DATA
interactions, metabolic interactions, transcriptional regulatory interactions, and signal transduction networks.
GenBank (Benson et al., 2000, 2010) is a sequence database that stores all known DNA sequences gathered by direct submission of sequence data from individual laboratories and from large-scale se-quencing projects. There are two other major DNA sequence databases namely EMBL nucleotide sequence database (Stoesser et al., 1999; Kulikova et al., 2007), and DDBJ (Tateno et al., 2002; Kaminuma et al., 2010), and the data among these three databases are synchronised. The Ensembl project (Hubbard et al., 2007; Flicek et al., 2010) offers an integrated source of genome sequences and annotations for a comprehensive set of chordate genomes with a particular focus on human, mouse, rat, zebrafish etc. The University of California Santa Cruz (UCSC) Genome Browser Database (Karolchik et al., 2003; Rhead et al., 2010) is a source for genome sequence and annotation data. UCSC Genome Browser, is a tool associated with the UCSC database that provides rapid visu-alization and querying of the data. The annotations provided by these genome databases include include mRNA and expressed sequence tag (EST) alignments, gene predictions, cross-species ho-mologies, highlevel maps, single nucleotide polymorphisms (SNPs) and so on. Besides these general genomic databases, there are organism specific genomic databases for model organisms. The Sac-charomyces Genome Database (SGD) (Cherry et al., 1998; Engel et al., 2010) is a database for
the molecular biology and genetics of the yeastSaccharomyces cerevisiae that provides functional
annotations, mapping and sequence information, protein domains and structure, expression data, mutant phenotypes, physical and genetic interactions and the primary literature from which these data are derived. FlyBase (Gelbart et al., 1997; Drysdale et al., 2008) is a database of genetic and
genomic data concerning fruit flies of whichDrosophila melanogasteris an extensively studied model
organism. FlyBase is populated with information from a variety of sources ranging from large-scale genome projects to the primary research literature. FlyBase provides access to information on gene models, molecular classification of gene product functions, mutant phenotypes, mutant lesions and chromosome aberrations, gene expression patterns, transgene insertions, and anatomical images. WormBase (Stein et al., 2001; Harris et al., 2010) is a central data repository for nematodes of
which Caenorhabditis elegans is an extensively studied model organism. WormBase includes
ge-nomic sequences, gene predictions and orthology assignments from a range of related nematodes
and relies on manual curation of information from the corpus ofC. elegans literature.
Transcription factors are proteins that are vital for the transcriptional regulation of gene ex-pression. A transcription factor has a DNA binding domain which can bind to a particular region in the DNA sequence of a gene, called the binding site, and helps in enhancing or inhibiting the expression of the gene (Latchman, 1997). TRANSFAC database (Wingender et al., 2000; Matys et al., 2006) primarily provides information about entities involved in the transcriptional regulation such as transcription factors, binding sites and genes among a variety of other related information. Living cells interact with their environment by exchanging a variety of signals. Signaling path-ways of the receiver cells forward the signals to the nucleus through cascades of interactions and trigger the appropriate adaptation of the genetic program. The TRANSPATH database (Schacherer et al., 2001; Krull et al., 2006) provides information about signal transduction pathways involved in the transcriptional regulation of gene expression via regulating the activity of the transcription factors.
The Universal Protein Resource (UniProt) (Bairoch et al., 2005; Apweiler et al., 2010) provides information about protein sequences and functional information. The central database in Uniprot, termed UniProt Knowledgebase, provides accurate, consistent and rich sequence and functional an-notations and consists of two sections: Prot and UniProt/TrEMBL. UniProt/Swiss-Prot consists of manually curated protein functional information, resulting from literature informa-tion extracinforma-tion and curator-evaluated computainforma-tional analysis. UniProt/TrEMBL consists of protein
CHAPTER 2. BIOLOGICAL DATA
sequences translated from EMBL gene sequences (Stoesser et al., 1999; Kulikova et al., 2007) and annotated with computational annotation tools, pending manual curation.
Database of Interacting Proteins (DIP) (Xenarios et al., 2002) is a database of manually curated protein-protein interactions. A curator enters each interaction entry into the database after manually reading the publication reporting an experimentally verified interaction. This is intended to be a comprehensive and integrated tool for browsing and efficiently extracting information about protein
interactions and interaction networks in biological processes. DIP provides access to combined
information from multiple observations and experimental techniques, from multiple organisms, as well as to networks of interacting proteins. Each interaction entry in the DIP database contains information about the protein domains and range of amino acids involved in the interaction, and the corresponding experiments. The interactors are identified by Swissprot (Apweiler et al., 2010), PIR (Barker et al., 1998), or GenBank (Benson et al., 2000) accession numbers and each interactor entry contains information about the organism, function, superfamily, cellular location and so on.
The Biomolecular Interaction Database (BIND) (Bader et al., 2003) stores pairwise interactions between biological ‘objects’ which could be protein, RNA, DNA, molecular complex, small molecule, photon (light) or gene. Moreover, it contains higher level functional structures called molecular complexes and pathways which are collections of the pairwise interactions with some additional data. The minimum amount of information required to define an interaction is a description of the interacting objects and a publication reference to PubMed (Wheeler et al., 2007). Data in BIND is primarily obtained via submissions of individual contributors across the world. However, it also incorporates interaction data imported from other databases such as PDB, and a number of large-scale cell mapping studies using yeast two hybrid, mass spectrometry, genetic interactions and phase display. SeqHound is a data integration system (Michalickova et al., 2002) that provides extensive C, C++, and Perl application programming interfaces (API) for data in BIND. SeqHound system provides also functions to link the biological objects with other biological databases in public domain.
The Molecular Interaction database (MINT) (Zanzoni et al., 2002; Ceol et al., 2010) stores information about experimentally verified molecular interactions extracted from publications from peer-reviewed journals. The main focus is on physical interactions between proteins. Genetic or com-putationally inferred interactions are not included in MINT. MINT includes an additional database called HomoMINT (Persico et al., 2005), which is a database of interactions between human pro-teins inferred from interactions between orthologous propro-teins in model organisms. A large number of MINT data comes from large scale, genome wide experiments, although curating data from low-throughput published experiments is given emphasis. Each interaction entry contains reference to Swiss-Prot/TrEMBL protein accession number (Apweiler et al., 2010) for the interactor and con-tains the experimental information and pubmed reference (Wheeler et al., 2007) for describing the experimental conditions and other properties of the interaction.
BioGrid (Stark et al., 2006; Breitkreutz et al., 2008) is a database of protein and genetic in-teractions. It is aimed to be a generic repository providing comprehensive information on
molec-ular interactions in several organisms such as Saccharomyces cerevisiae, Drosophila melanogaster,
Caenorhabditis elegans, andHomo sapiens. It currently hosts protein-protein interaction data from high-throughput experiments such as yeast two-hybrid (Y2H) method (Ito et al., 2001) and mass spectrometry analysis of purified protein complexes (Rigaut et al., 1999). Additionally, the BioGrid team also compiles interaction data by extensive manual curation of literature. Literature curated
data forSaccharomyces cerevisiae andSchizosaccharomyces pombe have already been added to
Bi-oGrid and curation efforts for other organisms are underway (Reguly et al., 2006; Breitkreutz et al., 2008).
con-CHAPTER 2. BIOLOGICAL DATA
sists of three main components: the genomic space (KEGG GENES), the chemical space (KEGG LIGAND), and network space (KEGG PATHWAY). The KEGG GENES is a collection of gene catalogues for completely or partially sequenced genomes, compiled by automatically extracting in-formation from databases such as NCBI GenBank, and RefSeq (Wheeler et al., 2007). The KEGG LIGAND is further divided into several components including COMPOUND, GLYCAN, REAC-TION, ENZYME, and so on (Goto et al., 2002). The COMPOUND database contains manually entered and computationally verified chemical structures of known metabolic compounds, and some pharmaceutical and environmental compounds. The GLYCAN database consists of carbohydrate structures, a few hundreds of which were manually entered and the rest derived from CarbBank project (Doubet et al., 1989). The REACTION database contains reaction formulae for enzymatic reactions, the reactants of which are represented in COMPOUND or GLYCAN databases. The ENZYME database contains enzyme nomenclature. Each enzyme is identified by an Enzyme Com-mission (EC) number (Webb, 1992; Tipton and Boyce, 2000), which can be linked to other public databases such as UniProt (Bairoch et al., 2005). The KEGG PATHWAY database is a collection of manually drawn diagrams, called KEGG reference pathway diagrams (maps), each of which corre-sponds to a known network of functional significance. Moreover, PATHWAY database also contains organism-specific pathways, which are automatically generated by superimposing genes in given or-ganisms. The KEGG pathways are provided in an XML based markup language called KGML. Each metabolic reaction in a KEGG metabolic pathway is linked with one entry in the REACTION database, and the enzymes in the enzymatic reactions can be linked to the databases in the genome space as well as to other public databases via EC numbers.
iND750 is a manually reconstructed genome-scale metabolic model describing Saccharomyces
cerevisiaemetabolism (Duarte et al., 2004) with 750 genes, their transcripts, proteins and reactions. Manual reconstruction process involves curating reaction lists based on information from genome
an-notations, biochemical pathway databases, biochemistry textbooks, and publications (F¨orster et al.,
2003). All reactions in iND750 model are elementally and charge balanced, and compartmentalised to eight cellular locations: extracellular space, cytosol, mitochondrion, peroxisome, nucleus, endo-plasmic reticulum, Golgi apparatus, and vacuole. Similar semi-automated manual curation has been
employed to construct the first consensus metabolic network for yeast (Herrg˚ard et al., 2008), global
human metabolic network (Duarte et al., 2007), and so on.
Gene Expression Omnibus (GEO) (Edgar et al., 2002; Barrett et al., 2005) stores a variety of high-throughput molecular abundance data of which microarray gene expression data is a major data type. The data in GEO is organized into GEO Platforms (GPL), GEO Samples (GSM), GEO Series (GSE) and GEO Data sets (GDS). A Platform describes the set of elements that can be detected and quantified in the experiment. A Sample describes a single hybridization or experimental condition. A Series is a group of related Samples that make up one single study. A Data set is an assembly of biologically meaningful Samples that are statistically comparable. Of these, GPL, GSM and GSE are direct submissions of contributors, while GDS is a curated collection.
Gene Ontology (GO) (Ashburner et al., 2000; Berardini et al., 2010) consists of three independent ontologies: Biological process, Molecular function, and Cellular component to describe the roles of genes and proteins in eucaryotes. GO is built on the premise that a large fraction of the genes
specifying core biological functions are shared by all eucaryotes. It is aimed to be a dynamic
controlled vocabulary applicable to all eucaryotes even as our knowledge of gene and protein roles in cells continuously evolves.
Although the high-throughput experimental techniques of modern molecular biology empower us to measure multiple components of a biological system simultaneously, they often produce data that is inferior in quality to low-throughput techniques. On the one hand, high-throughput techniques may produce large number of false positives, meaning that not all findings are necessarily correct. On
CHAPTER 2. BIOLOGICAL DATA
the other hand, they may also exhibit large number of false negatives or detection biases, meaning that they may miss some true phenomena, leading to the lack of coverage or comprehensiveness in the findings. von Mering et al. (2002) performed a detailed comparison of multiple high-throughput techniques as well as a computational approach commonly employed for the study of protein-protein interactions. They estimated that more than half of all high-throughput protein-protein interac-tion data are false positives. While the estimated lower-bound to the number of protein-protein interactions is 30,000, the number of interactions supported by more than one method is only ap-proximately 2,400, which demonstrates the sparing coverage of the methods employed (von Mering et al., 2002). For these reasons, manual curation of published literature has, despite the practical difficulties, received significant interest. In order to compile high-quality data, manual literature curation is expected to consider high-confidence data coming from low-throughput techniques, and perhaps also additionally supported by multiple independent studies. However, a recent study that has systematically compared the quality of a literature curated data has speculated that the quality of the literature curated yeast protein interaction data from BioGrid (Reguly et al., 2006) is at the most as good as or even inferior to high-throughput yeast two-hybrid (Y2H) data (Cusick et al., 2009). On the other hand, high-throughput techniques such as Y2H method are also improving, and it is increasingly believed that the little overlap among different high-throughput protein interaction studies is due not to the false positives, but to the false negatives (Lemmens et al., 2010). However, still the coverage of such data is quite little. For instance, while reporting a newly produced
high-quality comprehensive binary Y2H protein interaction map forSaccharomyces cerevisiae, Yu et al.
(2008) indicated that three proteome-level Y2H studies (i.e., Uetz et al. (2000); Ito et al. (2001);
Yu et al. (2008)) taken together, only account for approximately 20% of the empirically estimated
protein binary interactions inSaccharomyces cerevisiae. Y2H interaction maps have also been
gen-erated for other model organisms and humans (see references cited by Yu et al. (2008)), and their
quality and coverage are similar to those of S. cerevisiae interaction maps. Global metabolic
net-work reconstruction approaches described earlier (Duarte et al., 2004; Herrg˚ard et al., 2008; Duarte
et al., 2007) presumably produce high-quality metabolic networks but they are not complete and continuously keep growing. Comprehensive system-level data of high-quality is a key ingredient of systems biology (Kitano, 2002). Similarly, efficient computational tools to effectively handle current and future high-throughput data and turn them into knowledge are equally important.
Most of the databases described in this chapter provide easy access to web interfaces and tools for mining the data. However, these tools as well as the underlying data formats are different from each other and thus very diverse. A platform for accessing all these databases in a unified fashion as well as for performing advanced data mining of the resulting data is presented in the next chapter.
Chapter 3
Methods
3.1
MegNet
platform for biological data integration
Although high-throughput experimental techniques of molecular biology and biochemistry produce increasing amounts of data such as gene, protein, and metabolite expression, as well as interactions between them, characterising a sample’s phenotype in the context of environment or experimental condition remains a challenge. The aim of data integration is to address this challenge by providing links between a variety of these data.
By constructing a system to represent experimental phenotypes and environmental context of samples in GEO (Barrett et al., 2005) with annotations from Unified Medical Language System (UMLS) (Bodenreider, 2004), and mining the data across multiple datasets representing similar biological contexts, Butte and Kohane (2006) showed that a large set of phenome-genome and envirome-genome relations could be retrieved within a public repository of transcriptome
measure-ments (GEO). Oreˇsiˇc et al. (2004) explored integrated analysis of gene, protein and metabolite
expression profiles, attempted to interpret the results in the biological context using pathways, and emphasised the need for data traversals.
We have developed a bioinformatics platform, a consolidation of multiple heterogeneous molecular
biology databases, and a visualisation software calledMegNet for automatic integrative mining of
these data (Article I, Article II). This section explains the technical details of the platform and
MegNet. Henceforth, we use the words MegNet and data integration platform interchangeably to represent the database system and the visualisation software together.
Fundamentally MegNet system has been developed to achieve integration of heterogeneous
bio-logical data by enabling traversals across different data sources. It enables traversals across protein-protein interactions, transcriptional regulation reactions, metabolic pathways, metabolic models, signal transduction pathways, biological ontologies, and molecular profile data such as gene
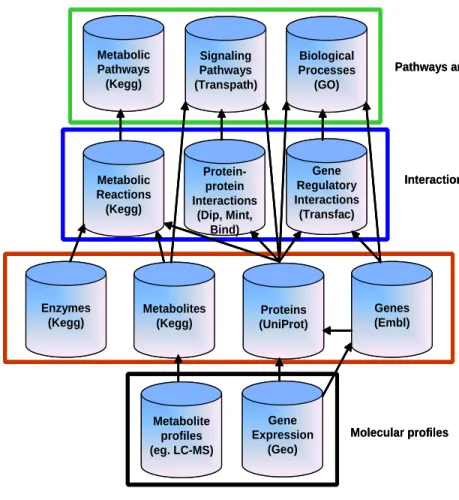
expres-sion measurements (Figure 3.1). MegNetrepresents the integrated data as networks. Furthermore,
MegNet enables context-based visualisation of the integrated networks by building a conceptual
space representation (G¨ardenfors, 2000) and making use of the dimensionality reduction techniques
(Carreira-Perpi˜nan, 1997) to visualize the similarity structure in a low-dimensional space, typically
CHAPTER 3. METHODS Metabolite profiles (eg. LC-MS) Metabolites (Kegg) Protein-protein Interactions (Dip, Mint, Bind) Gene Regulatory Interactions (Transfac) Enzymes (Kegg) Metabolic Pathways (Kegg) Proteins (UniProt) Genes (Embl) Metabolic Reactions (Kegg) Gene Expression (Geo) Signaling Pathways (Transpath) Biological Processes (GO)
Pathways and functions
Interactions General information Molecular profiles Metabolite profiles (eg. LC-MS) Metabolites (Kegg) Protein-protein Interactions (Dip, Mint, Bind) Gene Regulatory Interactions (Transfac) Enzymes (Kegg) Metabolic Pathways (Kegg) Proteins (UniProt) Genes (Embl) Metabolic Reactions (Kegg) Gene Expression (Geo) Signaling Pathways (Transpath) Biological Processes (GO)
Pathways and functions
Interactions
General information
Molecular profiles
Figure 3.1: Multiple molecular biology databases provide descriptions of biological systems at different levels of abstraction. Some common biological information, along with names of primary databases providing information in that domain are provided. Four levels of biological information are indicated by boundaries: molecular profiles (black), general information about molecules (red), interactions (blue), and biological pathways and functions (green).
3.1.1
Databases
A database is merely a collection of information that exists over a long period of time. A Database Management System, DBMS, is a software system that supports storage of large databases, provides efficient access to the data through powerful query languages, supports atomic and independent execution of concurrent transactions, and supports durability—the ability to recover from failures or errors (Garcia-Molina et al., 2002).
CHAPTER 3. METHODS SOAP over HTTP
Front
End
Middle Tier
Back
End
megNet Visualisation
client
JBoss Application Server
Web services Oracle
Transcriptomics, and metabolomics data Tamino Interaction, pathway and ontology databsases JDBC Tamino Java API Data traversals Conceptual space representation Projections for context visualisation Topology calculations ...
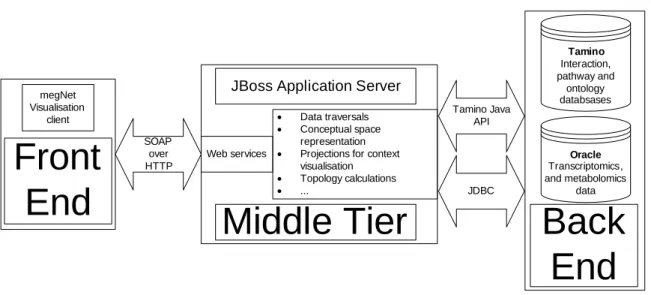
Figure 3.2: Architecture ofMegNet
Relational databases
Relational database systems are based on relational data model (Codd, 1970) which organizes data as relations or tables and provides a high level query language called Structured Query Language (SQL) for manipulating and querying the relational data (Garcia-Molina et al., 2002). Due to its
rigorous mathematical base in Relational Algebra, relational database systems became de facto
standard in DBMS technology. Oracle (http://www.oracle.com) is a famous vendor of a powerful
relational database management system. XML databases
eXtensible Markup Language (XML, http://www.w3.org/xml) is a World Wide Web Consortium
standard for document markup. XML quickly gained popularity as data exchange format due to its semantic capabilities and its supporting standards and technologies such as DTD, XMLSchema,
DOM, SAX, XPath, XQuery and so on (http://www.w3.org). Native XML as well as XML enabled
database systems have responded to increasing XML data management needs (Chaudhri et al., 2003).
Tamino XML Server (http://www.softwareag.com) is a powerful native XML data management
system. XML is a key technology in biology data management (pp. 291–319 of (Chaudhri et al., 2003)), and commonly used for data exchange based on many XML data standards (Spellman et al., 2002; Hucka et al., 2003; Hermjakob et al., 2004) and for data integration (Achard et al., 2001;
Philippi and K¨ohler, 2004).
3.1.2
Overview of
MegNet
Our data integration and visualisation system is composed of three layers as depicted in Figure 3.2. Data curated from heterogeneous biological sources including the ontologies constitutes the back-end of the system. The logic and algorithms such as those for the database traversals, network
CHAPTER 3. METHODS
construction, network projections, and integration of gene expression data constitute the middle-tier. The visualisation client communicates with the middle-tier, which in turn communicates with the back-end. Fundamentally the queries that visualisation software enables can be divided into two types: data integration queries and network projection queries. In response to a data integration query sent by the visualisation front-end, the middle-tier queries the relevant databases and performs the integration using database traversals and optionally using additional correlation calculations and sends the results in the form of an integrated network. A network projection request can be made when an integrated network is already constructed, and the system does not use the database back-end in processing these requests. The result of a network projection request is a low-dimensional representation of the network, typically a 2-d plot of network nodes, where the distances between points reflect the similarity of nodes in the network. The similarity measures will be described later in this chapter.
3.1.3
Infrastructure
A detailed description of the infrastructure of theMegNetsystem is included in sectionArchitectural
designofArticle II. However, for completeness, it is depicted in Figure 3.2 and a brief summary is given below.
Back-end: The XML data management system Tamino XML server (Software AG) is used for storing XML data. Oracle 10g database server (Oracle Inc.) is used for storing molecular profile data such as gene expression data and metabolomics data. Tamino Java API and Java Database Connectivity (JDBC) enable the communication between the middle-tier and Tamino and Oracle respectively.
Middle-tier: JBoss application server (Redhat Inc.) hosts the middle-tier, which is a set of Java Beans invokable by web services, and sends responses as web services. The communication between middle-tier and the visualisation front-end is handled via SOAP messages.
Front-end: The front-end consists of the user interface. Initially it was implemented in Java, but more recently it is implemented in C#. NET, and the Java client has been deprecated. The client communicates with middle-tier via SOAP messages.
3.1.4
Databases and data curation
Data from various public data sources were collected into our local database systems (Table 3.1, Article I, Article II). The curation of a public database involves several steps (section 2.3 of Article I). Usually every database might need some specialized steps in the curation process (Ta-ble 3.1), but the general steps are as follows:
• creating logical schemas which represent the logical structure and physical properties such as
indexing to enable efficient queries.
• development of parsers to convert the non-XML data into XML or relational formats or to
CHAPTER 3. METHODS
Table 3.1: Databases integrated into our system, along with information on some high level steps employed for integration. Appropriate schemas (XML or relational) were defined for each database. In some cases the logical schemas were readily availablee.g.,as XML schema definition (XSD) files, in which case they were customised as needed. If the XSD files were not available, they were developed manually. Tamino or Oracle specific physical schema structures including indices for efficient data retrievals were defined based on an analysis of common queries. Tamino mass data loader (or similarly Oracle SQL loader) was used for loading data.
Database Curation tasks
UniProt (Bairoch et al., 2005) Data for UniProt-SwissProt and UniProt-TrEMBL
were available in XML format. Perl parser was writ-ten to extract some subset of XML nodes and to format the data for Tamino data loader.
BIND (Bader et al., 2003) Data was available in XML format. A Java parser
was written to format the data for Tamino data
loader. In order to link the protein interactors
to UniProt entries, the GenInfo identifiers were converted to UniProt accession numbers using Se-qHound API (Michalickova et al., 2002)
DIP (Xenarios et al., 2002) Data was available in XML format. A Perl parser
was written to format the data for Tamino data loader.
MINT (Zanzoni et al., 2002) Data was available in PSI-MI XML format
(Herm-jakob et al., 2004). A Perl parser was written to format the data for Tamino data loader.
BioGrid (Stark et al., 2006) Data was available in PSI-MI XML format. A Perl
parser was written to format the data for Tamino data loader.
KEGG (Kanehisa et al., 2004) Pathway data was available in KGML, an XML
for-mat (Kanehisa et al., 2004). A Perl parser was
writ-ten for further Tamino specific formatting. Data
from KEGG LIGAND (Goto et al., 2002) database were available as formatted text files. For these data, XML schemas were developed and Perl parsers were written for constructing valid XML documents.
iND750 (Duarte et al., 2004) Data were available as flat files. Parsers based on
libSBML were developed to construct SBML repre-sentation (Hucka et al., 2003), and the data pertain-ing to compound identities were manually annotated with PubChem database identifiers (Wheeler et al., 2007).
TRANSFAC (Matys et al., 2006) Data were available as formatted text files. XML
schemas were developed and Perl parsers were writ-ten for constructing valid XML documents.
TRANSPATH (Krull et al., 2006) Data were available in XML format. Perl parsers
were written to extract some subset of XML nodes and for Tamino specific formatting.
CHAPTER 3. METHODS
GO (Ashburner et al., 2000) Data were available in an RDF-based format, and
correspondly XML schemas were readily available. A Perl script was written for Tamino specific for-matting, and for inserting an additional ”Ontology” element which describes whether a term is a “Biolog-ical Process”, “Cellular component” or a “Molecular function”. Due to the cyclic dependency of the root elements “go:go” and “rdf:RDF”, an empty schema was first defined in Tamino for “rdf:RDF” element. Then the schema for “go:go” was defined, and fi-nally, the full structure of “rdf:RDF” element was redefined.
GEO (Barrett et al., 2005) Data was available in simple line oriented text file
format called SOFT format. Perl parsers were de-veloped to extract information from the SOFT files. UMLS annotations for meta-data (Butte and Ko-hane, 2006; Bodenreider, 2004) were incorporated
intomapsdatabase.
T1DBase (Hulbert et al., 2007) The data were available as MYSQL sqldumps. A
MYSQL database was created from the sqldumps, and then the MYSQL data has been exported to OR-ACLE using Oracle Database Migration Workbench.
Database traversals using schema maps
Biological system description involves various levels of abstraction (Figure 3.1) which include
biolog-ical molecules (i.e., DNA, RNA, Proteins, Metabolites, and so on), biomolecular interactons (i.e.,
Protein-protein, Protein-DNA interactions, Transcriptional regulation steps such as a transcription factor binding to the binding site of a gene in order to control its expression, Metabolic reactions),
pathways (i.e.,cascades or sets of interactions working in concordance in order to perform
biologi-cal functions), and biologibiologi-cal processes (i.e.,biological mechanisms involving, for instance, cell-cell,
cell-tissue, organ level interactions, and so on). Some of such information can be accessed from the biological databases. Therefore, the integration of such databases allows us to automatically mine that information. In order to build a platform, which allows mining of a variety of such biological interactions, one should fundamentally achieve traversals across the databases providing biological
information (Oreˇsiˇc et al., 2004).
Resolving even simple biological relationships that contain a few biological components often requires traversing across multiple databases. The traversals can be achieved by identifying names or identifiers in different databases, which represent the same biological entity. In order to enable traversals in our data integration system, we developed a database called “maps” database, which maps names used for the same entities across multiple databases. This database is populated by
parsing information from several databases (Fig. 3B ofArticle I).
Currently this database contains mapping of proteins and gene expression experiments. The protein maps contain information of proteins indexed by Uniprot Swiss-Prot and TrEMBL identifiers (Bairoch et al., 2005). The information was primarily parsed from Uniprot Swiss-Prot and TrEMBL
CHAPTER 3. METHODS
and further populated by supplementary information parsed from BIND database (Bader et al., 2003), KEGG Pathways (Kanehisa et al., 2006), and yeast metabolism models iND750 (Duarte
et al., 2004) and YMN1 0 (Herrg˚ard et al., 2008). Maps for gene expression experiments contain
experimental meta descriptions and annotations from Unified Medical Language System (UMLS) where available (Butte and Kohane, 2006; Bodenreider, 2004).
As an example to illustrate how the data inmapsdatabase is compiled, we explain how protein
entries in this database are linked to GenInfo identifiers provided in BIND molecular interaction database (Bader et al., 2003). In protein-protein interaction databases such as MINT and DIP, protein nodes are indexed by Uniprot identifiers (Zanzoni et al., 2002; Chatr-aryamontri et al., 2007; Xenarios et al., 2000). But in BIND, interactions are indexed by GenInfo sequence identifiers (GI’s) (Bader et al., 2003). We obtained mapping between the GI’s and Uniprot identifiers in each BIND interaction using DBXREF table that provides all external references made in BIND and SeqHound Perl API (Michalickova et al., 2002) as follows. We first extracted the list of unique UniProt accession numbers from the DBXREF table. Then, for each Uniprot accession number in this list, we did the
following. We first found the corresponding primary GI usingSHoundFindAccfunction of SeqHound
Perl API. Next, we retrieved the list of GI’s that have the exact sequence as that of the primary
GI using SHoundRedundantGroup function of the API. We finally stored mapping between all the
GI’s whose taxonomy id (as found by SHoundTaxIDFromGi function of the API) matched that of
the primary GI. Finally, all GI’s associated with each UniProt accession were added as external database links for the corresponding protein entry, indexed by the UniProt accession number, in
mapsdatabase.
The data traversals use protein nodes ascentral nodesfor constructing integrated networks. More
specifically, in order to construct an integrated network consisting of various types of edges in it, those edge types are joined based on common protein nodes they share. As an example, consider traversing from a metabolic reaction to a protein-protein interaction. Such traversal could bring information about the protein-protein interaction partners, when exist, of the enzyme which catalyzes the metabolic reaction. It can be typically achieved by translating the Enzyme Classification (EC) number of the enzyme to the corresponding protein identifier (Uniprot Id), and then searching
protein-protein interaction databases for any possible interactions partners (Fig 3 of Article I).
Similarly, for linking correlation networks based on gene expression measurements with interaction networks we find out identifiers of the proteins which are expressed by the genes (indexed by EMBL sequence identifiers) under consideration.
In order to achieve data traversals, the maps database is designed to contain identifiers and
names of protein entities from multiple databases. Conversions from other types of identifiers,e.g.,
EC enzyme identifiers to Uniprot protein identifiers, and linking ofe.g., EMBL gene identifiers to
Uniprot protein identifiers are obtained frommapsdatabase.
3.1.5
Integration of Gene expression data
We achieved integration of gene expression data with interaction networks in other ways (sections 3.2, 4.2). At this point, however, we limit the discussion to network visualisation based integration approach. The visualisation approach is based on correlation networks. For selected biological sam-ples, possibly from one or more gene expression studies, the integration approach will be explained below.
Gene co-expression across multiple experimental conditions and multiple organisms indicates strong functional relationship, and hence is a powerful tool for elucidation of gene function (Stuart et al., 2003). Gene Expression Omnibus (GEO) (Edgar et al., 2002; Barrett et al., 2005) stores high-throughput gene expression data from many organisms and a huge variety of biological conditions.
CHAPTER 3. METHODS
InMegNet we allow the users to assess co-expression of genes from any choice of combinations of data sets and integrate the information with pathway and interaction data.
Gene expression data preprocessing
Many variations introduced at different stages of microarray experiments blurr the real biological variation and microarray data preprocessing tries to remove the non-biological variations from the
data (Speed, 2003; Quackenbush, 2002; Bolstad et al., 2004). Within each GEO data set, the
statistical preprocessing of the data such as background correction and normalisation are performed in a consistent fashion (Barrett et al., 2005), thereby removing the experiment-specific non-biological variations. But in order to enable simultaneous mining of gene expression data from multiple studies together, we need further normalisation so that different data sets can be combined. For example, in building ONCOMINE system to mine a large number of diverse cancer microarray data sets, Rhodes et al. (2004) applied median centering and standard deviation scaling per microarray. In an across-laboratory reproducibility study of microarrays, Irizarry et al. (2005) indicated that studying relative expression values instead of absolute expression values is a simple solution to remove the probe-specific effects in particular experiments.
In the data collected from GEO, there are two major types of gene expression microarray datasets:
single channel (i.e.,intensity based) microarrays (Lockhart et al., 1996) such as Affymetrix
oligonu-cleotide micoarray data, and dual channel (i.e., two colour) microarrays (Schena et al., 1995) such
as cDNA microarray data. Therefore, the cross-platform comparability problem reduces to applying normalisation so that both these dataset types can be analysed in an identical fashion. Since GEO
data provides log2 ratio between individual channel intensities (i.e., between case and control) for
the dual channel arrays, we similarly normalise the single channel data of case samples with control samples from the same study, where the selection of the case and control samples is upto the user. To be more precise, for each case sample, we compute the log2 ratio of the gene expression intensity measurement versus the average intensity of control samples from the same GDS dataset. After this transformation, single channel data and dual channel data can be analyzed in identical fashion as well as simultaneously. In order to allow data sets coming from different studies to be combined, we scale each microarray to unit standard deviation. Finally, when multiple data sets are queried, only the genes common to all microarray platforms are used for the analysis.
Statistical hypothesis testing
Statistical hypothesis testing (Box et al., 1969; Montgomery, 1983) is a framework that allows us to answer particular questions related to one or more populations on the basis of samples randomly drawn from those populations. A statistical hypothesis is an assumption about the probability distribution of a population. Hypothesis testing generally involves the following steps
Formulation of null hypothesis (H0): The null hypothesis is the hypothesis that the results
observed in a study (e.g., difference between treatment group and control group) are purely
by chance. The null hypothesis would be rejected if data does not provide enough evidence to
its truth; otherwise, we fail to reject it. An alternative hypothesis (Ha) is complementary to
the null hypothesis, and is effectively favoured when the null hypothesis is rejected.
Calculating a test statistic: The test statistic is a measure of the size of the “effect” relevant to our test.
Calculating the P-value: The significance probability orP-value is the probability of getting the data at least as extreme as observed if the null hypothesis were true.
CHAPTER 3. METHODS
Rejecting or failing to reject the null hypothesis: The level of significance (α) is the maxi-mum probability with which we are willing to falsely reject the null hypothesis. The null
hypothesis would be rejected if the significance probability (p-value) is less than the level of
significance (α); the evidence to reject the null hypothesis is considered inadequate otherwise.
Parametric tests make particular assumptions on the properties of the populations. When the
parametric assumptions are not satisfied,non-parametric testsmay be used instead. The advent of
powerful computers allows a new approach called apermutation test(Moore and McCabe, 2005) for
performing anon-parametric test. Apermutation testemploys resampling to estimate the significance
of the test statistic. Permutation tests are often more robust than formula based non-parametric or parametric tests. They are applicable even though the parametric assumptions are not satisfied, as long as the resampling is done in a way that is consistent with the null hypothesis (Moore and McCabe, 2005).
Multiple hypothesis testing
In the context of hypothesis testing, two types of errors are possible: Type I error or Type II error. Rejecting a true null hypothesis is called the Type I error. Failing to reject a false null hypothesis is called the Type II error. When multiple hypotheses are tested at a specified Type I error probability
(α) for each test, the chance of committing at least one Type I error increases sharply with the
number of hypotheses, and such phenomenon is referred to as multiple comparison (or testing) problem. In order to address the multiple comparison problem, one needs to define an appropriate Type I error rate and devise powerful multiple testing procedures that control this error rate (Shaffer, 1995; Dudoit et al., 2003). Controlling the false discovery rate (FDR) is one such approach, in which, the FDR—the expected proportion of falsely rejected null hypotheses (Benjamini and Hochberg, 1995)—is controlled. Procedure for controlling FDR proposed by Benjamini and Hochberg (1995)
is as follows. Sort thep-values of the test in ascending order, and denote the sorted order as
p1≤p2≤p3≤. . . pm.
Represent the correspondingm hypothesis with the same indices
H1, H2, H3, . . . , Hm.
For controlling the FDR at levelα, define
j0=max{j:pj≤
j m·α}
and reject hypothesis
Hi,∀i∈1,2,3, . . . , j0.
Other classical Type I error rates controlled in multiple comparison approaches include Per Fam-ily Error Rate (PFER)—expected number of type I errors, and FamFam-ily Wise Error Rate (FWER)— the probability of at least one type I error (Shaffer, 1995), both of which tend to impose more strict control over the Type I errors, but at the expense of larger number of Type II errors. Therefore, controlling the FDR is common choice in exploratory analysis (Dudoit et al., 2003).
Correlation
Correlation between two variablesXandY is the extent to which their values vary together