Development and Application of
Flexible Algorithms for the Protein Inference Problem
in Bottom-up Mass Spectrometry
Dissertation
der Mathematisch-Naturwissenschaftlichen Fakultät
der Eberhard Karls Universität Tübingen
zur Erlangung des Grades eines
Doktors der Naturwissenschaften
(Dr. rer. nat.)
vorgelegt von
Dipl.-Informatiker (Bioinformatik) Julian Uszkoreit
aus Hamburg
Tübingen
2016
Tag der mündlichen Qualifikation: 7. März 2017
Dekan: Prof. Dr. Wolfgang Rosenstiel
1. Berichterstatter: Prof. Dr. Oliver Kohlbacher
Abstract
Liquid chromatography coupled to mass spectrometry (LC-MS) has become the most commonly used method for proteomics in recent years. This is mainly due to its relative affordability in comparison to gel-based methods combined with its fast and straight forward usage. The possibility to identify thousands of proteins by tandem mass spectrometry (MS/MS) in a few hours let LC-MS/MS become a widely used high-throughput method in the life sciences. The current state-of-the-art mass spectrometers though makes it necessary to digest proteins into peptides: too large and too highly charged molecules cannot be measured with sufficiently high resolution in high throughput. Peptides on the other hand can be detected and identified, most often employing database search engines. This bottom-up approach comes with the drawback that identified peptides have to be re-assembled to protein sequences. This step is called protein inference and is not trivial: due to peptide ambiguities a correct solution of the inference cannot be given in most cases. A peptide that was found in the original database used for the identification, can sometimes be assigned to more than one protein. The reason for this can have multiple causes, for example homologous proteins and protein domains, isoforms or simply redundant sequences originating from multiple entries for the same protein or sequence fragment. These shared peptides lead to a set of proteins, which are built-up of the same sets or sub-sets of sequences. This problem is known as the "protein ambiguity" and without further assumptions or additional knowledge it remains uncertain, which protein of such a set was actually present in the measured sample, unless a unique peptide, which belongs to only one protein, was detected.
The work presented herein addresses open problems in protein inference. At first, the problem and its causes are addressed in detail. Additionally some of the basic algorithms for peptide identification as well as possibilities to merge their results are introduced. During this work the tool "PIA - Protein Inference Algorithms" was developed. PIA was compared to four other inference methods in an in-depth assessment. In this analysis the differences, but also the similarities of these tools and their reports were highlighted. During the development of PIA special care was taken, that no single proteins, but protein groups are reported. Furthermore, it allows a user to chose from multiple algorithms for the inference and set a multitude of different filters, as well as to merge the results of multiple search engines. The community standard
workflow environment KNIME or directly via the command line. Additionally, it provides a user friendly web interface, which can be accessed with any current browser. Besides comprehensive and easily browsable result lists, PIA offers an intuitive visualisation of the relations between the MS spectra, peptides and proteins, which are contained in a generated protein result list.
Zusammenfassung
Flüssigkeitschromatographie gekoppelt mit Massenspektrometrie (LC-MS) ist in den letzten Jahren zu der am meisten verbreiteten Methode der Proteomik geworden. Dies ist beson-ders auf die relative Kostengünstigkeit gegenüber gelbasierten Methoden, sowie der schnellen und einfachen Handhabung zurückzuführen. Die Möglichkeit, tausende Proteine innerhalb weniger Stunden mittels Tandemmassenspektrometrie (MS/MS) zu identifizieren, macht die LC-MS/MS zu einer weit verbreiteten Hochdurchsatzmethode in den Lebenswissenschaften. Der technische Stand der Massenspektrometer macht es jedoch nötig, dass Proteine zu Peptiden verdaut werden, da zu große Moleküle und solche mit zu hohem Ladungszustand nicht mit ge-nügend hoher Auflösung im Hochdurchsatzverfahren vermessen werden können. Die Peptide hingegen können detektiert und meist mittels Datenbank Suchmaschinen identifiziert werden. Dieser bottom-up Ansatz hat jedoch den Nachteil, dass die identifizierten Peptide wieder zu Proteinsequenzen zusammengesetzt werden müssen. Dieser Schritt wird als Proteininferenz bezeichnet und ist nicht trivial: aufgrund von Peptidambiguitäten kann es oftmals keine genaue Lösung der Inferenz geben. Es kann vorkommen, dass ein Peptid in der zugrundeliegenden Datenbank, welche zur Identifikation benutzt wurde, mehreren Proteinen zugewiesen wird. Dies kann mehrere Gründe haben, beispielsweise homologe Proteine und Proteindomänen, Isoformen oder einfach redundante Sequenzen (mehrere Einträge für dasselbe Protein oder Sequenzfragmente). Diese gemeinschaftlichen Peptide führen zu einer Menge von Proteinen, welche aus denselben Mengen oder Untermengen von Sequenzen aufgebaut sind. Dieses Pro-blem ist bekannt als die „Proteinambiguität“(„protein ambiguity“) und ohne weitere Annahmen oder zusätzliches Wissen kann nicht klar entschieden werden, welches Protein einer solchen Proteinmenge in der gemessenen Probe vorhanden war. Es sei denn, ein Peptid, welches nur einem Protein zugewiesen werden kann, wurde ebenfalls detektiert.
Die vorliegende Arbeit befasst sich mit dem Problem der Proteininferenz. Zunächst wird das Problem und seine Ursachen genau vorgestellt. Außerdem wird auf einige der Grundle-genden Algorithmen zur Peptididentifikation sowie Möglichkeiten um deren Ergebnisse zu vereinheitlichen eingegangen. Im Laufe dieser Arbeit wurde das Tool „PIA - Protein Inference Algorithms“ entwickelt. Dieses wird alleine und zusammen mit vier weiteren Proteininferenz-methoden in einer ausführlichen Begutachtung analysiert. In dieser Untersuchung werden
Proteingruppen als Ergebnisse liefert. Außerdem gibt es dem Benutzer die Entscheidung aus mehreren Algorithmen für die Inferenz zu wählen und eine Vielzahl an Filtern zu setzen, sowie die Ergebnisse mehrerer Suchmaschinen zu vereinen. Es beherrscht sowohl für den Import als auch den Export die Community-Standarddateiformate mzIdentML und mzTab und bietet dadurch einen einfachen Einbau in größere Proteomik-Pipelines. PIA kann sowohl in der Work-flowumgebung KNIME als auch über die Kommandozeile ausgeführt werden. Zusätzlich bietet es ein benutzerfreundliches Web-Frontend, welches über jeden aktuellen Browser aufgerufen werden kann. Neben ausführlichen und leicht inspizierbaren Ergebnislisten bietet PIA auch eine intuitive Visualisierung der Verhältnisse zwischen MS-Spektren, Peptiden und Proteinen, welche zu der Erstellung einer Ergebnislisten geführt haben.
Acknowledgements
I am very grateful to Christian Stephan and later on Martin Eisenacher for introducing me into the field of proteomics and being great work group leaders. Many thanks also to my colleagues in the bioinformatics unit of the MPC, especially Maike, Micha and Micha. Even if we always complain about everything, our job cannot be that bad. With this, I also thank Prof. Katrin Marcus and the complete Medizinisches Proteom-Center for the nice working climate. Without all your discussions, testings and support, PIA would never have existed.
Furthermore, my deepest thanks to Oliver Kohlbacher, who as my supervisor had always good ideas to promote my work. I also want to thank all my collaborators, who published articles and prepared workshops with me.
Special thanks go to Dominik, Sebastian and Jo for reading through all this, even though each had only the knowledge of a very small portion of it! And also for everything else!
I like to thank my scout group "Salomon Idler Univiertel" and all my friends around it for their support, trust and motivation through all these years. Be prepared and remember: A Scout smiles and whistles under all circumstances.
Last but not least: thanks to my parents, siblings and family! You made me very early in my life aware of my affection to natural sciences and computers and – most important – let both prosper. Finally I thank Elke for everything and dedicate the thesis to her, who is not yet born!
General Remarks
• In accordance with the standard scientific protocol, I will use the personal pronounwe to indicate the reader and the writer, or my scientific collaborators and myself.
• Some contents of this theses were published before in scientific journals, partly literally.
Parts of Chapter 5 (mainly Section 5.2) and parts of Chapter 6 were published before in the article: "PIA: An Intuitive Protein Inference Engine with a Web-Based User Interface.", Uszkoreit et al. J Proteome Res. 2015 Jul 2;14(7):2988-97.1
Other parts of Chapter 5 (mainly Section 5.3) were published before in the article: "In-depth analysis of protein inference algorithms using multiple search engines and well-defined metrics.", Audain and Uszkoreit et al. J Proteomics. 2016 Aug 4;150:170-182.2
Contents
1 Introduction 1
1.1 Motivation . . . 1
1.2 LC-MS/MS Proteomics . . . 2
1.3 The Protein Inference Problem . . . 3
1.4 Contributions of this Thesis . . . 4
2 Experimental Background 7 2.1 Sample Preparation . . . 7 2.2 Liquid Chromatography . . . 9 2.3 Ionisation Methods . . . 10 2.4 Mass Spectrometers . . . 12 3 Computational Background 19 3.1 LC-MS/MS Data Interpretation . . . 19
3.2 Estimating the Quality of Identifications . . . 24
3.3 Protein Databases . . . 28
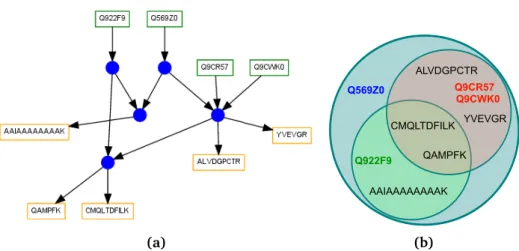
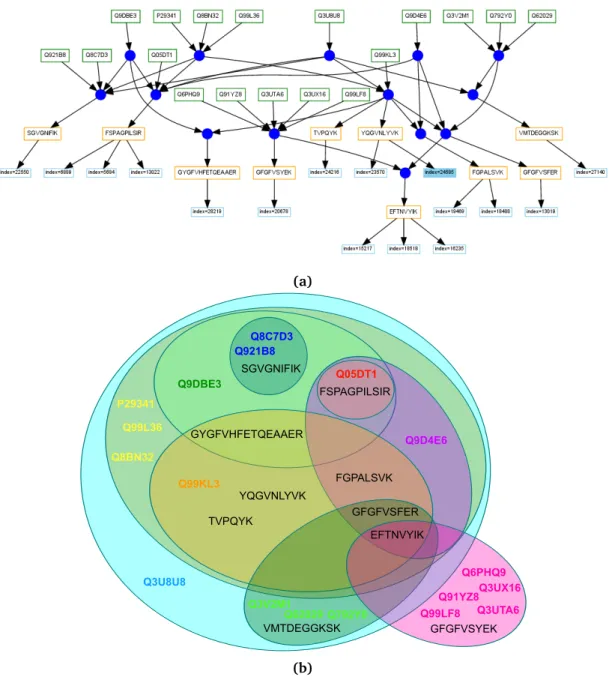
3.4 Specifications of the Terminology for Protein Ambiguity Groups, Sub-Groups and Clusters . . . 29
3.5 The Proteomics Standards Initiative of the Human Proteome Organization . . . . 33
4 Analysis of the Uniqueness of Peptides and Proteins 37 4.1 In SilicoDigestion of UniProtKB Databases . . . 38
4.2 Peptide and Protein Uniqueness in Example Datasets . . . 41
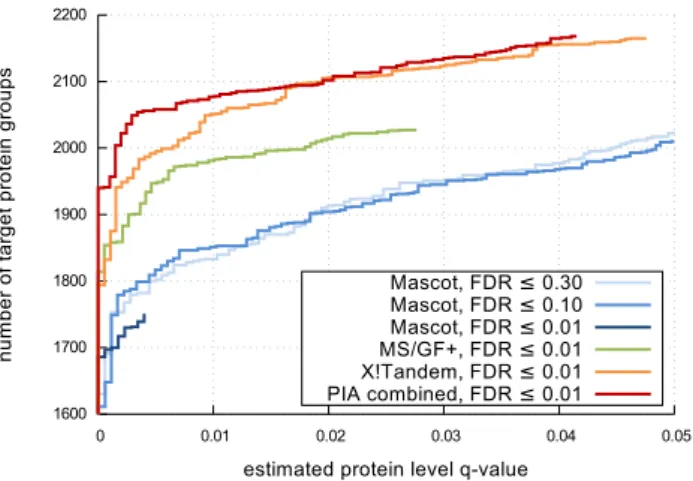
5 Assessment of Protein Inference Methods 45 5.1 Description of the Benchmark Datasets . . . 45
5.2 Assessment of PIA . . . 48
5.3 Assessment of Protein Inference Algorithms using a Workflow Framework and Well-Defined Metrics . . . 54
6 PIA - Protein Inference Algorithms 81
6.1 Design Goals . . . 81
6.2 Basic Concepts . . . 83
6.3 Frontends for PIA . . . 89
6.4 Technical Details of the Implementation . . . 97
7 Conclusion and Outlook 107
Bibliography 111 A Abbreviations 121 B Contributions 123 C List of publications 125 D Supporting Tables 129 E Supporting Figures 131 F Additional Material 137
Chapter 1
Introduction
1.1
Motivation
Since the discovery of the deoxyribonucleic acid (DNA) in the late 19thcentury and the discov-ery of its potential to encode the genetic information of all known living organisms, it shaped the history of biology during the 20thcentury. A climax was reached when Watson and Crick described the double-helix structure of DNA3 and roughly 50 years later when the Human Genome Project4published the final sequencing results of the human DNA in 2004, after more than 13 years of work. Only about four years later, the so-called Next Generation Sequencing (NGS)5 technologies were introduced. These highly parallelized methods were much more advanced than the traditional Sanger sequencing and it allows nowadays the sequencing of a single person’s genome in almost a day’s time6. All this led to the start of the "1000 Genomes Project" in 2008, aiming at the complete sequencing of at least thousand humans from different ethnic backgrounds and finding variations in the genetic code. These efforts resulted in a much more comprehensive overview of the genetic variation inside one species alone7,8.
All these studies of the genome brought many valuable new insights, but could by far not solve all biological problems. Additionally, several paradigms, which were considered to be true, had to be re-inspected. For example it was no longer possible to assume a conclusion of an organism’s complexity from the number of protein-coding genes. The publication of the human genome revealed that man has about 20,000 – 25,000 protein coding genes9, more recent estimations place the numbers at just 19,000 genes10, which is even less than the genome of the nematodeC. elegans(about 20,000)11. On the other hand, the genome alone cannot explain the complete phenotype. One of the most obvious example for this is the metamorphosis of a caterpillar into a butterfly. Both have exactly the same gene sequence, but their physiology could not be more different. Furthermore, it is known today that one gene codes for more than one protein, for example through alternative splicing12. Apart from the pure genome sequence,
it seems more important nowadays to know which genes are activated and thus translated into proteins or influence the organism in any other way, like being coding templates for miRNAs. To address challenges in these new directions, several new disciplines emerged within the life sciences. Most of them are so called "omics", which address the collective characterisation and quantification of all biological molecules of a respective "ome". An "ome", on the other hand, describes the complete set of a specific biological molecule in a species or sample. Thus, for example the genome describes the complete set of a species’ genes and "genomics" is the scientific field addressing it. Besides "transcriptomics" and "metabolomics", the field of "proteomics" was developed. The name proteome was coined 1994 by Marc Wilkins on a conference and one year later in a publication13.
1.2
LC-MS
/
MS Proteomics
Mass spectrometry allows the characterisation of molecules by their mass to charge ratio. In proteomics this is used to either detect and identify whole proteins (top-down) or, more often, peptides of digested proteins (bottom-up) in a sample. To measure a biological component with a mass spectrometer, it has to be ionised first which is for example done by electrospray ionisation. The knowledge of the mass however does not suffice to fully identify a component, as there may be several entities in a searched database with nearly the same mass14. For this reason, the ions are fragmented and the fragment spectra (MS/MS or MS2) together with their parent ion’s mass are used for identification. This is feasible, as the parent ions fragment preferentially at the peptide bond. Thus, the MS/MS spectra can either be used for identification by so-called database search engines like SEQUEST15, Mascot16or X!Tandem17, which match measured spectra against theoretical spectra calculated from protein sequence database entries, or forde novopeptide or protein identifications18,19.
The current state-of-the-art mass spectrometers still cannot nearly create complete MS/MS spectra of complete proteins in high-throughput, i.e., spectra which contain ions to explain the complete amino acid sequence. As this though is feasible for peptides, the bottom-up or also called shotgun technique20has become the method of choice for high-throughput protein identification in recent years. There the proteins of a sample of interest are enzymatically digested to peptides. For the digestion mainly enzymes which cut at specific positions within a protein and thus produce predictable peptides are used, to minimise the search space used by database search engines. The complex peptide mixture is often separated by liquid chromatog-raphy (LC)21 prior to measurement. This approach is referred to as "liquid chromatography coupled to tandem mass spectrometry", or short LC-MS/MS. It is performed, because the mass spectrometer can detect and fragment only a limited number of ions per time. Also, with this additional temporal separation due to physico-chemical features the signal inference for the measured molecules is decreased.
The Protein Inference Problem
1.3
The Protein Inference Problem
One drawback of bottom-up proteomics is, that the database search engines as well asde novo approaches identify only peptides through the calculation of peptide spectrum matches (PSMs). As researchers are more often interested in the actual proteins rather than the peptides, which are created only to obtain detectable molecules for the mass spectrometers, it is necessary to generate protein lists, which contain database accessions, from the identified PSMs. The step from PSMs to proteins is called "protein inference"22. This step is not trivial, because a significant number of tryptic peptides in a database search is not unique for one protein entry but shared by multiple entries. This holds especially true for higher organisms, due to homologous proteins and protein domains or isoforms contained in databases. These shared (sometimes also called "degenerated") peptides lead to sets of proteins, which are built up of the same set or subset of peptides. This problem is known as theprotein ambiguityand without further assumptions or knowledge it cannot be decided which of the proteins of a set are in the sample, unless a unique peptide was found. Often for each such protein ambiguity group only a representative accession number is reported in the result list and the other proteins are reported as "similar proteins" or "group members".
For a more complete result list, all these potential proteins (according to the inference algorithm) should be reported, as was already suggested by Nesvizhskii et al.22in 2005. The set of PSMs selected for the protein inference, the logic and algorithm of the inference and the selection of reported representatives vary significantly between inference algorithms. For some methods - usually the commercial ones, but also some freely available - the details of their algorithms are scarcely documented, so that results cannot be explained or it cannot be judged whether they are reasonable. Though additionally to the search engines’ inherent inference algorithms there are quite a lot of stand-alone programs for protein inference from PSMs (e.g., ProteinProphet23, Scaffold24and IDPicker25), some of them support only specific search engines and most are limited in their settings for inference parameters.
Merging the results from multiple search engines is also desirable to either increase the number of identified spectra passing an FDR threshold and thus the number of corresponding proteins, or to amplify the evidence of peptides detected in the analysed sample26. This poses a major problem, because each search engine’s algorithm generates its own value for the quality of a PSM, generally a score or probability value (throughout this thesis and in this context score always means the score or probability, if not further specified). These scores are usually not directly comparable but need the calculation of another comparable score27–29.
1.4
Contributions of this Thesis
This work addresses and discusses some challenges caused by protein ambiguity. Furthermore it introduces a tool suite, which allows to import data from virtually all available search engines, due to support of current standard formats, lets a user inspect and assess the identified PSMs and peptides, gives the user full control of the protein inference, and visualises the dependencies between PSMs, peptides and proteins.
In Chapter 2 the experimental background for a proteomics experiment is given. It is described, how the biological sample is processed and the mass spectrometrical data is created. Though this gives the basis of all proteomics studies, only a short overview of the most important aspects for the rest of this thesis can be provided. This includes a general overview of liquid chromatography, followed by two of the mainly used ionisation methods. The basic concepts of mass spectrometers are explained, as well as some of the current experimental issues.
The further processing after the data collection and the computational background is de-scribed in Chapter 3. We outline how the generated spectra are automatically interpreted by
de novo, spectral library and database search engines. Like most high-throughput methods,
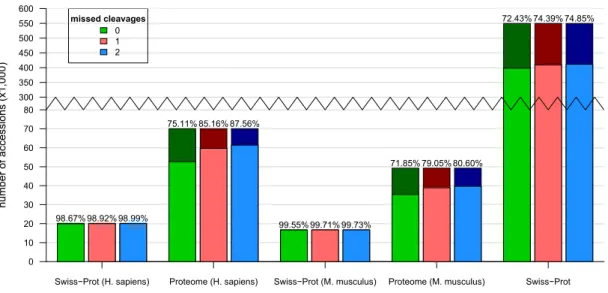
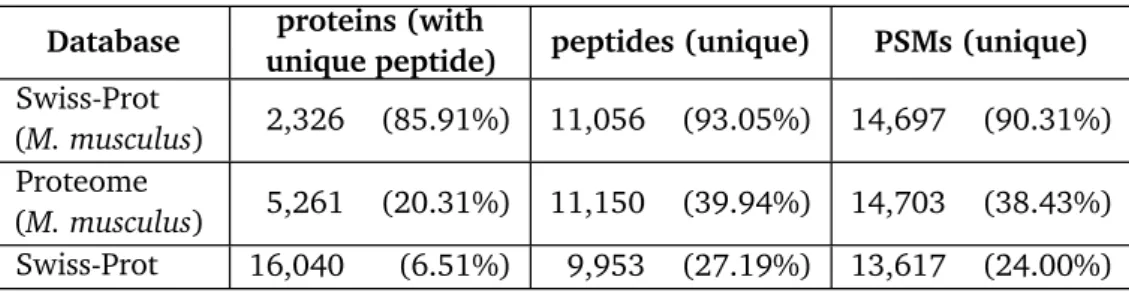
also the MS proteomics suffers from the identification of false positives. Therefore, strategies to maintain a good quality of results are given. To highlight the theoretical and practical dimensions of the peptide and protein ambiguity problem some of the most commonly used protein databases arein silicodigested and analysed. This shows that most peptides in manu-ally curated databases are unique for one protein, though in databases containing isoforms, the fraction of shared peptides is much higher. These numbers are further compared with results of two MS/MS datasets, one containing mouse and the other containing human sample data. This analysis confirms, that in real life experiments more shared peptides are identified than
thein silicodigestion would suggest.
Chapter 5 is separated into two different assessments of protein inference algorithms. In the first part, the performance of PIA alone is analysed. The implementation of PIA is tested with different settings on three datasets, a real-life mouse dataset created at the Medizinisches Proteom-Center (MPC) and two ground truth datasets, one containing yeast and the other also mouse samples. For the ground truth datasets, the proteins contained in the samples are claimed to be known. The analysis of PIA’s performance on the real-life dataset showed, that it performs well on reporting protein identifications and a merge of peptide identifications from multiple search engines can boost the results from single search engines, also on protein level. Using the yeast ground truth dataset it is possible to show, that the actually reported proteins are also contained in the sample, according to the provided reference set of accessions. Finally, an assessment of the results on the second ground truth dataset could verify, that PIA does also perform well on identifying the expected number of protein isoforms in a sample.
Contributions of this Thesis
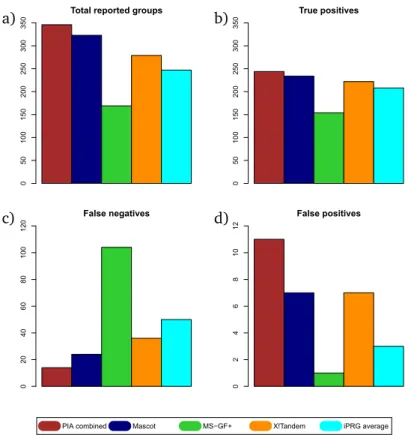
The second part of Chapter 5 compares the results of PIA to four more methods for protein inference. Therein, a workflow is created which allows unbiased interpretation of the inference results based on several well-defined metrics. This in-depth assessment gives no final conclu-sion on which method performs better, but highlights several considerations for choosing an appropriate inference method. For example, the complexity of the database used for peptide identification has great influence on some of the methods. Furthermore, some methods also report protein sub-groups, which might not be desired by the user and must be taken into account when selecting the tool used for a study. On the assessed metrics, PIA outperforms the other methods slightly, which highlights, that it creates high quality protein reports.
Furthermore, PIA comprises currently to the best of my knowledge the most comprehen-sive set of inference methods and respective settings and filters. Together with an intuitive visualisation of the complex relations between PSMs, peptides and proteins in an MS-based proteomics analysis and the report of these in easily browsable interfaces, it allows in-depth analysis of the data as well as the reliable creation of protein lists. As PIA is relatively robust when using large datasets and protein databases, it facilitates the analysis of common single species analyses as well as metaproteomics datasets.
The actual concepts and goals of the tool suite "PIA - Protein Inference Algorithms" is high-lighted in Chapter 6. This chapter describes the main principles as well as the implementation of the methods. Furthermore, all implemented algorithms are explained and the different ways to execute a PIA analysis are highlighted. Here it is important to notice, it cannot only be called by the command line and thus integrated into any pipeline, but there are also more user-friendly methods like the integration into the KNIME workflow environment as well as an intuitive web frontend.
In the last chapter, the conducted work is concluded and an outlook for further studies based on the work of this thesis is given.
Chapter 2
Experimental Background
In the last decades, many different mass spectrometers and protocols for sample preparation and analysis were established for use in proteomics. This chapter gives an overview of some widely used methods and instrument types, ordered by their chronological appearance in a general mass spectrometry based proteomics workflow. As each of these steps is a large scientific field in itself and beyond scope of this work, only the basic principles will be discussed herein. Likewise, only the relevant steps for bottom-up mass spectrometrical proteomics experiments are covered, which are necessary for the further understanding of the work in this thesis. The expression "bottom-up" or synonymously also "shotgun" proteomics derives from the identically termed genomic sequencing counterparts. Here, the whole genome, respectively chromosomes, are broken down into smaller fragments which could easily be sequenced at once. Similarly, in bottom-up proteomics, the proteins are cut or, more accurately, digested into peptides of smaller size. The reason behind this and the fact, that at the time of writing mainly bottom-up MS proteomics is performed instead of top-down, is due to the inability of currently used mass spectrometers to measure whole proteins, at least in complex samples and high-throughput. At present, the lengths of a peptide should be from 5-45 amino acids to be measurable on most machines.
2.1
Sample Preparation
At some time before starting an MS analysis, a sample must be prepared. There are internal standards which may consist of some well defined peptides or proteins, which are processed with buffers etc. and directly given to the LC-MS/MS. These kind of samples are mainly run for reasons of quality control, though. Most of the real-life proteomics experiments consist of either samples collected from patients, test animals or plants (e.g., tissues, body fluids, post-mortem samples) or harvested from cell cultures (e.g., from samples which were treated and untreated by a drug or genetically modified in any way). The exact starting point of the sample
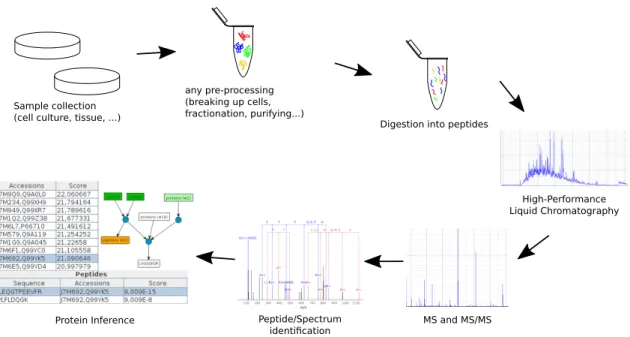
preparation varies depending on the kind of sample and optionally the applied quantification method. For experiments which use labels to differentiate between states of treatments, like the "Stable Isotope Labeling by Amino Acids in Cell Culture" (SILAC,30), the sample preparation already starts with growing the cells: they are incorporating isotopic labelled amino acids from the growth medium into their proteins. For other samples, for example label free proteomics of patient data, the sample preparation starts after collecting the samples. In Figure 2.1 an overview of a protein identification workflow is shown, which shows the collection and any pre-processing as the first two steps.
After harvesting respectively collecting the samples, the cells are usually broken up and the proteins are extracted. Either only some sub-cellular compartments, e.g. mitochondria or nuclei, or the whole contents of the cell are used for further analysis steps. Sometimes also a intra-cellular separation is performed, either on the organelles or e.g. by cleaving outer membrane proteins from the cell. Other protocols are using body fluids, extracellular matrices or a secretion for further analysis instead of the cellular contents.
For a bottom-up proteomics experiment, the samples’ proteins need to be digested into peptides. The actual digestion into peptides can either be performed in-gel31or in-solution32, both alternatives having disadvantages and advantages: While in-gel digestion is more robust against impurities, which are interfering with the digestion, the peptide extraction cannot be automated as easily. In-solution methods on the other hand are easily automated, but the proteome may be incomplete solubilized and the digestion impeded by contaminating sub-stances33. Trypsin is the mainly used enzyme for the digestion, because it tends to produce peptides of a suitable length for mass spectrometry analysis. Furthermore, due to biotechnolog-ical improvements, the nowadays commercially available trypsin is well suited for laboratory usage (overnight digestions and room temperature) and the cleavage sites are very strict and thus predictable34: it cleaves after each lysine (Lys, K) and arginine (Arg, R), if they are not followed by a proline (Pro, P) or, which happens less often, masked by a modification. Other widely used enzymes are for example chymotrypsin and Lys-C, both also with well predictable cleavage sites but leading to less suitable average peptide lengths and consequently laboratory protocols. Pepsin is used less frequently, since the cleavage sites are hard to predict and thus the data analyses typically turns out to be more error prone and cumbersome.
If the sample is too complex and the LC separation (explained in Section 2.2) not suffi-cient, another fractionation procedure like isoelectric focusing (IEF) or "Polyacrylamide gel electrophoresis" (PAGE) can be performed. After the separation of the proteins or peptides, a resulting lane can be sliced into several bands, which are processed and measured separately, in successive MS runs. This pre-fractionation furthermore increases the separation capacity and leads to possibly more and better identifications (and also quantifications) of peptides and thus proteins.
Liquid Chromatography
Sample collection
(cell culture, tissue, ...) Digestion into peptides any pre-processing (breaking up cells, fractionation, purifying...) High-Performance Liquid Chromatography MS and MS/MS Peptide/Spectrum identification Protein Inference
Figure 2.1: Simplified overview of a bottom-up mass spectrometry protein identification workflow. Usually such a workflow starts with the collection of samples and any required pre-processing steps. To perform a high-throughput protein identification with current technology, the proteins are digested into peptides and given onto a HPLC, which is coupled to a mass spectrometer. For the peptide identification, MS/MS spectra are identified either by database search engines orde novo. Based on these peptides the protein inference reports a list of proteins, which have evidence to be in the sample.
2.2
Liquid Chromatography
A mass spectrometer can only measure a limited number of compounds per time. Therefore, complex samples like full cell lysates, which contain several thousand proteins or peptides, are commonly separated by liquid chromatography (LC) before injection into the mass spec-trometer20. The mainly used LC methods are commonly abbreviated HPLC, which stands for high-performance LC, but may also stand for high-pressure LC, due to the high pressure flow through the columns.
The basic principle of the LC used for MS proteomics is the adsorption of proteins or peptides dissolved in an appropriate solvent (mobile phase) by the packing material (stationary phase) of a column21. Though various other techniques like ion-exchange or affinity chromatography are also used, the currently most widely used method is the reversed-phase chromatography (RPC or RP-HPLC). In contrast to a hydrophilic stationary phase in the normal phase, a hydrophobic stationary phase (column) is used for RPC. After loading the column with analytes of a sample, a gradient of solvent mixtures with different polarities in order to increase the separation is used as the mobile phase. The RPC and the gradient cause the less hydrophobic particles to elute before the more hydrophobic analytes. Thus, the complexity of the sample is spread over the time of the gradient and ideally each analyte elutes at a well defined retention time only.
As a rule of thumb, the slower the gradient and the longer the used column, the better is the separation. For MS-based proteomics, gradients between one and three hours and column lengths between 25–50 cm are commonly used at the time of writing.
To further enhance the performance of the separation process, different LC techniques can be coupled. For example, in order to analyse phosphorylated proteins respectively pep-tides, electrostatic repulsion-hydrophilic interaction chromatography (ERLIC,35) is frequently used to enrich phosphopeptides before using a default LC-MS approach for identification and quantification.
2.3
Ionisation Methods
Before it is possible to measure a biological molecule like a peptide or protein with a mass spectrometer, these molecules have to be ionised. For the ionisation mainly two methods are used in proteomics: "Matrix Assisted Laser Desorption/Ionisation" (MALDI) and "Electro-Spray Ionisation" (ESI).
2.3.1
Matrix-Assisted Laser Desorption
/
Ionisation
When using matrix-assisted laser desorption/ionisation (MALDI36,37) to ionise analytes, the samples have to be spotted onto a target plate and mixed with a matrix. These treated samples are pulsed by a laser in such a way, that mainly singly charged ions of the sample are generated and measured by the MS. To run a complex sample with MALDI, it is common to perform a prior separation of the sample via two-dimensional differential gel electrophoresis (2D-DIGE,38), followed by the MALDI measurement of single spots on the gel. These contain in the ideal case only one peptide respectively protein species per spot. Usually only the most interesting (e.g. differently expressed) spots of a DIGE experiment are spotted on a MALDI plate and measured in this way.
Though it is possible to further fragment the ions created by MALDI before identification (see Section 2.4.2), more often peptide mass fingerprints are identified using database search engines39. For this, the peaks of a measured spectrum are matched against the peptides of proteins in a database, assuming that each peak originates from one peptide and that multiple peptides of the same protein can be found in one spectrum. The need to separate complex samples with a time-consuming and expensive method like DIGE limits the number of identified compounds, but MALDI allows also to make spatial profiles of tissue samples. For this technique, called MALDI imaging, a whole tissue slice is fixed an a mounting plate, if desired treated with an enzyme to digest the proteins to peptides, and coated with matrix. Afterwards, the tissue will be rastered and pulsed by a laser to measure an MS spectrum for each raster point. With
Ionisation Methods
this method, identifications are hardly possible, but the samples can be classified spatially by hierarchical clustering of the spectra or other machine learning approaches.
MALDI is not a high-throughput method for protein identification, at least not any more compared with advances in other technologies. Its application for proteomics though was acknowledged with the Nobel prize for chemistry in 200240.
2.3.2
Electrospray Ionisation
Electrospray ionisation (ESI) is, at the time of writing, the most widely used method when performing MS-based proteomics experiment. When using this technique, the capillary of an LC is coupled to an ESI source. In this source, a high voltage electrostatic field is generated between the outlet of the solvent (usually referred to as the needle) and the cathode, which leads through an orifice into the mass spectrometer. The applied flow of the LC lets the solvent emerge from the needle’s tip in a stream of droplets. Simultaneously, the solvent’s surface gets charged by the applied electric field21. These charged droplets are attracted by the electrode and shrink in size while travelling through the field, due to the evaporation of the solvent. Therefore, the droplets get higher charged respectively to their size, until the Rayleigh limit41 is reached: the droplets explode, finally creating a stream of ionised single molecules, in the case of proteomics protein ions, respectively peptide ions, which are transferred into the mass spectrometer for further analysis, as outlined in Figure 2.2.
+
-solvent containing peptides mass s pectr ometerFigure 2.2:Schematic overview of an electrospray ionisation (ESI) ion source. Under high voltage, charged droplets containing the solved analytes fly through an electrostatic field. While travelling to the cathode, the droplets shrink due to evaporation of the solvent and become higher charged respectively to their size. When the charge-to-volume ratio reaches a certain limit, the droplets explode and finally ionised single molecules are generated which are transferred into the mass spectrometer.
2.4
Mass Spectrometers
In the mass spectrometer, the signal intensity of a certain mass-to-charge (m/z) ratio associated with a specific molecule is recorded. Currently, there are several types of mass spectrometers in use, which originate from different methods to differentiate between ions. In time-of-flight (TOF) machines, the time needed by an ion to travel through an electric field of specific strength and length is used to derive its m/z. A quadrupole mass analyser (mostly abbreviated as quadrupole) consists of four parallel metal rods. If specific alternating voltage fields are applied to these rods, only ions of a specific m/z ratio can pass the quadrupole, while other ions have an unstable trajectory and are thus filtered out42. The quadrupole is used in combination or as a filter with other types of MS. If used as sole technique, most often a triple-quadrupole (QQQ) is used. A quadrupole can also act as an ion trap. There are different kinds of ion traps, but all are used to hold ions (of a specified m/z) until a sufficient amount of them coming from the ion source is stored to be detected43. After the ions are separated by their m/z ratios, their intensity is subsequently measured by a detector.
Another, currently very popular kind of ion trap is the Orbitrap, which is often coupled to a linear trap quatrupole (LTQ) as marketed by Thermo Fisher Scientific. An Orbitrap consists of a cylindrical outer and an axial inner electrode44. Injected ions orbit around the inner electrode and ions of same m/z ratios are packed into bands. These perform harmonic oscillations depending on their m/z ratios. The ions are detected all at once by their induced current on the outer electrode and a Fourier transformation is used to extract a mass spectrum.
Considerable advancements have been made concerning the m/z and temporal resolutions of mass spectrometers, which now can create some tens of spectra per second and Orbitraps can differentiate between ions with a resolution of up to 240,00045,46at 200 m/z. The resolution or "resolving power"Rof a mass spectrometer is defined by its ability to distinguish between two neighbouring peaks. The formula for the resolution is
R= M
∆M,
whereM is the mass of a peak and∆M is nowadays most often thefull width at half maximum (FWHM) of a peak47. This can be surpassed by "Fourier transform ion cyclotron resonance" (FTICR) mass spectrometers, which have resolutions of up to 1,000,000, but are much more expensive and not applicable for high-throughput analyses.
2.4.1
Liquid Chromatography coupled to Mass Spectrometry
As explained before, the current method of choice for MS based proteomics is the (high-performance) liquid chromatography coupled to mass spectrometry (LC-MS). Here, the pep-tides are passed to a mass spectrometer after separation by LC in such a way, that molecules
Mass Spectrometers
are eluted and measured on the MS at a specific retention time. This separation is usually performed directly before the measurement and thus called online, whereas techniques, where the separation is performed and the fractions are collected for later measurement are called off-line separation. The LC improves the resolution by separating different analytes in the sample. Furthermore, it is necessary to allow the identification of peptides using tandem mass spectrometry.
To visualise successively recorded MS spectra, retention time (RT) m/z maps are generated (Figure 2.3). These maps are the basis for quantitative methods working with ion or ion trace quantification, like many label-free techniques48. As the quantification using MS is a very broad field itself, it will not be discussed in further detail in this work.
Figure 2.3: Detail of a RT-m/z map created by the OpenMS module TOPPView. The intensity of detected ions is colour-coded, going from white/light-grey (least intense) over yellow to violet (most intense). In the white "gaps" between the MS scans, MS/MS spectra were recorded: black circles indicate the triggering parent m/z and its RT, the end of the adjacent lines the actual RT of the recorded MS/MS. In the depicted map ion traces of several features (presumably peptides) are visible, one larger and more intense in the centre. On a higher zoom levels, the m/z of individual isotope levels would be visible. These features can be used for quantification approaches using mass spectrometry.
2.4.2
Tandem MS
The identification of peptides based on a mass spectrum alone poses big challenges when using database approaches. The main reason is, that many peptides with identical masses within an instrument-specific tolerance window exist in current protein databases. In order to solve ambiguities on MS level one identifications, tandem MS (MS/MS or MS2) spectra are created. It is assumed that ions of a certain m/z ratio at a single retention time belong to a specific peptide in the sample. In a data dependent acquisition (DDA), the ions with the highest intensity after a MS level one scan over the complete m/z range are subsequently
fragmented (compare Figure 2.3). For this, the selected parent ions of the specified m/z ratio and inside a certain tolerance window are collected and some kind of energy is applied to break the peptide ions. For most experiments considered in this thesis, the fragmentation used is collision induced dissociation (CID): the peptide ions are accelerated by an electrical potential and collided with a collision gas, which induces a fragmentation49. It is important to know, that the backbone of peptides breaks for specific fragmentation methods preferentially on well defined positions50(e.g. mainly b and y ions are created by CID), which will be explained in the next section. Thus, it is feasible to match these peptide fragment spectra to the original peptide sequences, as described in Section 3.1.
Structure of Peptides
Proteins and peptides are biochemically amino acids concatenated by peptide bonds. The peptide bond is a special chemical bond, which connects theα-carboxyl group of one amino acid with theα-amino group under the loss of a water molecule51. Therefore, the formation of a peptide bond is a condensation. Most important is the fact, that an arbitrary number of amino acids can be concatenated by peptide bonds. These polypeptides contain all a backbone with repetitive elements and different side-chains for the respective amino acids, see Figure 2.4. The end of the peptide backbone, which has a free amino group, is called the N-terminus, the other end, with a free carboxyl group, is the the C-terminus. The peptide or protein sequence is usually read from the C- to the N-terminus. All the proteins of the known living organisms are composed of 22 proteinogenic amino acids in varying sequences. Besides the peptide bonds, there can be further static bonds between the side-chains of amino acids, like disulfide bridges, as well as transient connections like hydrogen bonds, which form secondary and tertiary structure elements. These though will be no further discussed in this work.
H2N C R1 H C O N H C R2 H C O N H C R3 H C O OH
N-terminal amino acid C-terminal amino acid peptide bond
?
peptide bond
?
Figure 2.4:A peptide consisting of three amino acids. The sketch shows three amino acids connected by peptide bonds between the carboxyl and amino groups of two neighbouring amino acids. The side-chains are abbreviated with R1, R2and R3respectively. Each peptide consists of this basic structure with a variable number of inner amino acids.
Mass Spectrometers
Peptide Fragmentation and Creation of Ion Series
In MS-based proteomics, the fact that peptides break preferentially at the backbone is used to create tandem MS spectra, which can be matched to amino acid sequences. Furthermore, the preferred fragmentation site depends on how the energy to induce it was applied. When applying collision induced dissociation (CID), the peptides tend to break between the C and N atom of a peptide bond and thus creating mainly b- and y-ions52. Fragments produced by electron transfer dissociation (ETD) on the other hand produce mainly c- and z-type ions53. The nomenclature of the produced ions depends on the position of the backbone break: a, b and c ions contain the N-terminus of a peptide, while the corresponding x, y and z ions contain the C-terminus. An index at the ion, like b2, indicates the number of contained amino acid side chains in the ion, see also Figure 2.5.
H2N C R1 H C O N H C R2 H C O N H C R3 H C O OH a1 x2 b1 y2 c1 z2 a2 x1 b2 y1 c2 z1
Figure 2.5: Nomenclature of ion series. This sketch highlights the breaking positions for the creation of ions and their nomenclature on a small peptide, in green the positions between the first and second amino acid, in red between the second and third. The a, b and c ions contain the free amino group of a peptide, while the x, y and z ions contain the C-terminus. The indices indicate the number of amino acid side chains in the respective fragment.
Whether an ion is detected or formed at all depends on many factors, like the type of applied fragmentation energy, but also the amino acid sequence and possible modifications. Also, only charged ions can be detected at all by the mass spectrometer, therefore the created fragment has to contain at least one charge and thus form an ion. All measured fragment ions of a precursor form anion seriesorion ladder. For the identification of the original peptide, it is important to create and measure a complete as possible ion series of the analytes, as explained later.
Annotation of Tandem Mass Spectra
With the knowledge of the preferred fragmentation site, it is possible to match a tandem MS spectrum to an amino acid sequence. For this, it is assumed that the most intense peaks of a spectrum correspond to the ion types created by breaking of the peptide at these fragmentation sites. Using this, the weight differences for each amino acid in a fragment and preferably some
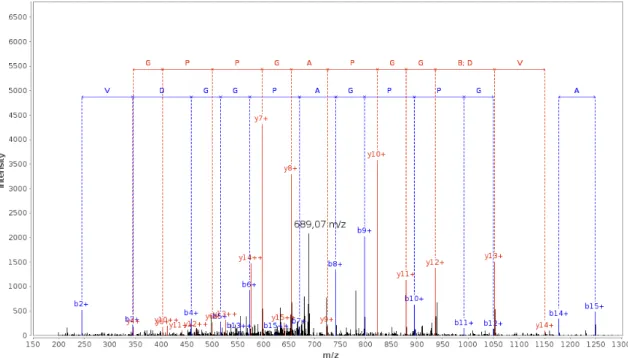
more information about a tandem MS spectrum, like the precursor mass and charge, the amino acid sequence of a the originally analysed peptide can be recovered as explained in Section 3.1. After (or for de novo methods also during) matching a spectrum to an amino acid sequence, the spectrum can be annotated by the sequence as shown in Figure 2.6. Here the matching of the b- and y-ion series for the peptide DEVDGGPAGPPGGAAK on a spectrum is depicted. In Table 2.1 the masses of the respective ion series and the annotated fragments are shown. In the example it can be seen that the singly charged y-ion series can be annotated completely from y4 up to y14, and the b ions from b2 to b12. With the usage of doubly charged ions it is possible to annotate the complete peptide sequence in this case. Annotations like this make a manual inspection of interesting results in a high-throughput identification possible.
Figure 2.6: Annotated MS/MS spectrum for the peptide DEVDGGPAGPPGGAAK. The figure shows an annotated MS/MS spectrum for the peptide with the sequence DEVDG-GPAGPPGGAAK from a 2+charged precursor ion. In red the ion series for the y-ions is annotated and in blue for the b-ions. The distances between two peaks are characteristic for specific amino acids. Both series are almost complete (compare Table 2.1) and most high abundant peaks are explained by the sequence, which lead to a relatively high Mascot Ion Score in this case (68.86). But there are also some non-annotated peaks with high intensity, for example around 689.07 m/z. This specific fragment could be a neutral loss of water (688.83 m/z) or ammonium (689.32 m/z), which both are in the tolerance range for a spectrum of the used LTQ Orbitrap Elite (0.4 Da). As in almost all spectra, there are also several low abundant peaks, of which some are belonging to contaminants or also noise. The annotated spectrum was generated with the PRIDE Inspector 2.5.
Mass Spectrometers
Table 2.1: The ion series for y- and b-ions of the 2+charged peptide DEVDGGPAGPPG-GAAK identified by Mascot. This table shows the m/z values for all possible y- and b-ions of the given sequence. The highlighted masses correspond to the annotated peaks in Figure 2.6. These theoretical values are often used by database search engines to match a spectrum to a peptide, but can also be generated byde novosequencing strategies.
y ion series
seq b ion series
pos y y++ b b++ pos 15 1279.628 640.318 D 14 1150.586 575.797 E 116.035 58.521 1 13 1051.517 526.263 V 245.077 123.043 2 12 936.490 468.749 D 344.146 172.577 3 11 879.469 440.238 G 459.173 230.090 4 10 822.447 411.728 G 516.194 258.601 5 9 725.395 363.201 P 573.216 287.112 6 8 654.357 327.683 A 670.268 335.638 7 7 597.336 299.172 G 741.305 371.157 8 6 500.283 250.646 P 798.327 399.667 9 5 403.230 202.119 P 895.380 448.194 10 4 346.209 173.608 G 992.432 496.720 11 3 289.188 145.098 G 1049.454 525.231 12 2 218.150 109.579 A 1106.475 553.742 13 1 147.113 74.061 A 1177.513 589.260 14 K 1248.550 624.770 15
Chapter 3
Computational Background
After the measurement of a biological sample by a mass spectrometer, the data needs to be interpreted. A contemporary MS run generates tens of thousands of spectra to be analysed and interpreted, which obviously cannot be done by hand. This chapter gives an overview of the computational background required for analyses of data obtained from bottom-up MS proteomics experiments. First, the interpretation and identification of LC-MS/MS data is explained in Section 3.1, which in this work is confined to the peptide-spectrum matching. After briefly discussing the concepts of several widely used search engines, some common protein databases are explained. In Section 3.2 approaches to estimate and maintain the quality of peptide identifications are highlighted and in Section 4 an examination of some protein databases regarding shared peptides is given. This directly leads to the necessity of defining some terms to model the characteristics and relations of inferred proteins, which is discussed in Section 3.4. The Human Proteome Organization (HUPO) and the efforts of its Proteomics Standards Initiative (PSI) for computational mass spectrometry are finally described in Section 3.5. The definition of standards is important to let bioinformaticians and developers focus on the tasks of analysing data or creating tools and not how to extract information from vendor data.
3.1
LC-MS
/
MS Data Interpretation
After the measurement in an mass spectrometer, a scientist is provided with the spectral data of the samples. In the currently most widely used MS based proteomics method, the bottom-up or shotgun approach, the actual proteins were digested into peptides, as described in the prior chapter. Thus, in theory the data of any MS/MS spectrum contains only the fragment ions of a single peptide ion. As the induced breakage of the peptide ions is well defined, it is possible to identify the sample peptide from an MS/MS spectrum. In the early years of MS proteomics, the spectra were only few per run and could be inspected and annotated "by hand" by the scientists.
In a modern high-throughput setting, where usually some ten-thousand MS/MS spectra are generated in each run, this is no longer possible. To overcome this, there are currently three computational strategies for data analysis:de novosequencing, database searching and spectral library searching. An implementation of any of these techniques in proteomics is called a "search engine" (SE), sometimes more precisely a "peptide search engine" or (less precisely) "protein search engine", which obviously is not to be confused by web search engines. A SE usually calculates a SE specific probability or score value for a peptide spectrum match (PSM), i.e. a value for how well a peptide matches the given spectrum. As it is tedious to always exactly differentiate between scores and probabilities, the more commonly used term "score" is used throughout this work as a designator for both, unless stated otherwise.
3.1.1
Peptide Search Engines
In ade novosequence analysis19, the software does the same as a scientist would do by hand: by inspecting the peaks of a MS/MS spectrum for amino acid specific distances, respectively their ion series (for example mainly b- and y-ions for CID spectra), the original peptide sequence can be recovered. The more complete an ion series can be restored, the better the spectrum might be scored. As this most naive approach is rather time consuming, faster strategies were implemented recently18. All thesede novoapproaches obviously lack the link from peptides to proteins. A mapping of the identified peptides to a protein database can be performed afterwards to recover this knowledge. The mapping should probably be error tolerant, to allow for example amino acid mutations, which hinder a database search approach. For unsequenced species, i.e. species which genome is unknown and therefore also no protein database is available,de novoapproaches are still widely used.
For sequenced species,database searchesare the current standard for peptide identifica-tions in MS-based proteomics. Therefore it will be discussed in more detail in the following section.
Spectral library searchesbuild onde novoand/or database searches. In these approaches, the spectra of well matching PSMs from prior searches are used and matched against newly measured spectra. These approaches have the advantage of circumventing any theoretically generated spectra. Furthermore, for the quality of the match also the intensity of the ions can be used. The identification of peptides, which were not at least once identified before, is impos-sible, though. Also, the spectral libraries are dependent on the generating mass spectrometer, and partially also on the used setup. For samples measured by the SWATH54method, adjusted implementations of spectral library identifications are currently the most promising attempt. This is due to the fact, that SWATH fragment spectra often contain intensity peaks of multiple peptides. The identification of chimeric spectra though is a big problem for most database search engines.
LC-MS/MS Data Interpretation
3.1.2
Database Search Engines
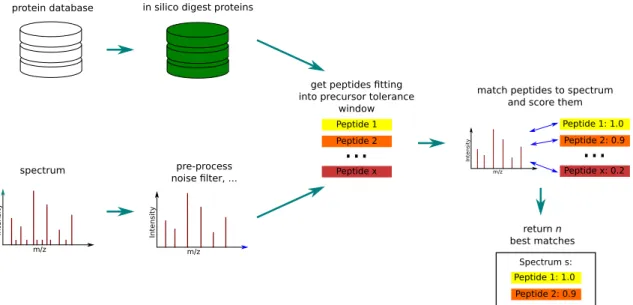
The idea behind protein database searches in MS-based proteomics is to start with a protein database, which contains entries for the proteins of the analysed sample, and to match the measured spectra against theoretical in silico spectra or spectrum models, generated from peptides. To createin silicopeptides from the databases’ proteins, mostly regular expressions describing the cleavage sites of enzymes are used. During the creation also missed cleavages are allowed, which occur regularly in real world samples. As the mass of a measured precursor ion is known, the number of peptides from the database, against which a measured spectrum has to be matched can be greatly reduced. The theoretical MS/MS spectra or spectrum models are created from thein silicopeptides taking into account the preferred breaking of bonds in the peptide backbone during the MS/MS fragmentation. Depending on the algorithm, either arbi-trary scores or e-values are returned to measure the quality of a peptide match for a spectrum. Most algorithms return more than one of these as quality measures. Eventually, a spectrum can only be identified correctly, if its original peptide is present in the database. Therefore, the choice of the underlying sequence database is one of the biggest issues for all database searches. During the last two decades a plethora of different methods and implementations for database searches emerged. Some of the search engines, which are most common and were also used in other parts of this work, are summarised in the paragraphs after the following issues.
match peptides to spectrum and score them
return n best matches spectrum m/z Intens ity pre-process noise filter, ... m/z Intens ity
protein database in silico digest proteins
get peptides fitting into precursor tolerance
window Peptide 1 Peptide 2 Peptide x
...
Peptide 1: 1.0 Peptide 2: 0.9 Peptide x: 0.2...
m/z Intens ity Peptide 1: 1.0 Peptide 2: 0.9 Spectrum s:Figure 3.1: Schematic overview of a protein database search. The proteins in a database arein silicodigested using the specified cleavage sites. Each spectrum is optionally pre-processed (e.g. using a noise filter) and all peptides fitting into the specific precursor window are selected from the database. These peptides are matched against the spectrum and scores are calculated. Finally, either all possible or only a selected number of the best matches are reported together with the scores.
Common Issues of Peptide Search Engines
A parameter, that greatly influences the outcome of a database search, is the choice of the allowed modifications and number of missed cleavage sites. Static modifications, which usually originate from the sample preparation like the common carbamidomethylation of cystein, do not increase the search space, but are rather a mass shift for the affected amino acids. Any variable modification, though, increases the search space and thus usually the runtime and a search with and without the modification may lead to significantly different results. Some of these modifications are very common, like the oxidation of methionine, which is used as a default setting in most searches. While the modifications are used to more accurately explain MS/MS spectra, the usage of inaccurately set variable modifications may lead to an increase in false positives. Some search engines (e.g., Mascot and X!Tandem) give the opportunity to perform a "second round" or refinement search to restrict the increased runtime. With this approach, the spectra are matched in a first round with only some modifications and in a second step, more modifications are allowed, but only matching against peptides belonging to proteins, which were already identified by some peptides in the first round. Some of the above mentioned search engines also have a more elaborate scoring scheme to handle modifications, which will not be further explained in this work.
One big issue in almost all high-throughput methods is the estimation of false positives. The scores and probabilities, which are calculated by the SEs, may give a hint, whether a specific match is good or bad. But with most implementations it is possible to match any sequence against any spectrum, yielding presumably a relatively bad score. Some approaches to overcome this problem are given in Section 3.2. Furthermore, the SEs report, which peptide of a given set of peptides best matches a given spectrum and score this. While the peptide scores are thus comparable for matches of a specific spectrum, the scores are not per se comparable between different spectra55. This bias can be adjusted by calibrating the scores, though this is not a wide spread method yet.
SEQUEST
SEQUEST15was one of the first protein database search algorithm for high-throughput mass spectrometry. Several consecutive calculations of different scoring types are performed. The first score, theSp, takes into account the theoretical fragments, the actually measured ions matching these, the continuity of matched ion series (which series, e.g. b- and y-ions, must be given) and also the presence of immonium ions for several amino acids of the matched sequence. Based on this score, the top ranked peptide matches for a spectrum (500 matches in the original implementation) are further analysed performing a cross-correlation. For this, the theoretical and the measured spectra are aligned and shifted along the m/z axis, computing the correlation for each shift. For a good match of a peptide to a spectrum, the correlation
LC-MS/MS Data Interpretation
should be significantly better at one shift position than on all other. This should be at a zero-shift for a well calibrated mass spectrometer. This analysis is reflected in the X C or r score, which is in this and most other works used as the main score of SEQUEST. Additionally the difference to the next best match of the same spectrum is reported as∆Cn, primarily to distinguish correct matches from false positives. The original implementation is rather slow, when compared to more recent algorithms. Nevertheless, SEQUEST is still widely used, though mainly using faster, parallelised implementations now. For a long time, the original algorithms were patented and distributed exclusively by Thermo Finnigan. Meanwhile several open source implementations exist, most of them further decreasing the necessary runtime. Among the more recent implementations are for example Tide56and Comet57.
Mascot
One very widely used commercial software is Mascot16, developed by Matrix Science, which is based on MOWSE58and handles besides MS/MS ion searches also peptide mass fingerprints. Though the actual used algorithm is not explained in detail and its implementation is not open source, some of the basics are known. Mascot’s scoring algorithm is probability based, i.e. it re-ports the probability that a peptide matches randomly in the given database. This approach has benefits, like an easily interpretable score, but also a dependency on the underlying database content as drawback. For the actual scoring, the most intense peaks, which lead to the lowest randomly matching probability score on the given ion series, are used. The capability to run Mascot on a server environment, using multiple nodes, makes it a good choice if short runtimes for many spectra are required.
X!Tandem
X!Tandem, which was originally called TANDEM17and released in 2003, claims in its origi-nal publication to be the first non-propriety and open-source implementation of a database search engine. The scoring system described in59calculates in a first step the dot-product of a measured MS/MS spectrum and the theoretical spectra of the database’s peptides, which fall in a specified precursor mass tolerance. The dot-products are further refined to the so called HyperScore, multiplying it with the faculties of the numbers of matching b-, y- and possibly other ion series which were selected for scoring. The scores are assumed to be distributed under an extreme value (or Gumbel) distribution. The logarithmic values of the counts can be interpreted as results of a survival function and can thus be seen as e-values. An E-value (or e-value for expectation value) is a score, that describes for the experiment how many ran-dom hits in the database are expected to have the same or a better score. Logarithmic counts plotted against the original score allow a linear interpolation for the high scoring portion of the plot. Thus, the e-value of the peptide with the best HyperScore is calculated and reported.
X!Tandem is a very fast and commonly used search engine, which gets regular updates and supports community standard file formats for import and export.
OMSSA
OMSSA60stands for Open Mass Spectrometry Search Algorithm and is another open source search engine, developed by the NCBI and released only shortly after X!Tandem. The first step of the search algorithm of OMSSA is a noise filter, filtering out the low intensity peaks and allowing for charge 1+spectra only one peak in a 27 Da window, for higher charged peaks two peaks in a 14 Da window. These values are chosen, as they are smaller than the residue mass of the smallest amino acid, which is glycine with an immonium ion mass of 30 MW. These two peaks are allowed, to allow peaks of two different ion series in one bin. These filtered peaks are than matched against the theoretical spectra of peptides within the precursor mass tolerance. The base score for OMSSA is the number of matching peaks for a PSM. It is assumed, that the distribution of these scores for all matched peptides follows a Poisson distribution. This assumption is finally used to calculate an e-value for each PSM. Though OMSSA was, and to a certain degree still is, used in many workflows, it is no longer maintained and thus its usage will probably slowly cease.
MS-GF+
A more recent search engine, which gained much popularity during the last years is MS-GF+61. A unique feature of this algorithm is the usage of the "generating function approach"62,63, which is not used in any other database search algorithm. In this approach, not only all peptides that fall within the mass tolerance in the database are scored against a respective spectrum, but all possible amino acid sequences. With this the generating function estimates an e-value given the best score for a spectrum obtainable by the peptides in the database and the best score for all possible peptides falling into the respective mass window. With this approach it is claimed that no further estimation of false positives is necessary, as all possible peptides are tested for each spectrum. MS-GF+fully integrates community standard formats and is open source, programmed in Java, which makes it very portable. The runtime and memory imprint of MS-GF+is, compared to other search engines, relatively high, but the developers claim in its publication, that it is much more sensitive than other search engines, i.e. it reports more high quality PSMs than others, and is readily available for all types of MS/MS experiments.
3.2
Estimating the Quality of Identifications
As with all high-throughput technologies, mass spectrometry suffers from the identification of false positives due to multiple testing: every single feature (in this case PSMs) may be
Estimating the Quality of Identifications
identified with a relatively low error probability. But the fact, that there are ten-thousands of these features makes the probability that none is a false positive small. The score of most search engines describes in some way the probability of a PSM to be a random hit, as described above. But most of these estimates are dependent on the sample, the instrument and/or the database. Additionally, the distribution of the scores is not known. To overcome this problem, one of the most widely used strategy in MS proteomics is the target-decoy-approach (TDA)64,65. This approach allows the estimation of a false discovery rate (FDR)66and thus controlling the allowed number of false positives in a list of reported identifications.
The original idea behind the TDA is, that the search engines are presented with sequences, which are not part of the original (target) database, but are decoys, which when matched represent false identifications. This approach is based on the assumption that a search engine may match a target sequence with the same likelihood as a decoy. For this, it is necessary that roughly the same number of target and decoy peptide sequences fall into the precursor tolerance for any given spectrum. This was shown to be true in the original manuscript64, but with increased accuracy of modern MS instruments tends to hold only for large enough databases, more accurately large enough decoy parts of databases.
3.2.1
Creation of Decoy Databases
For the creation of decoy databases several tools exist, for example the DecoyDatabase utility in OpenMS or the DecoyDatabaseBuilder67. Three conceptually different strategies to create decoys exist: the creation of random protein sequences, the reversing and the shuffling of existing proteins. The creation of totally random protein sequences is the least used of these strategies, as usually some biological aspects, like the frequency of amino acid usage in proteins and protein lengths, are desired to match between decoy and target databases. Using reversed sequences as decoys simply reverses the amino acid sequences, while when using shuffling, the original amino acids of a protein are permutated to create the decoy sequence. There has always been some debate in the literature, whether it is better to use reversed or shuffled proteins as decoys67,68, until now without any conclusive result and both strategies are used next to each other. An argument for reversing the targets is that the average length of peptides are identical for targets and decoys. Shuffling, on the other hand, creates more seldom palindromic sequences. Also, there was always some debate, whether a combined target-decoy database should be used for identification or both databases should be used separately. In this work, when not stated otherwise, combined target-decoy databases with shuffled decoys were used.
3.2.2
Estimation of the False Discovery Rate
The goal of the FDR estimation is to estimate the amount of false positives (FP) and thus to limit the ratio of FPs in the reported identifications. As it cannot be known after a database