econ
stor
Make Your Publication Visible
A Service of
zbw
Leibniz-Informationszentrum WirtschaftLeibniz Information Centre for Economics
Verbrugge, Sofie; Van der Wee, Marlies; Fernandez-Gallardo, Maria; Dobrajs, Kristaps; Pickavet, Mario
Conference Paper
Some insights in regulation and potential profitability
off passive fiber infrastructure in Europe
19th ITS Biennial Conference 2012, Bangkok, Thailand, 18 - 21 November 2012: Moving Forward with Future Technologies: Opening a Platform for All
Provided in Cooperation with:
International Telecommunications Society (ITS)
Suggested Citation: Verbrugge, Sofie; Van der Wee, Marlies; Fernandez-Gallardo, Maria; Dobrajs, Kristaps; Pickavet, Mario (2012) : Some insights in regulation and potential profitability off passive fiber infrastructure in Europe, 19th ITS Biennial Conference 2012, Bangkok,
Thailand, 18 - 21 November 2012: Moving Forward with Future Technologies: Opening a Platform for All
This Version is available at: http://hdl.handle.net/10419/72530
Standard-Nutzungsbedingungen:
Die Dokumente auf EconStor dürfen zu eigenen wissenschaftlichen Zwecken und zum Privatgebrauch gespeichert und kopiert werden. Sie dürfen die Dokumente nicht für öffentliche oder kommerzielle Zwecke vervielfältigen, öffentlich ausstellen, öffentlich zugänglich machen, vertreiben oder anderweitig nutzen.
Sofern die Verfasser die Dokumente unter Open-Content-Lizenzen (insbesondere CC-Lizenzen) zur Verfügung gestellt haben sollten, gelten abweichend von diesen Nutzungsbedingungen die in der dort genannten Lizenz gewährten Nutzungsrechte.
Terms of use:
Documents in EconStor may be saved and copied for your personal and scholarly purposes.
You are not to copy documents for public or commercial purposes, to exhibit the documents publicly, to make them publicly available on the internet, or to distribute or otherwise use the documents in public.
If the documents have been made available under an Open Content Licence (especially Creative Commons Licences), you may exercise further usage rights as specified in the indicated licence.
The 19th ITS Biennial Conference 2012
“Moving Forward with Future Technologies:
Opening a Platform for All”
18 - 21 November 2012, Thailand
Some insights in regulation and potential profitability of passive fiber infrastructure in Europe
Sofie Verbrugge(1), Marlies Van der Wee(1), Maria Fernandez-Gallardo(2), Kristaps Dobrajs(2), Mario Pickavet(1)
(1) Ghent University-IBBT, (2) JCP consult
sofie.verbrugge@intec.ugent.be
publish will be made independently by the journals’ editorial boards, not the conference organizers.
1
Abstract
In 2010, the European Commission has formulated some clear objectives to come to one single European telecommunications market by 2020 in its Digital Agenda. These objectives require large investments in new infrastructure. Optical access networks can cope with the high bandwidth required by future applications, but their deployment to the end user involves high road and construction works and costs, which seem only affordable in densely populated areas. Therefore, other investment paths and possible regulatory interventions should be explored.
This paper describes a cost-benefit model, developed within the European research project OASE, for the deployment of a dark fiber infrastructure. The model is applied to specific scenarios, which are constituted of the area type (dense urban/ urban/rural), demand uptake (conservative/ likely/ aggressive) and revenue scheme. The quantitative analysis performed indicates that the business case is in most cases not economically viable. Therefore, as a second step, the paper investigates possibilities and opportunities to improve the business case of the PIP, for instance by prolonging the planning horizon, ensuring revenue from the start of the project by performing demand aggregation or examining where public funds might help.
Keywords: Next-Generation Access Networks, Passive Infrastructure, European regulatory policy, cost-benefit analysis
2
1
Introduction
The Digital Agenda for Europe is the European Union's roadmap for bringing the benefits of a digital society and economy to Europe's citizens [1]. With regards to broadband, the main target has been set as follows: “By 2020, all Europeans should have access to internet of above 30 Megabits per second (Mbps) and 50% or more of European households have subscriptions above 100Mbps.”
In order to achieve such target, an EU broadband policy should promote concrete measures which could (i) foster investment by, for example, reducing investment costs or risks and (ii) enhance competition, taking into account that the competitive threat of alternative public and private investors (including local administrations and public utilities) would incentivize investments in NGA by incumbent operators. Such actions should be coordinated both at EU and national levels, being this the reason why the Commission will work with Member States to generate effective national broadband plans. Moreover, the OECD has recently concluded that the cost savings in just four sectors of the economy (transport, health, electricity and education) would justify the construction of a national Fiber-to-the-Home (FTTH) network [2]. The broadband target will only be achieved if all Member States commit to it and set out an operational plan defining national targets. However, few Member States have fully operational plans for ultra-high-speed networks with concrete implementing measures to realize their targets, notably as to the necessary funding. As part of the governance of the Digital Agenda, the EC will work with Member States to coordinate the establishment of national targets and will encourage peer-review processes among Member States in order to accelerate the transfer of best practice between policy makers. Currently, there a lot of different laws, guidelines and directives on different levels of the hierarchical decision structure. National Regulatory Authorities (NRAs) should implement the directives formulated by the European Commission, but different opinions and interpretations of those directives often lead to different implementations, which hinder the development of one single telecommunications market across Europe.
The combination of this regulatory uncertainty and the high investment costs needed, make that the incumbents are not deploying a full scale Next Generation Access Network (NGAN). Other investment paths should thus be explored, or other partners involved. In actual FTTH deployments, responsibilities are typically split in three conceptual levels [3]. On the lowest level, the physical infrastructure provider (PIP) is responsible for right-of-way, ducts and fibers. The network provider (NP) is responsible for the network connectivity on top of that (Ethernet and IP layers as well as the wavelengths layer if applicable). Finally, there is the service provider (SP) that is responsible for the actual service offer that could be very diverse (single versus multi-play package, streaming versus on-demand services, etc.).
It is the lowest layer (physical infrastructure) that accounts for the largest part of the initial investment cost [4], and it is typically investment in this layer of the network that is postponed by the current telecom operators. This paper will focus only on the cost-benefit analysis of this layer, since new open access business models allow for splitting up the responsibilities of the different layers among different market players. For example, In the case of Stockholm [5] the role of the PIP is taken up by Stokab (100% owned by the city of Stockholm), on top of that different NPs exist like OpenNet and Zitius (which do not connect the same buildings) as well as some
3
integrated NP-SP players. Furthermore, we observe different players on the SP layer like Canal Digital, Disatra, Bredband Bahnhof, AllTele, Tele2, etc.
Within the European project OASE, a reference model was developed to calculate costs and revenues for the different layers of an FTTH network. This model will be adjusted here to perform the necessary calculations for the passive infrastructure. Based on adoption forecast trends and typical values for population densities, nine scenarios will be set up, whereby each scenario represents the combination of an identified adoption curve (conservative/likely/aggressive) and an area (dense urban/urban/rural).
Before starting the quantitative analysis, we will first describe the current regulatory policy in the European Union, in section 2. Section 3 will continue with performing a cost-benefit analysis for the passive infrastructure, under market conditions that can be expected based on current forecasted trends. As will become clear from the results of that section, the business case for the PIP will not be economically viable, except for a dense urban area where a high adoption rate can be expected. Section 4 will therefore look into possibilities to improve this business case, for instance by prolonging the planning horizon, performing demand aggregation, looking for other sources of revenues or by investigating if public funds can be applied. Section 5 concludes the paper by indicating some recommendations to make a viable business case for FTTH access network deployment.
2
Current regulatory regime
Although the mindset of all regulatory authorities is set in the same direction, namely towards offering broadband to all, and achieving one single telecommunications market across Europe, the variety and diversity of regulatory institutions on regional, national and European level, that all have their own rules, make it hard to see the overview. Before going into quantitative analysis of the business case for the passive infrastructure, this section will therefore elaborate on the different regulatory decisions and their consequences.
2.1 EU Instruments to implement legislation and objectives
There are various instruments used by the European Commission (EC) to implement its objectives and goals and they have diverse degrees of enforceability vis-à-vis the Member States’ legislative bodies (i.e. obligation to follow a given instrument); thus, such instruments (treaties, directives, decisions, recommendations and regulations) may have a direct or indirect effect on the laws of the EU’s Member States.
Any action undertaken by the EU is founded on treaties approved by the EU Member States. To achieve the set out aims, legislative acts such as regulations, decisions, directives and recommendations are used.
Regulations are binding legislative acts that have to be implemented in their entirety across all EU Member States. For example, the EU has capped the maximum amount telecoms companies can charge a user for the roaming costs of their cellular telephone (EC Regulation No 544/2009) [6].
Directives are not as binding as regulations. Instead, they are a goal that each Member State will implement according to its legislative processes. In the Framework Directive (Directive 2002/21/EC), the EC set out a roadmap in
4
establishing a harmonized regulatory framework for electronic communications networks and services [7].
Decisions are binding legislative acts that are directly applicable to whom it is addressed (e.g. The European Commission's March 2004 Microsoft Decision, {Case COMP/37.792 – Microsoft}) [8].
Recommendations are not binding. Instead they express the known views of an institution. In its recommendation of 30th of March 2012 (Action for Stability, Growth and Jobs {COM(2012) 299 final}), the EC stressed the potential of the ICT industry in a job-rich recovery for the EU [9].
2.2 Current Regulation
The current rules which govern the telecommunication sector in the European Union (EU) were set in 2002 and revised by the European Parliament and the Council of the European Union. This revision entered into force on 18 December 2009 (after two years of discussions), and has been implemented into Member State legislation since May 2011 [10].
Currently, broadband is regulated in EU Member States by national telecoms regulators in order to avoid distortions of competition. Incumbent operators, that own a Significant Market Power (SMP), are required to provide access to their networks, which cannot be duplicated in a reasonable time period, in order to enable consumers to choose between broadband providers. The roll out of Next Generation Access (NGA) networks does not remove the existing competition concerns regarding broadband since incumbents could leverage the dominant position they enjoy as owners of non-replicable legacy access infrastructure to monopolize new broadband services provided over this infrastructure and thereby limit consumer choice.
As such, the wholesale broadband market warrants ex-ante regulation, under the Commission Recommendation on relevant markets (Commission Recommendation of 17/12/2007) [11]. Unless it can be established that NGA access services are markets different from the current regulated wholesale broadband markets, dominant operators with significant market power (SMP) in these markets are within the scope of the Recommendation and access to their NGA networks should be regulated. Proper broadband regulation remains a necessity to ensure a level playing field amongst NGA investors and brings benefits to consumers, including better services, greater choice and better prices.
Taking this into account, the Commission has taken an overwhelmingly favorable view towards State measures for broadband deployment for rural and underserved areas, whilst being more critical for aid measures in areas where a broadband infrastructure already exists and competition takes place.
2.3 Current Recommendations
Within the European policy on the general access networks, two documents are linked with the favorable deployment of broadband networks, in which FTTH can be included from a regulatory perspective.
2.3.1 Recommendation on regulated access to Next Generation Access (NGA) networks
5
The Recommendation on regulated access to Next Generation Access (NGA) networks [12] establishes a common approach within the European Union for the regulation of fiber-based networks, which is the main topic for meeting the broadband targets set out in the Digital Agenda Error! Reference source not found.. The Recommendation includes several features to ensure promising market outcomes based on the combination of incentives to invest and competition from other market players.
First, to enable investors to make attractive and fair profits, any regulated prices for access to fiber networks will fully reflect investment risk for the investing companies, normally in the form of granting a risk premium.
Second, competition will be preserved by granting new market entrants reasonable access to the new fiber infrastructures. The Recommendation gives National Regulatory Authorities (NRA) sufficient leeway to support fair market entry and infrastructure-based competition.
Third, there can be flexibility in national regulation to reflect market differences in urban and rural areas. For example where competition is strong, or market dynamics change, NRAs will be able to adapt or withdraw their regulatory measures to reflect this.
The scope of this Recommendation primarily covers remedies to be imposed upon operators designated with Significant Market Power (SMP) on the basis of a market analysis procedure carried out under Article 16 of Directive 2002/21/EC. However, where it is justified on the grounds that duplication of infrastructure is economically inefficient or physically impracticable, Member States may also impose obligations of reciprocal sharing of facilities on undertakings operating an electronic communications network in accordance with Article 12 of that Directive which would be appropriate to overcome bottlenecks in the civil engineering infrastructure and terminating segments.
Consistency of regulatory approaches taken by NRAs is of fundamental importance to avoid distortions of the single market and to create legal certainty for all investing undertakings. It is therefore appropriate to provide guidance to NRAs through the different instruments issued by the EC that aim at preventing any inappropriate divergence of regulatory approaches, while allowing NRAs to take proper account of national circumstances when designing appropriate remedies.
2.3.2 Guidelines for broadband networks
The Broadband Guidelines [13] outline the rules and conditions on how public funding could be provided to build broadband networks in line with the European Union State Aid rules. These Guidelines provide guidance for governments and public authorities on how to finance very high speed, NGA networks, as well as addressing the funding of traditional broadband networks (like ADSL, cable, Wi-Fi networks).
The main aim of the Guidelines is to facilitate a rapid deployment of NGAs in Europe by providing to all stakeholders (including local and regional authorities, as well as network operators) a clear, predictable and comprehensive framework for the public financing of such networks; this framework is further detailed by the investment principles described in the following section, and extended through the investment models proposed by the Guide to Broadband Investment. The latter means EU State Aid rules would play a role in channeling public funding to areas where private
6
companies have no commercial incentives to invest – for instance because of the high costs of deploying broadband networks, the low population density or the low levels of economic activities. State Aid can have a crucial role to extend adequate broadband services to all European citizens – no matter whether they are living in large urban areas or in small villages.
2.4 State Aid and Investment Principles
In case a Member State Member supports the roll-out of broadband by way of an equity participation or capital injection into a company that is to carry out the project, it becomes necessary to assess whether this investment will be regarded by the EU as State Aid. In principle, State Aid can play a useful role in cases where the market does not provide sufficient broadband coverage.
Assessing the existence of State Aid is relevant as in its “pure” form it might not favor free competition. The concept of “pure” State Aid is defined in Article 87 of the European Community Treaty as "any aid granted by a Member State or through State resources in any form whatsoever which distorts or threatens to distort competition by favoring certain undertakings or the production of certain goods that shall, insofar as it affects trade between Member States, be incompatible with the common market".
2.4.1 When is public investment qualified as State Aid?
In order for a measure to qualify as State Aid, the following cumulative conditions have to be met:
a) The measure has to be granted out of State resources; b) It has to confer an economic advantage to undertakings;
c) The advantage has to be selective and distort or threaten to distort competition; d) The measure has to affect intra-Community trade.
On the other hand, there are two scenarios in which public investment is not regarded as State Aid in accordance with the Case-law of the European Communities (“ECJ”): 1. When the capital placed by the State - directly or indirectly- is at the disposal
of an undertaking in circumstances which correspond to normal market conditions, it cannot be regarded as State Aid on the basis of the principle of equal treatment within Member States Members;
2. When the Member State may consider that the provision of a broadband network should be regarded as a service of general economic interest ("SGEI") [13] as qualified by the Altmark criteria, the State funding may fall outside the scope of State Aid.
2.4.2 Description of black areas, white areas and grey areas
In order for the EC to assess whether Staid Aid for NGA networks is compatible with Article 87(3) (c) of the European Community Treaty, black, white and grey area designations are used. Because this designation is mostly in the assessment of traditional broadband development, it requires a more refined definition [13] to take into account the specificities of the NGA networks , as explained below.
The white area refers to an area where NGA networks do not at present exist and where they are not likely to be built in three years. It certainly includes an area where there is no basic broadband infrastructure. It also includes areas where only one basic broadband provider is present or there are several basic broadband providers. However, in the latter case, Member States must prove that the current services are not sufficient to satisfy the needs of citizens and business users and there are no less distortive means. Recent examples of rural areas (regarded as
7
white since no broadband or NGA services were available) that have been deserved are Ireland and Slovenia, as per decisions no. N 607/2009 and N 172/2009 where the European Commission decided favourably for grant of State-Aid.
The grey areas are areas where only one NGA network is in place or is being deployed in the coming three years. In order to have such State Aid approved by the Commission, Member States must provide evidence that the current or planned NGA network is not sufficient to satisfy the needs of citizens and business users and there are no less distortive means. This was the case in Appingedam [14], where various broadband offers were already provided over two existing networks (KPN and cable), at prices similar to those of other regions in The Netherlands. The measure would distort competition due to its discriminatory impact on existing or future private networks; consequently, the construction of an additional network with state funding would address neither a market failure nor a cohesion problem so State-Aid was prohibited.
Finally, black areas are areas where more than one NGA network exists in a given area or will be deployed in the coming three years: no subsidies are allowed in this case.
2.4.3 Scope of the possible investments based on the EC guidelines for access networks
With regard to the above mentioned explanation of the principles upon which public funds shall be invested; this section will detail the vehicles that can be used to channel public funds for the deployment of basic broadband networks as well as NGA networks to areas where private operators do not invest. The distinction between areas (black/grey/white), is then adapted to the situation of NGA networks (whose deployment is still at an early stage) by requiring Member States to take into account not only existing NGA infrastructures but also concrete investment plans by telecom operators to deploy such networks in the near future.
The Guidelines for broadband networks explicitly mention that “investing in infrastructure, rather than investing directly in services, will help to ensure that a Managing Authority does not distort the market, which could be detrimental to end users. The Managing Authority must consider the type of infrastructure along three dimensions: the scope of the network, the performance of the network, and the ability of the network to support competition [9].” Based on this idea, the guide proposes the following investment vehicles:
Bottom-up: a group of end users (frequently organized as a ‘co-operative’) decides to invest in the deployment of a network. Public involvement is usually limited to issuing grants or guaranteeing loans, and/or facilitating access to publicly owned infrastructure such as ducts.
Private design, build and operate: a private company receives funds (often in the form of a grant) from the public sector to assist in network deployment, but the private company retains full ownership.
Public outsourcing: a public sector body outsources the construction and operations of the network to the private sector under a long-term agreement, but the public sector body retains ownership of the network.
Joint venture: public and private sector bodies both retain a stake in the network, as both provide equity or resources.
Public design, build and operate: the public sector constructs and operates the network itself, retaining full control and offering services on a retail or wholesale
8
basis. However, this model is not further considered in the guidelines as it is not frequently implemented by the Member States Managing Authorities..
3
Cost benefit modeling for the passive infrastructure
Although deploying an all-fiber network requires more than purely installing the cables in the ground, it is typically the dark fiber infrastructure (also called passive infrastructure) that takes up the largest part of the cost (typically around 70%) [4]. This section will therefore only focus on the cost and revenue modeling for the passive infrastructure. Similarly, the cost benefit analysis is only calculated for the physical infrastructure provider (PIP). Note that all calculations throughout the paper are based on a point-to-point access network topology.
3.1 Scenarios based on area type and expected adoption
In order to get a good overview of possible outcomes of the business case, nine different scenarios will be studied. These nine scenarios represent a combination of area type and adoption curve, which will all be shortly described below.
3.1.1 Area types
Three specific area types are considered: dense urban, urban and rural. They differ in number of households, surface and therefore also cable distance (Table 1).
Table 1: Parameters for the area types (note: HH = households)
Area type Number of HH Surface (km2) Household density (HH/km2) Total trenching length (km) Trenching length per HH (m) Dense urban (DU) 15,600 5 3,120 12,950 6.75 Urban (UR) 8,640 24 360 14,040 19.00 Rural (RU) 3,060 57 54 7,840 16.50
3.1.2 Adoption curves
In every business model, a lot depends on the take-up rate of the product or service by the end-consumers, which varies over time, since exactly these end-consumers have to pay back the investment. In order to reflect the uncertain uptake, we developed three different curves, which were estimated based on the forecasts for three representative European countries (Figure 1). The likely curve represents an average adoption uptake and speed, and is modeled by the forecast for the Netherlands (in which some fiber networks are already present). The aggressive curve models a fast uptake, as forecasted for Slovakia, while the conservative curve is based on the forecast for Germany, which has a lower speed of adoption than average.
9
Figure 1: The adoption curves for the scenario studies
3.2 Total cost of ownership for a dark fiber network
Deploying the passive infrastructure requires a huge initial investment that consists of manual labor cost for trenching and costs for fiber cables, ducts and micro-ducts. The combination of this outside plant cost with the upfront cost for installing the necessary, passive, equipment in the central office and street cabinets (e.g. ODF racks), results in the total Capital Expenditure (CapEx) for the PIP (Figure 2). Note that we only take into account the cost for the access network, we don’t look at in-house cabling. Typically, this in-house cabling is done by the house owner (in case of single units), or outsourced and paid by the housing organization (in case of multi-dwelling units).
Of course, there are also costs during the lifetime of the infrastructure: a cable may break, which requires digging and splicing to repair, and renting costs for the floor space in the central office have to be paid every year. These yearly recurring costs are grouped as Operational Expenditures (OpEx).
Figure 2: Overview of the passive infrastructure in a P2P network
The addition of both CapEx and OpEx results in the TCO (Total Cost of Ownership) of the passive infrastructure, and was modeled in more detail in [15]. Here, we only show aggregated results on CapEx and OpEx level.
The total cost of ownership of the physical infrastructure for the three areas clearly reflects the differences in number of users and average distance covered per user (Figure 3). As the PIP cost is nearly entirely driven by upfront, distance based trenching cost, there is negligible impact from the adoption curves, therefore only the results for the likely curve are shown here. When considering the cost for the physical infrastructure spread over all potential customers (cost/home passed = cost/HP), we clearly see that this is growing with a decreasing household density and therefore
0 0.1 0.2 0.3 0.4 0.5 0.6 0.7 0.8 0.9 1 2010 2012 2014 2016 2018 2020 2022 2024 2026 2028 2030 Adoption curves conservative likely aggressive Distribution Feeder Rack ODF Flexibility point
Central office
Duct Microduct Fiber10
decreasing trenching cost per household. Note that the cost/HP in the dense urban area (572 euro) is doubled in the urban area (1094 euro) and tripled in the rural area (1764 euro). The TCO for the physical infrastructure, on the other hand, also shows the impact of the total amount of customers per area. Here we observe that the overall cost for the rural area (5.40 million euro) is significantly smaller than that for the urban area (9.45 million euro), only based on the significantly lower number of customers. The cost for the dense urban area (8.92 million euro) is only slightly smaller than for the urban area.
Figure 3: Total Cost of Ownership for the PIP, cumulative and discounted over 20 years (for likely adoption curve)
When considering the OpEx/CapEx ratio for the different areas (Figure 4), we see it growing with the trenching distance covered. This is clear because the OpEx is mostly driven by the fiber repair cost in case of a cable cut.
Figure 4: CapEx - OpEx split for the PIP for the dense urban area and likely adoption curve (cumulative and discounted over 20 years)
3.3 Possible revenues for a Physical Infrastructure Provider
Although it is easy to find revenues that the end-customer pays for a basic telecom offer, revenues from commercial players for the different layers, and in this case for the PIP, are hard to find. This section will describe some ideas on where to find indicative values for the revenue for the passive infrastructure.
3.3.1 Regulated DSL unbundling offers
One possibility is to compare revenues for a FTTH infrastructure provider with the charges OLO’s (Other Licensed Operators) currently pay to the incumbent for unbundling of the local loop (LLU) in DSL networks. These regulated prices vary amongst EU Member States, but the average OLO pays between €7 and €10 per customer per month for the use of the unbundled DSL local loop [16][17].
3.3.2 Regulated fiber unbundling offers 0 1 2 3 4 5 6 7 8 9 10
dense urban urban rural
cum ul at iv e di sc oun te d cos t (M ill io n €
) TCO physical infrastructure
PIP Opex PIP Capex 0 200 400 600 800 1000 1200 1400 1600 1800 2000
dense urban urban rural
cu m u la ti ve d is co u n te d c o st /H P (e u ro )
cost physical infrastructure/HP
opex/HP capex/HP
Dense urban Urban Rural
CAPEX OPEX
11
Analogously to regulated prices for DSL unbundling and bitstream access, some countries have regulated prices for access on dark fiber. We will work here with the example of the Netherlands, where Reggefiber and OPTA (the Dutch National Regulatory Authority) agreed on prices for ODF access [18]. They charge a fixed upfront price and a monthly tariff per customer, whereby both depend on the number of individual fiber pairs and the CapEx per household (Table 2). The connection charge represents an initial fee to be paid by the NP in the beginning of the contract. The fixed monthly charge covers the rent of floor space and the lease of the link to the backbone network, while the monthly charge per customers needs to be paid for the lease of the dark fiber in between the central office and the customer’s premises.
Table 2: Revenues for the PIP as charged by Reggefiber
Dense urban Urban Rural Connection charge €18,453 €9,226 €6,151 Monthly charge fixed €4,304 €2,767 €2,254 Monthly charge per customer €7.39 €14.49 €25.39
3.3.3 Calculating the revenue potential for the PIP
When combining the revenues described above with the scenarios of section 3.1, the total revenue potential for each scenario can be defined (Figure 5). For regulated revenues in case of DSL, we have assumed a fixed fee per customers (low 7 euro, high 10 euros), which obviously leads to a growing revenue with the population per area and the adoption curve. For the case of the regulated prices for fiber unbundling, however, the Reggefiber scheme was used, which is not that straightforward. As the prices are based on the so-called CapEx-ranges, a relatively higher revenue is obtained for the areas with lower household density and therefore higher trenching distances.
Figure 5: Total Revenue potential for the PIP
0 2 4 6 8 10 12 C o n se rv at iv e Lik e ly A gg re ss iv e C o n se rv at iv e Lik e ly A gg re ss iv e C o n se rv at iv e Lik e ly A gg re ss iv e
Dense urban Urban Rural
cum ul at iv e di coun te d e ur or e ve nue ov e r 2 0 ye ra s (M ill ions € )
Revenues based on regulated DSL and fiber prices
DSL low DSL high Reggefiber
12
3.4 Cost Benefit Analysis for the different scenarios under study
Now the costs and revenues for the passive infrastructure have been described and analyzed separately, this section will bring them together to investigate the economic viability of the business case for a physical infrastructure provider for the different scenarios described above.
3.4.1 PIP business case over 20 years
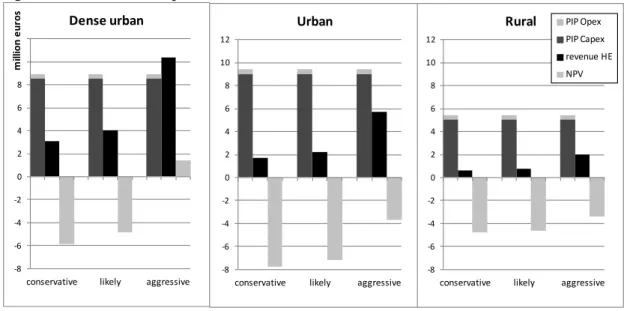
With the assumption at hand, the business case for the PIP over 20 years is only viable in a dense urban area with aggressive adoption (Figure 6). This means that in all other case the monthly revenue of 10 euro for the PIP, which was assumed as the high-end (HE) of the expected revenues, does not suffice to cover for the costs.
Figure 6: cumulative costs, revenues and NPV
It should be mentioned that, although the cost model is relatively detailed and accurate, it does not take administrative and other overhead costs into account. This should be kept in mind when analyzing the results of the business case: obtaining a zero-NPV will most probably not be economically viable.
3.4.2 Estimated payback time
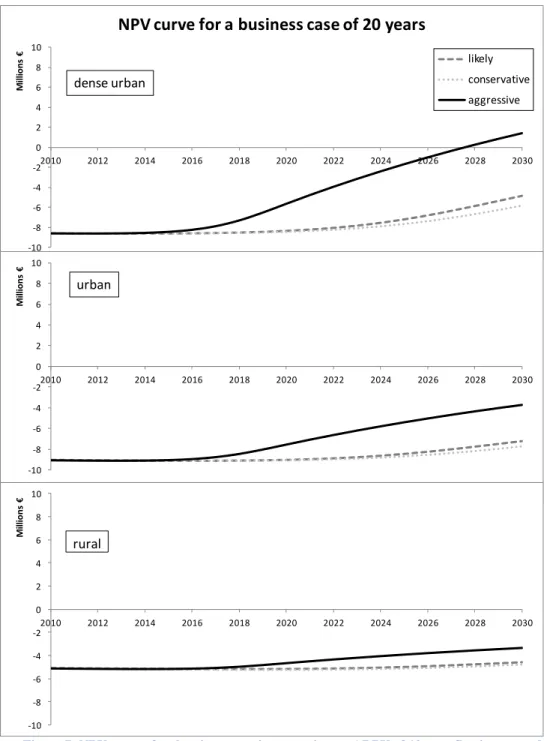
Discounted cash flows for the three areas and three adoption curves (Figure 7) indicate that we only have a payback which is lower than 20 years (2010-2030) in the case of aggressive adoption in a dense urban area.
This observation can be interpreted in two ways. Either the observed time frame of 20 years (or the combination of the time frame of 20 years and the used discount rate of 5%) is not appropriate for the evaluation of an infrastructure project as considered here; or 20 years is the right timeframe indeed and the business case simply does not fly based on the current regulatory prices, so that we cannot assume that anyone with ever invest in it under market conditions. In section 4 we will study some potential improvements to the business case as it described here.
-8 -6 -4 -2 0 2 4 6 8 10 12
conservative likely aggressive
m ill ion e ur os Dense urban -8 -6 -4 -2 0 2 4 6 8 10 12
conservative likely aggressive Urban -8 -6 -4 -2 0 2 4 6 8 10 12
conservative likely aggressive
Rural PIP Opex
PIP Capex revenue HE NPV
13
Figure 7: NPV curves for the nine scenarios assuming an ARPU of 10 euro flowing towards the PIP
3.4.3 Revenue needed per home connected
In the previous sections, we have calculated the PIP business case starting from known revenues. However, the reverse calculation can give another insight in the problem: we can calculate the revenues needed (per subscriber and per month) based on the known TCO. The following formula is used:
where X = revenue per user per month r = the discount rate
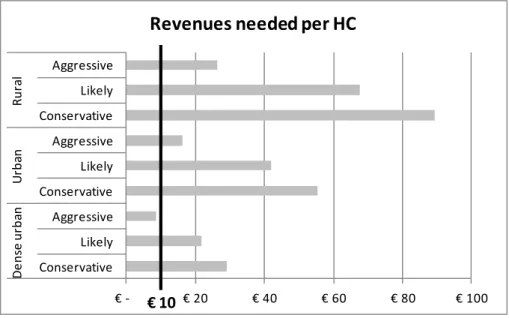
The obtained required monthly revenues per home connected for the break even case (Figure 8) confirm our previous results: only in the dense urban area with the aggressive adoption curve the needed revenue per user and per month (8.6 euro) is
-10 -8 -6 -4 -2 0 2 4 6 8 10 2010 2012 2014 2016 2018 2020 2022 2024 2026 2028 2030 M ill ions €
NPV curve for a business case of 20 years
likely conservative aggressive -10 -8 -6 -4 -2 0 2 4 6 8 10 2010 2012 2014 2016 2018 2020 2022 2024 2026 2028 2030 M ill ions €
likely conservative aggressive
-10 -8 -6 -4 -2 0 2 4 6 8 10 2010 2012 2014 2016 2018 2020 2022 2024 2026 2028 2030 M ill io n s € rural dense urban urban
14
lower than the DSL price cap of 10 euro. In all other scenarios, a much higher monthly revenue is needed (for urban at least 16.5 euro, for rural even 26.5 euro, both for the aggressive adoption curve)!
Figure 8: Revenues needed per subscriber per month (in a business case with planning horizon of 20 years)
3.4.4 Impact of variable revenue, better reflecting costs
All results above indicate that the business case for the PIP is very difficult. Based on the assumed an average revenue of max 10 euro per month per customer, the case is only profitable in a dense urban area with aggressive adoption. In the other scenarios, the estimated payback time clearly exceeds the considered 20 years. Our calculations show that there is at least a monthly revenue needed of 16.5 euro per customer per month for an urban deployment, and even 26.5 euro monthly per user to cover a rural area.
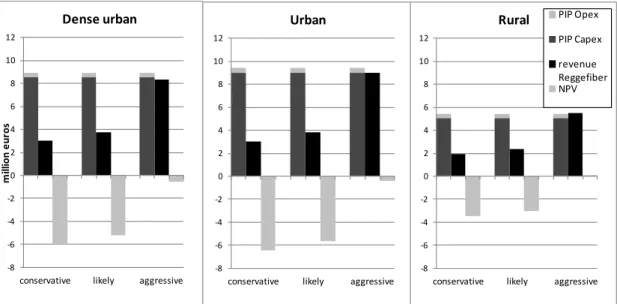
One explanation is in the fact that fixed revenues per customer for the PIP, independent from the area, do not reflect the cost base. Therefore, in order to reduce risk PIP pricing should better reflect costs by charging based on distance like the Stokab model [19] or by at least differentiating between some area types like the Reggefiber model (Figure 5).
Figure 9 shows the cumulative costs and revenues according to the regulated prices used by Reggefiber. It is clear that using these pricing schemes, which do depend on the area, improves the business case for the less densely populated area (urban and rural), a lot. However, the business case is never positive, when the extra administrative and overhead costs would be taken into account.
€ - € 20 € 40 € 60 € 80 € 100 Conservative Likely Aggressive Conservative Likely Aggressive Conservative Likely Aggressive De n se u rb an U rb an Ru ra l
Revenues needed per HC
15
Figure 9:cumulative costs and revenue according to Reggefiber’s assumptions, as well as resulting NPV (cumulative and discounted after 20 years)
Using pricing schemes adapted to the region under study could make a lot of sense to improve the business case for the PIP, but is not an option to extend to the higher layers of NP and SP, or even the end-customers: it would not be fair to charge farmers in rural areas triple the price for the same internet capability as offered in densely populated cities…
4
How to improve the business case?
Since the results from section 3 indicate rather negative business cases, other sources of revenue or other means to improve the business case should be found. This section proposes some specific measures that could be taken to make the investment in a passive infrastructure a good choice from an economic point of view.
4.1 Impact of demand aggregation
The business case for the PIP is especially difficult because of the combination of a high upfront cost and revenues that have a very slow uptake. One solution could be to have the revenues sooner in the project lifetime. Demand aggregation is a process in which interested customers sign a cooperation agreement before the deployment is started. In this way areas can be chosen in which there will be a guaranteed uptake from the start. For example, Reggefiber expects a level of 30-40% demand aggregation before starting the deployment [20]. We have modeled the impact of demand aggregation of 20 or 40% on the adoption curve, by adding this percentage to the expected adoption. However, we assume that the curve doesn’t exceed the original maximum adoption percentage of 81.20%.
In the dense urban case, also the original aggressive curve led to a positive business case, which is clearly strengthened by an additional demand aggregation. For the urban area, we see that the negative NPV of minus 4 million euro is halved by demand aggregation of 20% and nearly equaled out by a level of demand aggregation of 40%. The rural case remains difficult though.
-8 -6 -4 -2 0 2 4 6 8 10 12
conservative likely aggressive
m ill ion e ur os Dense urban -8 -6 -4 -2 0 2 4 6 8 10 12
conservative likely aggressive Urban -8 -6 -4 -2 0 2 4 6 8 10 12
conservative likely aggressive
Rural PIP Opex
PIP Capex revenue Reggefiber NPV
16
Figure 10: Cumulative costs, revenues and NPV in case of aggressive adoption curves, as in their original forms as well as with a level of demand aggregation of 20 and 40%
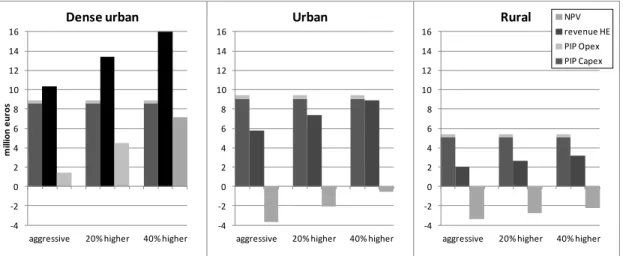
4.2 Impact of duct reuse
It is clear from Figure 4 that the majority of the PIP costs, and by extension of the entire FTTH deployment cost, is in the CapEx. More specifically it is in the trenching and ducting cost, which is significantly higher than the cost for the fiber itself [4]. In case some parts of the ducts can be reused, this will therefore lead to a significant cost benefit.
Actual duct reuse can take different forms. Of course, “old” telecom ducts used in the copper network can be an option, but for example in Paris, fiber was deployed in sewer systems [21]. In the EC guidelines for access networks, the bottom-up approach was suggested as an investment vehicle (see section 2.4.3). This can also facilitate access to publicly owned infrastructure such as ducts, and therefore drastically reduce this cost.
To quantify the effect of possible duct reuse on the business case for the PIP, we compared three scenarios:
a greenfield deployment, where no ducts can be re-used,
a “small” scenario, where between 25% and 70% of the ducts in the feeder fiber section can be re-used, and 15 to 20% in the distribution cable section of the network (Figure 2),
a “large” scenario, with a duct re-use of 35 to 80% in the feeder fiber section, and about 20 to 40% in the distribution cable section.
The variances in duct reuse are explained by a different estimation of the available ducts in the different areas: the available ducts will be much higher in a dense urban region, where most probably, an existing telecom network is already present, while the availability and/or quality of current telecom network is rural areas might be much lower.
Figure 11 shows the impact of the three levels of duct reuse on the TCO, which clearly is significant. Because of the higher duct reuse in the dense urban area, the savings that can be achieved are also higher. Reusing ducts makes the business case better, but still not economically viable for deployment in an urban or rural region.
-4 -2 0 2 4 6 8 10 12 14 16
aggressive 20% higher 40% higher
m ill ion e ur os Dense urban -4 -2 0 2 4 6 8 10 12 14 16
aggressive 20% higher 40% higher
Urban -4 -2 0 2 4 6 8 10 12 14 16
aggressive 20% higher 40% higher
Rural NPV
revenue HE PIP Opex PIP Capex
17
Figure 11: TCO for the PIP (cumulative and discounted after 20 years), for three levels of duct reuse (according to the aggressive adoption forecast)
Reusing available ducts is only one option to reduce the overall trenching costs. These costs can also be lowered by using other techniques, like for example, direct buried cable, which installs the cables in a very narrow trench [22]. In the Netherlands, this deployment, immediately in the road, was considered. Another option is to combine the deployment of FTTH with other utility network rollouts (e.g. water, gas, electricity, etc.), which can entail cost savings of up to 21% [23].
4.3 Additional revenue sources
Results up till now have assumed PIP revenues based on a per customer fee (of maximum 10 euro), in some cases differentiated based on the associated cost (Reggefiber model) combined with an expected adoption for advanced broadband services. However, we can imagine additional revenues for a physical infrastructure provider, as the dark fiber he deploys could also be of interest to non-telco customers. These revenues can be significant, as Stokab reported they can add up to 50% of their total revenue [24].
Possible additional revenues can come from large businesses or public institutions (like administrations, hospitals, schools, etc.) that want to rent an end-to-end dark fiber connection, and use their own active equipment for lighting it up. This ensures a safe and secure connection between multiple establishments of one enterprise (e.g. a bank). If an FTTH network is present, it can also be used as a backhaul network for Next-Generation wireless offerings, like LTE or WIMAX. The base stations of these networks can be connected to the fixed fiber network, and the wireless operators pay their fair part of the lease.
The quantification of these effects is outside the scope of this paper.
4.4 Prolonging the planning horizon
Since the passive infrastructure that is currently providing internet to all, the incumbent’s copper network or the cable operator’s HFC (Hybrid Fiber Cable) network, has been deployed decades ago, and still hasn’t reached the end of its lifetime (if there would be no need for higher speeds, the copper networks could still be used much longer), it is likely to expect that the same holds for the dark fiber cables. It thus makes sense to prolong the planning horizon, since it’s very likely that the dark fiber infrastructure will generate revenues for more than 20 years. Furthermore, prolonging the business case will also extend the adoption curve, leading to a higher adoption potential in a later stage of the project (Figure 12). These revenues are not captured in the initial business case with a lifetime of 20 years.
0 1 2 3 4 5 6 7 8 9 10
dense urban urban rural
M
ill
ion
s
€
TCO physical infrastructure
greenfield small large
18
Figure 12: Prolonged adoption curves
When considering discounted cash flows over a period of 40 years (2010-2050, Figure 13), we observe a discounted payback time of less than 40 years in the dense urban scenario, independent from the adoption curve. Also for an aggressive adoption in the urban scenario, we see a positive case in less than 40 years.
When comparing needed monthly revenues over 20, 30 and 40 years for all scenarios (Figure 14), we see that the 10 euro clearly satisfies the condition of a break even PIP for the dense urban area for all adoption curves after 40 years
The difference between the business case for 20 years and 30 years is much higher than going from 30 to 40 years. This can be explained by two effects. First, in 2030, the adoption curve hasn’t reached its maximum potential, so more customers will subscribe in 2030-2040 (while the number of new subscribers between 2040 and 2050 is negligible). Secondly, the further in the future the revenues are paid, the higher the effect of discounting, and thus the lower the impact on the cumulative revenue. Therefore, we decided not to look beyond a business case of 40 years.
0 0.1 0.2 0.3 0.4 0.5 0.6 0.7 0.8 0.9 2010 2015 2020 2025 2030 2035 2040 2045 2050
Prolonged adoption curves
conservative likely aggressive
19
Figure 13: NPV curves for prolonged business cases
Figure 14: Revenues needed per subscriber per month (40 year planning horizon)
-10 -8 -6 -4 -2 0 2 4 6 8 10 2010 2015 2020 2025 2030 2035 2040 2045 2050 M ill ions €
NPV curve for a prolonged business case
likely conservative aggressive -10 -8 -6 -4 -2 0 2 4 6 8 10 2010 2015 2020 2025 2030 2035 2040 2045 2050 M ill ions €
likely conservative aggressive
-10 -8 -6 -4 -2 0 2 4 6 8 10 2010 2015 2020 2025 2030 2035 2040 2045 2050 M ill ions € rural dense urban urban € - € 20.0 € 40.0 € 60.0 € 80.0 € 100.0 Conservative Likely Aggressive Conservative Likely Aggressive Conservative Likely Aggressive De n se u rb an U rb an Ru ra l
Revenues needed per HC
BC 40 years BC 30 years BC 20 years
20
4.5 Use of State Aid or other public funds
In the previous sections we have indicated that, even with a planning horizon extended until 40 years, the business case for the physical infrastructure provider remains very difficult. In order to cover the costs with the assumed revenue of 10 euro per customer per month (Figure 14), in the urban area there is 7.6 euro missing for the conservative adoption curve and 5.7 for the likely curve. In the rural area there is resp. 18.4, 15.5 and 6.2 euro missing for the conservative, likely and aggressive curve.
Despite of the potential additional revenues from e.g. non-telco customers, the cost reduction based on duct reuse and the positive impact of demand aggregation on the timing of the revenues, it is clear that there will remain scenarios (combinations of areas and adoption curves) that will not result in a positive business case.
In case the provision of a broadband network is regarded as a service of general economic interest ("SGEI") [14], state funding might fall outside the scope of State Aid and therefore could be a solution to make the case economically viable. Otherwise, in case physical infrastructure is deployed by some undertaking, state funding might still be involved (e.g. in a PPP structure) when the capital placed by the State - directly or indirectly- is at the disposal of an undertaking in circumstances which correspond to normal market conditions.
5
Conclusions
Based on the Digital Agenda for Europe, Member State plans should comprise a balanced set of policy actions to incentivize and supplement private-sector action. Private investment should be encouraged by appropriate coordination of planning and rules for sharing physical infrastructure and by targeted financing measures to reduce risk and promote new open infrastructures.
In this paper we have shown that the business case for the physical infrastructure provider (PIP) is very difficult. Different scenarios have been calculated, based on reference areas (urban, dense urban and rural), as well as likely, aggressive and conservative adoption curves. Based on an average revenue of max 10 euro per month per customer, the case is only profitable in a dense urban area with aggressive adoption. In the other scenarios, the estimated payback time clearly exceeds the considered 20 years. The calculations show that there is at least a monthly revenue needed of 16.5 euro per customer per month for an urban deployment, and even 26.5 euro monthly per user to cover a rural area.
The Recommendation on regulated access to Next Generation Access (NGA) networks suggests to enable attractive and fair profits for investors. Regulated prices for access to fiber networks should fully reflect investment risk for the investing companies, normally in the form of granting a risk premium. In the results above, both this risk premium and any administrative and other overhead costs are not taken into account. Regulated fiber access prices are only available in a few Member States now (like the Netherlands), however, based on the discussion above we can assume that they will or should on average be clearly higher than the 10 euro assumed here. Furthermore, in order to remove risk for the PIP, fiber access prices can reflect costs in some way, e.g. taking into account distances or area types. This is also completely in line with the Recommendation on regulated access to Next Generation Access
21
networks which gives the flexibility in national regulation to reflect market differences in urban and rural areas. This policy measure will facilitate the business case for the PIP.
Taking a closer look at the business case assumptions, we have indicated several potential refinements that improve the case. Demand aggregation ensures a significant market share and therefore revenue immediately after deployment by having interested customers sign a cooperation agreement upfront. A level of demand aggregation of 40% can nearly make all scenarios in urban and dense urban areas profitable. Taking advantage of duct reuse has an important impact on the cost base: and leads to significant decreases of the trenching costs. Reusing ducts results in a very positive business case for a dense urban region, and makes the required investment pit for the urban and rural regions less deep, but doesn’t result there in a positive business case. Another option is to look for other types of customers than the pure residential ones: additional revenues from public institutions or businesses (both large, medium and small enterprises) can help to improve the case.
Furthermore, as we are considering an infrastructure investment here, it might make sense to prolong the planning horizon beyond 20 years. A discounted payback time of less than 40 years was observed in the dense urban scenario, independent from the adoption curve. Also for an aggressive adoption in the urban scenario, we see a positive case in less than 40 years. Despite all measures discussed above, the business case for the PIP in rural areas seems not to fly. The use of public funds might be the only way out. If the Member State considers the provision of a broadband network should be regarded as a service of general economic interest, state funding might fall outside the scope of State Aid and could therefore be feasible. The same holds when the capital placed by the State is at the disposal of an undertaking in circumstances which correspond to normal market conditions.
Acknowledgement
The authors of this publication have received funding from the Agency for Innovation by Science and Technology in Flanders (IWT), and this research was partially carried out in the framework of the project OASE. This project has received funding from the European Union's Seventh Framework Programme (FP7/2007-2013) under grant agreement n° 249025.
References
[1] Commission Communication COM(2010) 245 final/2, A Digital Agenda for Europe
http://eur-lex.europa.eu/LexUriServ/LexUriServ.do?uri=COM:2010:0245:FIN:EN:PDF
[2] OECD, “Network developments in support of innovation and user needs,” 2009
[3] M. Forzati, C. P. Larsen, C. Mattsson, “Open access networks, the Swedish experience”, 12th
International Conference on Transparent Optical Networks, ICTON 2010, Munich, Germany, June 27 - July 1, 2010.
[4] K. Casier, S. Verbrugge, R. Meersman, D. Colle, M. Pickavet, P. Demeester, (2008), “A clear and
balanced view on FTTH deployment costs,” The journal of the Institute of Telecommunications Professionals, 2(3), 27-30.
[5] M. Van der Wee et al., ”Making a Success of FTTH. Learning form case studies in Europe,”
Journal of the Institute of Telecommunications Professionals (ITP), Vol. 5 part 4. 2011.
[6] Council Regulation (EC) 544/2009 on roaming on public mobile telephone networks within the
22
communications networks and services [2009] OJ L167/124
http://eur-lex.europa.eu/LexUriServ/LexUriServ.do?uri=OJ:L:2009:167:0012:0023:EN:PDF
[7] Council Directive (EC) 2001/21/EC on a common regulatory framework for electronic
communications networks and services (Framework Directive)
http://ec.europa.eu/information_society/policy/ecomm/doc/140framework.pdf
[8] Commission Decision of 4.3.2009 on the deletion of Article 7 of Decision 2007/53/EC relating to
a proceeding pursuant to Article 82 of the EC Treaty and Article 54 of the EEA Agreement against Microsoft Corporation and repealing Decision C(2005) 2988 final
http://ec.europa.eu/competition/antitrust/cases/dec_docs/37792/37792_4183_3.pdf
[9] Commission Communication (COM) 2012, 299 final; Action for stability, growth and jobs
http://ec.europa.eu/europe2020/pdf/nd/eccomm2012_en.pdf
[10] European Commission (2009), “eCommunications, Main elements of the reform”. Brussels, 5
November 2009.
[11] Commission Recommendation 2007/879/EC on relevant product and service markets within the
electronic communications sector susceptible to ex ante regulation in accordance with Directive 2002/21/EC of the European Parliament and of the Council on a common regulatory framework for electronic communications networks and services [2007] OJ L344/65
http://eur-lex.europa.eu/LexUriServ/LexUriServ.do?uri=OJ:L:2007:344:0065:0069:en:PDF
[12] Commission Recommendation 2010/572/EU on regulated access to Next Generation Access
Networks (NGA) [2010] OJ L251/35
http://eur-lex.europa.eu/LexUriServ/%20LexUriServ.do?uri=OJ:L:2010:251:0035:0048:EN:PDF
[13] Commission Communication 2009/C 235/04 Community Guidelines for the application of State
aid rules in relation to rapid deployment of broadband networks [2009] OJ C235/7 http://eur-lex.europa.eu/LexUriServ/LexUriServ.do?uri=OJ:C:2009:235:0007:0025:EN:PDF
[14] Commission Decision IP/06/1013 State aid: Commission prohibits public funding for additional
broadband network in Appingedam (Netherlands) [2006]
http://www.ivir.nl/dossier/breedband/IP-06-1013_EN%5B1%5D.pdf
[15] C. Mas Machuca. et al. (2012) “Cost-based assessment of NGOA architectures and its impact in
the business model.” CTTE conference, Athens, Greece.
[16] Bundesnetzagentur (2011) Pressemitteillung: Bundesnetzagentur gibt endgültige Genehmigung
der Entgelte für die „letzte Meile“ bekannt. 17/06/2011
[17] OPTA Besluit Wholesale Price Cap 2009-2011 (WPC-IIa besluit),. OPTA/AM/2009/203507,
December 16, 2009
[18] Reggefiber – Annex – Tarieven bij Overeenkomst inzakegebruik van passieve
glasvezel-aansluitnetwerken
[19] B. Felten, “Stockholm’s Stokab: A Blueprint for Ubiquitous Fiber Connectivity?” Diffraction Analysis, 2012.
[20] W. Burger, “The Reggefiber model. Key elements of Reggefiber’s strategy in the Netherlands”,
2012.
[21] H. Väätämöinen, “What Solution Providers need to know about FTTH?” Presentation of Draka at
the 5th BICSI Southeast Asia Conference, 2007.
[22] FTTH Council Europe, “FTTH Handbook”, 2012
[23] M. Tahon, J. Van Ooteghem, K. Casier S. Verbrugge, D. Colle, M. Pickavet, M., & P. Demeester, “Improving the FTTH business case - a joint telco-utility network rollout model, “
Telecommunications Policy, Submitted, 2012.
[24] A. Broberg, “Challenges for an open physical infrastructure provider”, workshop 11: FTTH and
open access networks: Technology, business and regulatory challenges, ECOC 2012, Amsterdam, the Netherlands, Sept. 2012.