SCIENCE & TECHNOLOGY
Journal homepage: http://www.pertanika.upm.edu.my/ISSN: 0128-7680 © 2017 Universiti Putra Malaysia Press.
Enhancement of DNA Microarray Images using Mathematical
Morphological Image Processing
Asral Bahari Jambek1*, Khairul Anuar Mat Said1* and Nasri Sulaiman2,3 1School of Microelectronic Engineering, Universiti Malaysia Perlis, Perlis, Malaysia
2Department of Electrical and Electronic Engineering, Faculty of Engineering, Universiti Putra Malaysia, 43400 UPM, Serdang, Selangor, Malaysia
3Institute of Advance Technology (ITMA), Universiti Putra Malaysia, 43400 UPM, Serdang, Selangor, Malaysia
ABSTRACT
DNA microarray images contain spots that represent the gene expression of normal and cancer samples. As there are numerous spots on DNA microarray images, image processing can help in enhancing an image and assisting analysis. The mathematical morphology is proposed to enhance the microarray image and analyse noise removal on the image. This follows an experiment in which the erosion, dilation, opening, closing, white top-hat (WTH) and black top-hat (BTH) operations were applied on a DNA microarray image and its results analysed. Noise was completely removed by the erosion operation and the images were enhanced.
Keywords: DNA microarray image, mathematical morphology, image enhancement
ARTICLE INFO
Article history:
Received: 24 August 2016 Accepted: 02 December 2016
E-mail addresses:
[email protected] (Asral Bahari Jambek), [email protected];
[email protected] (Khairul Anuar Mat Said), [email protected] (Nasri Sulaiman) *Corresponding Author
INTRODUCTION
Microarray technology is widely known for allowing scientists to analyse the gene expression. Furthermore, microarrays make it easier to compare between normal and cancerous cells. For this study, deoxyribonucleic acid (DNA) microarray
containing microscopic DNA spots were deposited on the surface of a glass slide. Firstly, two samples of cDNAs (normal and cancerous cells) were labelled with different
fluorescent dyes (Cy3 and Cy5) (Belean et al.,
2015; Helmy & El-taweel, 2013). Then, both samples were hybridized on the same glass slide. The glass slide was scanned using a green and red laser after the hybridization process was completed. A composite image was produced and the intensities of each spot were analysed. The sample that was labelled using Cy3 produced a green colour, while the sample labelled using Cy5 produced a red colour. If the two samples were in equal abundance, the yellow colour would have
Asral Bahari Jambek, Khairul Anuar Mat Said and Nasri Sulaiman
appeared; if neither sample was present, it would have appeared as a black colour (Qin et al., 2005). Therefore, the gene expression of the DNA microarray images can be monitored. The DNA microarray images may contain noises and contaminations arising from the scanning process or other previous process stages (Qin et al., 2005; Wang et al., 2013). These problems can affect the whole microarray image process. Thus, image processing is proposed as a means to minimize or eliminate such problems.
Microarray image processing contains the following three stages: (1) gridding, which is a process of segmenting the microarray image into partitions, with each partition having only one spot; (2) segmentation, which is a process of differentiating between the foreground and background features; and (3) intensity extraction, which is a process of calculating the intensity that is available on the image (Harikiran et al., 2012; J et al., 2011). The noises on the microarray image are a major problem during the entirety of image processing. Some of them may generate wrong information about the gene expression. Besides, missing spots on
the microarray image may also appear. Thus, the process of spot recognition is a difficult as
the microarray image consists of noises that interrupt the image acquisition (J et al., 2013). It is more convenient if the noise is removed or minimized early. Image enhancement is an important method because it can recover several useful details of the image (Bai et al., 2012).
In this paper, mathematical morphological image processing was performed on a DNA microarray image and analysed. The operations were programmed using the MATLAB software; the output image for each operation is discussed. In the literature review several applications that have used mathematical morphology in image processing are presented, and followed by an explanation of the methodology adopted. The section on result and discussion all the experimental results are discussed, and followed by the conclusion.
LITERATURE REVIEW
Mehta et al. (2015) proposes the combination of pre-processing morphology and entropy calculation to enhance the ultrasound images of the gall bladder. The ultrasound images are
first converted into greyscale and then into a black and white image using a threshold filter.
The threshold value of this work is set at 0.18. By converting the image into a black and white able to distinguish between the foreground and background features. The erosion and dilation operations are used to improve the clarity of the image, in which the erosion shrinks the foreground features, while the dilation enlarges the foreground features. Results show the ultrasound image clearly shows the location of the gallstone and is better than the input image.
Mittal & Dubey (2013) proposes using morphological image processing for early detection
of rheumatoid arthritis (RA). This disease is commonly caused by inflammation in the joints, fingers and knees. The erosion process shrinks the foreground features of the image, while the
dilation process enlarges the foreground features of the image. Both processes use the same structuring element (SE) as a probe, while showing that morphological image processing provides a better understanding of the ultrasound image and monitoring of RA.
Yuan & Li (2015) demonstrates a switching morphological and median (SMM) filter for
noise removal. Morphological operations, such as erosion, dilation, opening and closing, are applied in order to eliminate the noise. The noise pixel can be estimated by combining the output
41 Pertanika J. Sci. & Technol. 25 (S): 39- 48 (2017)
of the conditional morphological filter with that of the improved median filter. This method
produces higher peak signal-to-noise ratio (PSNR) values compared to boundary discriminative noise detection (BDND), fast switching median (FSM), convolution noise detection-based
switching median (CNDSM), opening-closing sequence (OCS), efficient edge-preserving (EEP) and noise adaptive fuzzy switching median (NAFSM) filters. Based on the result, the
proposed method removes the noise effectively and the details of the image are well preserved. Rong-yu et al. (2012) are concerned with observing space objects using a full-frame transfer CCD camera to detect and locate stars and moving objects in space. During the observation, the CCD images that are produced contain a smearing effect because the camera
shutter is often removed. The effect degrades the image quality and increases the difficulty
of object recognition. The author proposes mathematical morphology in order to eliminate the smearing effect as well as improve the detection rates and position accuracies of stars and
moving objects. The dilation operation filters the maximum value depending on the structural body. The erosion operation filters the minimum value depending on the structural body. The
opening operations eliminate the bright details that reduce the size of a structural body. The closing operation eliminates the dark details that reduce the size of an SE. This paper uses TopHat and Spread TopHat methods to remove the long-strip signals in the CCD image. The structural body plays an important role in morphological results, such that different structural bodies give different results. Results show mathematical morphology improves the detection rate and position accuracies of stars and moving objects by eliminating the smearing effect.
Zhang et al. (2011) proposes using an improved morphological edge detection method for an edge detection operator and an iterative thresholding method for a better thresholding
value in order to identify foreign fibres in cotton products. Dilation and erosion algorithms
are used in the edge detection operator. Each colour (R, G and B) is then taken into account in the image, while the improved morphological edge detection consists of the edge detection for each colour, which is called the edge intensity value; if the value of it is greater than the given threshold, it is considered as edge pixels from the image. Therefore, the iterative method is a method to select the threshold value automatically because different situations lead to different light intensities. Based on the result, the proposed methods provide a better
accuracy for the segmentation of foreign fibres and improve the processing time compared to
conventional methods.
Mathematical morphological image processing operations helps to enhance the features on the image. Different applications will use different operations of mathematical morphology. Table 1 shows the comparison between different applications that apply mathematical
morphological operation, which will be discussed later. Yuan & Li (2015) uses the SMM filter
to determine the noise pixels in relation to the removal process. TopHat and Spread TopHat transforms in method (Rong-yu et al., 2012) are discussed, in which the smearing effect may be eliminated by choosing suitable SEs. Zhang et al. (2011) uses a combination of morphological edge detection and iterative thresholding to improve the segmentation process in order to
identify foreign fibres in cotton. From the five applications, it can be seen that mathematical
morphological operations may enhance the image and preserve image information well. In the next section, the experiment undertaken in this work is presented.
Asral Bahari Jambek, Khairul Anuar Mat Said and Nasri Sulaiman
42 Pertanika J. Sci. & Technol. 25 (S): 39 - 48 (2017) METHODOLOGY
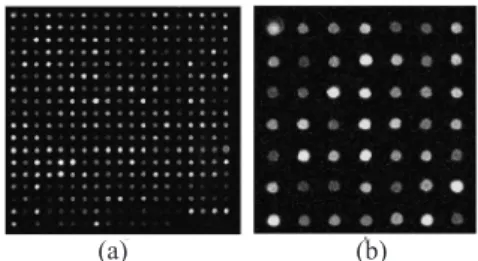
This section discusses mathematical morphological image processing of microarray image (Microarrays Inc., 2016). The mathematical morphological process is programmed using the MATLAB software. Figure 1(a) shows a part image with a size of 441×431 pixels, compared with the real microarray image of 2200×7300 pixels, which is used as the input image for this work. Figure 1 (b) shows the SE that is used as a probe for mathematical morphology. An SE of a disk shape, with a radius of four pixels, is chosen as the input image to be used, containing DNA spots, which are generally in circle shape. Therefore, the disk shape in structuring is used to produce similarity with the information interest on the input image. The spots on the input image provide the important information, so that the SE of mathematical morphology may enhance the spots area that forms the background. The size of the SE depends on the spot size. In this work, the radius of four pixels is chosen because the average size (diameter) of the spots on the input image is 8~9 pixels.
Table 1
Comparison of different applications Method (Mehta et al.,
2015) (Mittal & Dubey, 2013) (Yuan & Li, 2015) (Rong-yu et al., 2012) (Zhang et al., 2011)
Application Medical Medical Case study Astronomy Agriculture
Type of image Colour Greyscale Greyscale Greyscale Colour
Threshold Yes No No No Yes
Accuracy N/A N/A N/A N/A N/A
Complexity Low Low Normal Normal Normal
Special feature N/A N/A SMM TopHat and
Spread TopHat Morphologicaledge detection and iterative thresholding
441×431 pixels, compared with the real microarray image of 2200×7300 pixels, which is used as the input image for this work. Figure 1 (b) shows the SE that is used as a probe for mathematical morphology. An SE of a disk shape, with a radius of four pixels, is chosen as the input image to be used, containing DNA spots, which are generally in circle shape. Therefore, the disk shape in structuring is used to produce similarity with the information interest on the input image. The spots on the input image provide the important information, so that the SE of mathematical morphology may enhance the spots area that forms the background. The size of the SE depends on the spot size. In this work, the radius of four pixels is chosen because the average size (diameter) of the spots on the input image is 8~9 pixels.
Figure 1. (a) Input image of a 441×431 pixels region from a real microarray image of 2200×7300 pixels; (b) the SE of a disk shape with a radius of four pixels.
Asral Bahari Jambek, Khairul Anuar Mat Said, Nasri Sulaiman
Figure 1. (a) Input image of a 441×431 pixels region from a real microarray image of 2200×7300 pixels; (b) the SE of a disk shape with a radius of four pixels
DNA Microarray Images Processing using Morphological
43 Pertanika J. Sci. & Technol. 25 (S): 39- 48 (2017)
Mathematical Morphological Image Processing
Mathematical morphological image processing
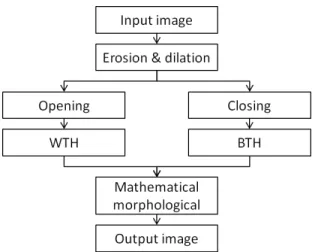
Figure 2. The flowchart of mathematical morphological image processing.
Figure 2 shows the flowchart of mathematical morphological image processing where the basic process is erosion and dilation. Erosion is a process of removing the foreground features of an image, while dilation is a process of adding the foreground features on the image. Both the erosion and dilation processes depend on the SE. Opening is a process to remove the foreground objects that are smaller than the SE. Closing is a process of removing the background objects that reduce the SE. Both opening and closing control the uses of erosion and dilation to enhance the foreground and background features. During the opening, the input image (IM) will undergo erosion first, followed by dilation. Meanwhile, in dilation, the IM will undergo dilation first, followed by erosion. The major process of mathematical morphology involves the white top-hat (WTH) and the black top-hat (BTH). The WTH enhances the foreground features on the image in line with the different results obtained
Figure 2. The flowchart of mathematical morphological image processing
Figure 2 shows the flowchart of mathematical morphological image processing where the basic
process is erosion and dilation. Erosion is a process of removing the foreground features of an image, while dilation is a process of adding the foreground features on the image. Both the erosion and dilation processes depend on the SE. Opening is a process to remove the foreground objects that are smaller than the SE. Closing is a process of removing the background objects that smaller than the SE. Both opening and closing control the uses of erosion and dilation to enhance the foreground and background features. During the opening, the input image (IM)
will undergo erosion first, followed by dilation. Meanwhile, in closing, the IM will undergo dilation first, followed by erosion. The major process of mathematical morphology involves
the white top-hat (WTH) and the black top-hat (BTH). The WTH enhances the foreground features on the image in line with the different results obtained between the IM and the opening operation. BTH enhances the background features of an image giving results that differ from the closing operation and the IM. Mathematical morphology is the result of the IM added to the WTH, then subtracted from the BTH. The opening, closing, WTH, BTH and overall operations
are defined as follows (Li et al. 2015):
(1) (2) (3) (4)
Asral Bahari Jambek, Khairul Anuar Mat Said and Nasri Sulaiman
44 Pertanika J. Sci. & Technol. 25 (S): 39 - 48 (2017)
(5)
where and respectively denote the erosion process and the dilation process.
RESULTS AND DISCUSSION
In the previous section, the mathematical morphological algorithm was presented. The algorithm was run on the input image as shown in Figure 1(a) using the SE shown in Figure 1 (b). In this section, the experimental result for each process in the mathematical morphological operation will be presented. All the workings are performed using the MATLAB software running on the Windows operating system. Firstly, the input image will convert into the greyscale image, as shown in Figure 3 (a). The image result for each operation is zoomed in with 161×166 pixels, which contain 7×7 spots for ease of analysing and understanding each operation, as shown in Figure 3 (b).
operation is zoomed in with 161×166 pixels, which contain 7×7 spots for ease of analysing and understanding each operation, as shown in Figure 3 (b).
Figure 3. (a) The greyscale image of the input image; (b) the rescale input image consists of 7×7 spots.
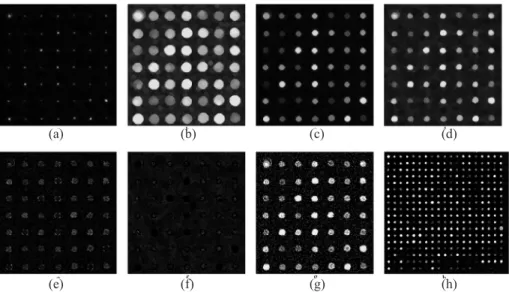
Figure 4. (a) The result of the erosion operation; (b) the result of the dilation operation; (c) the result of the opening operation; (d) the result of the closing operation; (e) the result of the WTH operation; (f) the result of the BTH operation; (g) the result of the mathematical morphological
operation; (h) the final result of the full scale of the input image.
Opening, closing, Erosion and dilation operations
Asral Bahari Jambek, Khairul Anuar Mat Said, Nasri Sulaiman
Figure 3. (a) The greyscale image of the input image; (b) the rescale input image consists of 7×7 spots Opening, Closing, Erosion and Dilation Operations
The erosion operation shrinks the foreground features depending on the SE, as shown in Figure 4 (a). Based on the result, the spots (foreground features) on the image shrink due to the erosion operation. The shrinking causes a decrease in the foreground area compared to the input image. At this point, the noises that are smaller than the SE are completely removed. Besides, the spots that are smaller than the SE can also be removed, so selecting the appropriate size of the SE is important for this operation. The dilation operation enlarges the foreground features depending on the SE, as shown in Figure 4 (b). Based on the result, the spots (foreground features) on the image become larger due to the dilation operation. The enlargement causes a decrease in the background area compared to the input image. At this point, the noises are also enlarged with the spots which might combine with other foreground features if the size of the SE is too large.
In the opening and closing operations, opening is a process to remove the foreground objects that are smaller than the SE while closing is a process of removing the background objects that are smaller than the SE. From the result in Figure 4 (c), it shows that the opening operation removes the foreground object that is smaller than the SE compared to the input image. Based on the result, the opening operation is generally run as the dilation operation on the image result from the erosion operation in Figure 4 (a). From the erosion operation, the foreground object that is smaller than the SE is already removed. Thus, the opening operation is
DNA Microarray Images Processing using Morphological
45 Pertanika J. Sci. & Technol. 25 (S): 39- 48 (2017)
the result of the enlargement of the foreground object that remains after the erosion operation. The opening operation follows the mathematical theoretical state, as given at (1).
The result in Figure 4 (d), shows that the closing operation removes the background object that is smaller than the SE compared to the input image. Based on the result, the closing operation is generally run alongside the erosion operation on the image resulting from the dilation operation in Figure 4 (b). From the dilation operation, the foreground features are enlarged, with some of them combining with other spots or noises. Thus, the closing operation is the result of shrinking the foreground object on the image resulting from the dilation operation. The closing operation follows the mathematical theoretical state given at (2).
Mathematical Morphological, WTH and BTH Operations
Next, the major operations in mathematical morphology take place, which concern the WTH and the BTH. The WTH is the difference between the input image and the opening operation result, as stated in (3). Based on the result in Figure 4 (e), the pixel in the remaining in the foreground is better than the image of the opening operation. The BTH is the difference between the closing operation result and the input image, as stated in (4). Based on the result in Figure 4 (f), the foreground features that remain are the exceeded pixels in the foreground on the image result from the closing operation compared to the input image. Finally, from the result of the WTH and the BTH, the enhancement of the image can be produced. The mathematical morphological operation is a process where the input image is added to the image produced from the WTH operation which is then subtracted with the image result from the BTH operation, as stated in (5). Based on the result in Figure 4 (g), the image becomes sharper and clearer compared to
the input image. Figure 4 (h) shows the final result of mathematical morphology on the
full-scale input image (Figure 3 (a)).
operation is zoomed in with 161×166 pixels, which contain 7×7 spots for ease of analysing and understanding each operation, as shown in Figure 3 (b).
Figure 3. (a) The greyscale image of the input image; (b) the rescale input image consists of 7×7 spots.
Figure 4. (a) The result of the erosion operation; (b) the result of the dilation operation; (c) the result of the opening operation; (d) the result of the closing operation; (e) the result of the WTH operation; (f) the result of the BTH operation; (g) the result of the mathematical morphological
operation; (h) the final result of the full scale of the input image.
Opening, closing, Erosion and dilation operations
Figure 4. (a) The result of the erosion operation; (b) the result of the dilation operation; (c) the result of the opening operation; (d) the result of the closing operation; (e) the result of the WTH operation; (f) the result of the BTH operation; (g) the result of the mathematical morphological operation; (h) the final result of the full scale of the input image
(a) (b) (c) (d)
operation is zoomed in with 161×166 pixels, which contain 7×7 spots for ease of analysing and understanding each operation, as shown in Figure 3 (b).
Figure 3. (a) The greyscale image of the input image; (b) the rescale input image consists of 7×7 spots.
Figure 4. (a) The result of the erosion operation; (b) the result of the dilation operation; (c) the result of the opening operation; (d) the result of the closing operation; (e) the result of the WTH operation; (f) the result of the BTH operation; (g) the result of the mathematical morphological
operation; (h) the final result of the full scale of the input image.
Opening, closing, Erosion and dilation operations
Asral Bahari Jambek, Khairul Anuar Mat Said and Nasri Sulaiman CONCLUSION
This paper shows the mathematical morphological image processing has better enhancement of the microarray image. The erosion and dilation are the fundamental operations to the mathematical morphology, while the opening and closing operations to enhance the foreground and background features, respectively. Lastly, the mathematical morphological operation produces the enhancement image by adding the input image and the WTH image, and then subtracting the BTH image. The results show the mathematical morphological image processing compared to the input image. Besides, during the erosion operation, the noises are completely removed.
ACKNOWLEDGEMENT
This research was supported by the Science Fund 2015 from the Ministry of Science, Technology and Innovation (MOSTI), Malaysia.
REFERENCES
Bai, X., Zhou, F., & Xue, B. (2012). Image enhancement using multi scale image features extracted by top-hat transform. Optics and Laser Technology, 44(2), 328–336.
Belean, B., Terebes, R., & Bot, A. (2014). Low-complexity PDE-based approach for automatic microarray image processing. Medical and Biological Engineering and Computing, 53(2), 99–110.
Harikiran, J., NarasimhaRao, Y., Saichandana, B., Lakshmi, P. V., & Kiran Kumar, R. (2012). Spot Edge Detection in Microarray Images Using Bi-Dimensional Empirical Mode Decomposition. Procedia Technology, 4, 227–231.
Helmy, A. K., & El-Taweel, G. S. (2013). Regular gridding and segmentation for microarray images.
Computers and Electrical Engineering, 39(7), 2173–2182.
J, N., Rangarajan, L., S.S, M., & .N, H. K. (2011). Application of Mathematical Morphology for the Enhancement of Microarray Images. International Journal of Advances in Engineering & Technology, 1(5), 329–336.
J, N., S, M. S., & Pradeep, D. (2013). A Fully Automatic Approach for Enhancement of Microarray Images. Journal of Automation and Control Engineering, 1(4), 285–289.
Li, N., Jia, L., & Zhang, P. (2015). Detection and volume estimation of bubbles in blood circuit of hemodialysis by morphological image processing. In Proceedings of the 2015 7th IEEE International Conference on Cybernetics and Intelligent Systems, CIS 2015 and Robotics, Automation and Mechatronics, RAM 2015 (pp. 228–231).
Mehta, N., Arya, L., & Pant, M. (2015). A Novel Approach for the Analysis of US Images. Computing for Sustainable Global Development (INDIACom), 2015 2nd International Conference, 868–872. Microarrays Inc. (2016). Expert Laboratory Services. Retrieved February 19, 2016, from http://www.
47 Pertanika J. Sci. & Technol. 25 (S): 39- 48 (2017)
Mittal, A., & Dubey, S. (2013). Analysis of MRI images of Rheumatoid Arthritis through morphological image processing techniques. International Journal of Computer Science Issues, 10(2), 118–122. Qin, L., Rueda, L., Ali, A., & Ngom, A. (2005). Spot detection and image segmentation in DNA
microarray data. Applied Bioinformatics, 4(1), 1–11.
Rong-Yu, S., Chang-Yin, Z., Yi-ding, P., Jian-Ning, X., & Chen, Z. (2012). Use of Mathematic Morphological Operators for Processing the Smeared Images of A Camera without Shutter. Chinese Astronomy and Astrophysics, 36(3), 340–352.
Wang, Z., Zineddin, B., Liang, J., Zeng, N., Li, Y., Du, M., … Liu, X. (2013). A novel neural network approach to cDNA microarray image segmentation. Computer Methods and Programs in Biomedicine, 111(1), 189–198.
Yuan, C., & Li, Y. (2015). Switching median and morphological filter for impulse noise removal from
digital images. Optik, 126(18), 1598–1601.
Zhang, X., Li, D., Yang, W., Wang, J., & Liu, S. (2011). A fast segmentation method for high-resolution