A GRAPH DATABASE WITH VISUAL QUERIES FOR GENOMICS
GREG BUTLER∗, GUANG WANG, YUE WANG, LIQIAN ZOU Department of Computer Science and Software Engineering,
Concordia University, 1455 de Maisonneuve Blvd. West, Montr´eal, Qu´ebec, Canada, H3G 1M8
Email: gregb, gwang 1, wang yue, l [email protected]
Effective management of data is a major issue in genomics. Genomics data consists of highly inter-related information about genes, proteins, patterns, classifications, and interactions. Graph databases, which model graphs or networks of data, seem a natural way to manage genomics data. Graph databases can support visualization of both queries and results by drawing on the broader field of graph visualization, and the visual paradigm is natural for scientists working in genomics. We have constructed a graph database system that supports visual queries and visualization of query result sets. Our system uses Java, XML, C++, CORAL, and MySQL to implement the GraphLog language. We have validated its applicability to genomics data through a case study, and have done initial studies on the systems performance and the effect of several optimization strategies. We describe the system and its application to genomics.
1. Introduction
Biology has become a discipline that generates large volumes of data. At first the focus was on DNA sequences. The genome projects were designed to generate a large volume of sequence data, which, of course, needed storage and analysis. However, now, genomics also studies gene expression and gene function. The functions of genes are highly inter-related since the activity of a cell and an organism is achieved by a series of reactions forming a biochemical pathway, or indeed networks of pathways.
Due to the vast datasets that have been generated by genomics projects, data man-agement, fast access and data mining are at the heart of bioinformatics. While relational databases are widely applied within the industry, there has been considerable research into deductive and graph databases to extend the capabilities of relational databases.
Deductive databases allow a view to be defined using logical rules, and allow logical queries against the view. Since the rules allow recursive definitions, the resulting expressive power of the query language is greater than the relational query languages. Graph query languages are even more expressive, and provide a visual representation. Diagrams are an intuitive way for scientists to pose queries to relational, object-relational, and object ∗This work has been supported by NSERC of Canada. The Centre for Structural and Functional Genomics at Concordia University provides the genomics focus for our work in bioinformatics.
databases. They allow the full range of queries, from the very simple to the very complex, to be more easily expressed and understood than SQL-like languages or form-based queries, which are less intuitive to scientists. Diagrammatic queries are particularly appropriate for interactions as found in databases for metabolic pathways, protein-protein interactions, and gene regulations.
Our desire is to apply the benefits of deductive query language, diagrammatic queries, and visualization of results more broadly in genomics. We use Java to implement the interface to allow scientists to construct diagrams to express the query, which shows the entities of their interest and the relationships among these entities. The supported graphical query language we are implementing is GraphLog.1The query result set is also visualized as diagrams with the same icon and style as in the query. The system uses CORAL,2a
deductive database management system as its database engine. Our database manages the translation from a query diagram to a textual CORAL query program. The raw data are stored in a MySQL3relational database.
The rest of this paper is organized as follows: Section 1.1 describes our case study in genomics. Section 2 introduces the related work. Section 3 presents a detailed description of our database system architecture, its data model, the visual query formulation mecha-nism, the translation undergoing for a query diagram, and the visualization of query results. Section 4 concludes the paper.
1.1. A Genomics Case Study
The case study database captures the whole-genome DNA sequence assembly data from A. nidulans as well as the annotation and analysis of these DNA sequences. Aspergillus nidu-lans (AN) is one of the critical fungal systems in genetics and cell biology. Spontaneous and induced mutations have been generated in hundreds of its genes, which is of great value because mutation analysis helps to identify gene function and to characterize the biologi-cal roles of protein products. Aspergillus nidulans has a well-characterized, conventional genetic system. This fungus has also been used to express mammalian genes. The entire Aspergillus nidulans genome4is approximately 31 MB, organized in 8 chromosomes. It contains estimated 11,000–12,000 genes. We have stored 9541 distinguished Aspergillus nidulans gene sequences, 248 contigs, 89 scaffolds (supercontigs), and 5152 identified pro-teins that are annotated by PFAM protein domain descriptions.
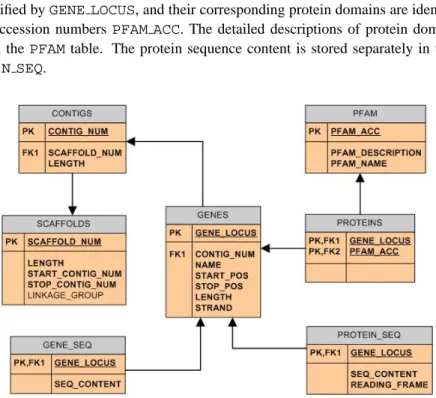
Figure 1 shows the schema of the genomic database. Each rectangle corresponds to a table in MySQL. The header of the box is the name of the table in the database. The attribute names are listed out below the header. The symbolsPKandFKstand for primary key and foreign key respectively. The data types of the attributes are hidden due to space limitations. The arrows point to a foreign key’s referred table.
Briefly, the scaffolds for an assembly identified by theSCAFFOLD NUMare stored in the tableSCAFFOLDS. Contigs that make up a scaffold are stored in the tableCONTIGS, and are identified by a unique contig number. The genes identified byGENE LOCUSare stored in theGENEStable. However, this table does not include the gene sequence content, as the average gene length is about 2800 characters long. A separate table GENE SEQ
stores the gene sequence content. Proteins are identified by their encoding genes which are identified byGENE LOCUS, and their corresponding protein domains are identified by PFAM accession numbersPFAM ACC. The detailed descriptions of protein domains are stored in thePFAMtable. The protein sequence content is stored separately in the table
PROTEIN SEQ.
Figure 1. Data model for the case study
The relational database schema is mapped to CORAL relations and the relational database instances are mapped to CORAL ground facts. The corresponding CORAL rela-tions are as follows:
SCAFFOLD(SCAFFOLD_NUM,LENGTH,START_CONTIG_NUM,STOP_CONTIG_NUM) CONTIG(CONTIG_NUM,LENGTH,SCAFFOLD_NUM) GENE(GENE_LOCUS,NAME,CONTIG_NUM,START_POS,STOP_POS,LENGTH,STRAND) GENE_SEQ(GENE_LOCUS, SEQ_CONTENT) PFAM(PFAM_ACC,PFAM_DESCRIPTION,PFAM_NAME) PROTEIN(GENE_LOCUS,PFAM_ACC) PROTEIN_SEQ(GENE_LOCUS,SEQ_CONTENT,READING_FRAME)
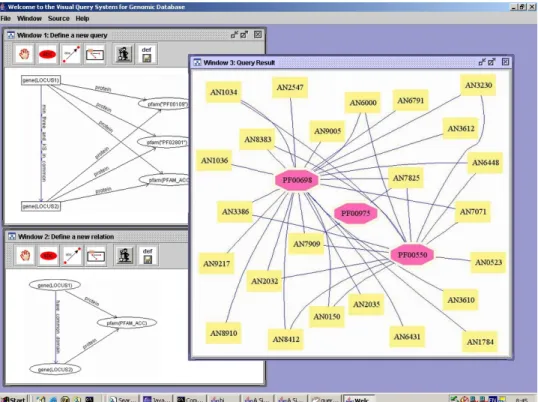
Given a relational database, the system allows the user to browse the schema, create views of the database, to ask queries utilizing the database relations and the view rela-tions, and then to visualize the results. Figure 2 shows three windows: the definition of a new relation, a query, and the visualization of the query results. The example consid-ers multi-domain proteins which are involved in the biosynthesis of fatty acids, polyke-tides. One such protein contains a beta-ketoacyl-synthase (KS) domain, which corre-sponds to two PFAM entries PF00109 and PF02801. The user defines a new relation called “have common domain” in the bottom-left window to illustrate how to specify that two
Figure 2. System Screenshot
genes have a common PFAM domain. The relation “three domains in common” could be defined similarly by listing three separate nodes for PFAM domains. In the query, shown in the upper-left window, such a definition is modified to show two nodes for specific PFAM domains, and one node for an unspecified domain. The query is to return all the genes that have at least three common PFAM domains, and two of these three common PFAM domains must be the KS domains PF00109 (KS-N, the beta-ketoacyl synthase, N-terminal domain) and PF02801 (KS-C, the beta-ketoacyl synthase, C-terminal domain). In the re-sults shown in the right window, the three pink octagons represent three different PFAM domains. They are PF00698 (AT, the acyl transferase domain); PF00550 (PP,the phospho-pantetheine attachment site); and PF00975 (TE, the thioesterase domain). The light yellow rectangles represent genes.
This visual representation clearly shows that besides having the two domains PF00109 (KS-N) and PF02801 (KS-C) stipulated in the query: (1) All, except gene AN0523, also have the PFAM domain PF00698 (AT); (2) Only two genes (AN7909 and AN7825) have the PFAM domain PF00975 (TE); and (3) There are 11 genes that have KS-N, KS-C and AT in common but do not have the PFAM domain PF00550 (PP). The results strongly suggest that gene AN7909 and gene AN7825 appear at the final step of the polyketide synthesis process since a thioesterase cleaves a polyketide from a phosphopantetheine attachment
site. Furthermore, we should investigate whether the absence of the domain PF00550 in the other genes (AN1036, AN1784, AN2035, AN2547, AN3610, AN3612, AN6431, AN6791, AN8910, AN9005, AN9217) is simply the incompleteness of the database (and search for the coordinates where PF00550 is likely located) or whether they have some new domain or protein that plays a similar role to that of domain PF00550.
2. Related Work
The state of bioinformatics databases can be surmised from several sources, notably the ar-ticle by Frishman et al,5the January issue of Nucleic Acids Research journal, and the online catalogue DBcat (http://www.infobiogen.fr/services/dbcat/) of over 500 bioinformatics-related databases. About 80% of bioinformatics databases are flat text files, 5% use re-lational databases, and 12% use object-based systems, primarily the AceDB system. Her-man et al6surveys visualization techniques, while Batini et al7is a (dated) survey on visual
query languages.
The research group of Alberto Mendelzon at the University of Toronto developed the GraphLog1graph query language based on hygraphs, and a visual interface, called HY+, for expressing queries and browsing their results. GraphLog is a graph query language extending Datalog and negation. The language has recursion, usually as transitive closure, and has path expressions. Path expressions are similar to regular expressions. A path expression can refer to a primitive relation, or construct more complex path expressions using the operators of negation/complement, inverse, concatenation, alternation, kleene closure (*), or transitive closure (+). GraphLog is more expressive than Datalog (and SQL). HY+ is closely related to our work. It supports GraphLog visual queries and results visualization. HY+ was implemented in SmallTalk and translates GraphLog into a CORAL query program. HY+ does not use a database to load the data (ground facts) into CORAL program’s workspace. The legacy Smalltalk system is not portable. It does not utilize the query optimization strategies in CORAL; and it has not been applied to genomics.
There are several projects that study graph databases for genomics. Biopathways Graph Data Manager (BGDM) (http://pueblo.lbl.gov/˜olken/graphdm/graphdm.htm) sup-ports biopathways and protein interaction network databases for microbial organisms. GEODE8is a graph database which enables biologists to search human genome sequence alignment relationships for patterns of functional and structural relationships between genes. The GGL language9represents genome data as a graph, where vertices represent the concepts and relationships of genetics, and edges describe the connections between them. However, none of these genomic graph databases has a visual query mechanism.
Transparent Access to Multiple Bioinformatics Information Sources (TaMBIS)10 is a
front-end to a heterogeneous database management system. It provides a form-based ontol-ogy browser to guide the user to formulate biologically-appropriate queries. The TaMBIS Ontology (TaO) is a conceptual representation of biological concepts and terminology. It is not a graph database and the query results are not visualized, but are presented to the user as text in a Web browser.
3. A Tour of Our System
In this section, we will have a tour of our graph database. We introduce the system archi-tecture and the major components, then we discuss how to formulate a diagrammatic query, how a query is processed, and how the results are visualized.
3.1. System Architecture
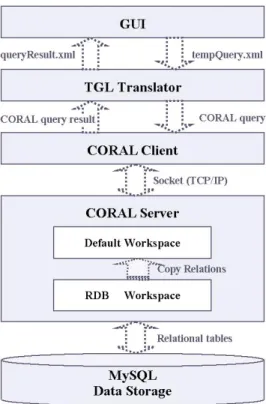
Our system has five layers, as shown in Figure 3: GUI, TGL Translator, CORAL Client, CORAL Server and MySQL Data Storage. The description of responsibilities for each layer follows.
Figure 3. System architecture
GUI: The GUI is the system’s interface to end-users. End-users may draw a query in the query editor. The GUI component translates user’s query that is defined as a diagram into XML format and send it to the next layer of the system: TGL Translator. TGL (Transferable Graphic Language) is an XML format that defines the communication protocol between GUI layer and TGL translator layer. The GUI is also responsible to visualize the query result set into a graph.
XML formatted query, which it receives from the GUI layer, to a CORAL query program. A set of translations rules is defined in the TGL translator to regulate the translation from an XML formatted query to a CORAL program. The TGL translator calls up the CORAL client. The TGL translator is also responsible to transform the CORAL query result into XML and pass the XML-format query result to the upper GUI layer.
CORAL Client: The CORAL client is responsible for two tasks: one is to receive a query plan from the TGL translator and to send the CORAL query programs in the query plan to the CORAL Server; the other is to receive the query result from the CORAL server, and pass it to the TGL translator.
CORAL Server: During the CORAL server initialization, two workspaces, the default workspace and the RDB workspace, are created to collaboratively manage incoming and outgoing data. The default workspace is responsible for maintaining CORAL’s relations and executing queries. The RDB workspace is in charge of connecting with MySQL and manipulating relational data. At the RDB workspace, a dictionary describing the mapping between relational tables in MySQL and corresponding relations in the CORAL database is constructed first. Then the data in the relational tables are loaded into CORAL’s default workspace according to this dictionary. A CORAL program sent by a CORAL client is evaluated and executed in the CORAL server and the query result is returned to the CORAL client.
MySQL Data Storage: The data is stored physically in a MySQL database. The conventional data manipulations can be performed on data in MySQL. During the CORAL server initialization, the connection between MySQL and CORAL is set up, all the stored tuples in the target database are loaded into the CORAL server’s computer main memory as a runtime database for the CORAL system.
3.2. Query Formulation
The end users only deal with a graphical user interface where they can draw a database query by dragging-and-dropping inside the graph query editor (see Figure 2 and Figure 4). The query interface imports the database schema. A query, which consists of nodes and edges that connect nodes, is constructed by selecting an appropriate mode in the control panel. A mouse-click on the query editor under create a node will create a node with a circle and a machine-generated identifier. An edge has a direction. Under create an edge mode, the first mouse-click will locate the source node, and the second mouse-click will locate the destination node. To change the properties of a node, such as its label, its shape and or label position, the mouse has to be under select a node mode to open a node property dialog window. Similarly one can change the properties of an edge.
A node may represent an abstract entity class in the database or a “ground” symbol (an attribute’s atomic value). An edge is to represent the relationship between entity classes and “ground” symbols. The legal edge names between two abstract entity classes are those available relation names in the database. The legal edge names between an abstract entity class and a “ground” symbol can be arbitrarily named.
nodes/edges define the query constraints. The distinguished nodes/edges define what to retrieve as the query result. The distinguished nodes that will appear in the query result have to be rectangles. The content nodes that assist formulating the query context are ovals. The distinguished edges need to be in blue color. The content edges that assist formulating the query context are in default black color.
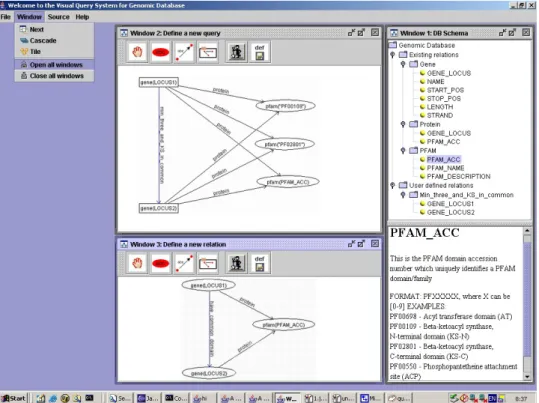
Figure 4. Formulating a View and a Query
Figure 4 shows the formulation of a query in terms of a view definition (a new relation) and then the query itself. This is the same query as in Figure 2. The existing relations in CORAL’s workspace and any possible user-defined relations can be displayed in a tree hierarchy (top-right window). The tree nodes are clickable. Once an intermediate node or a leaf is selected, the detailed information for the relation or for a entity is displayed (bottom-right window). The view (bottom-left window) shows how to define a new rela-tion “have common domain” between genes which have a common PFAM domain. This example could be extended to have three (unspecified) PFAM domains to define a rela-tion “min three domains in common”, however, the result set is large. The query shown in the upper-left window retrieves all the genes that share the same three PFAM families where two of them are specified to be KS domains: PF00109 (Beta-ketoacyl synthase, N-terminal domain) and PF02801 (Beta-ketoacyl synthase, C-N-terminal domain). The edge for
min three and KS in commonis highlighted with blue color to distinguish this edge from other edges.
3.3. Translation of Queries
The translation of the query diagrams takes place in two phases: one is from a diagrammatic query to an XML representation, and the other one is from an XML representation into a CORAL query program.
The transformation from a diagrammatic query into XML format is straightforward. Both nodes and edges are modeled as objects in the system. The XML presentation of the query captures only the content of the query diagram, i.e. the nodes and the relationships between nodes, but not the layout positions of nodes or edges. This XML representation of the query diagram also groups the distinguished nodes and the distinguished edges under one parent element<distinguished-show>. The nodes and edges under this element are meant to be present in the query result.
A query diagram is assigned an unique identifier in the<id>element.
For a node, the<id>element contains the node’s identifier, which is assigned by the system. The<entity>element encapsulates the entity class’s name with<name> ele-ment and the entity class’s attribute(s) of interest with<field>element. The<entity>
element for a “ground” symbol has only<name>to capture an attribute value.
Similarly, for an edge, the<id>element captures the edge’s system-assigned identi-fier. The label of an edge, which corresponds to a relation in the database, is captured in the<predicate>element. The source and destination node IDs for an edge are also recorded.
The transformation of a query from a diagram to XML representation is a process of depicting the query diagram in format of XML with pre-defined tags. The structure of an XML representation for a query diagram follows the Transferable Graphic Language (TGL) schema. The TGL translator11 builds up a mapping between an XML document
that conforms to the TGL schema and a CORAL program.
3.4. Visualization of Query Results
The query result computed by CORAL is in textual format. The TGL translator transforms it into XML. The query result in XML may contain the “ground” symbols, i.e. the returned attribute values, and relationships between these symbols. This information is extracted and visualized as a query result graph. To visualize the query result, we use an open source graph drawing software Graphvizfrom AT&T Research Lab. Since the query result computed by CORAL has only the content for nodes and relationships among nodes, the GUI takes no assumption about the initial position of nodes.
4. Conclusion and Future Work
In this paper, we have provided a detailed description of our graph database that manages genomics data. It is a database that supports visual queries and visualization of query
result sets. We have described our data model, our system architecture, the visual query formulation process, the translation of queries from a query diagram to CORAL program, and the visualization of query results. The system is implemented end-to-end from query construction through query execution to result visualization. Due to space limitations we do not report the results12on performance here. The use of the optimization strategies in CORAL is important, though the best choice of strategy is not uniform across queries.
The capabilities of the system will be expanded to include all features of GraphLog. Currently simple diagrammatic Graphlog queries such as selection, projection, queries with negation, and recursive queries can be handled by the system. We must in future support blobs, since they help to modularize queries, and guide orthogonal visual layout of results. We also wish to explore 3-dimensional visualizations, and to enrich the complexity of our genomic database to include tree hierarchy data such as the Gene Ontology and networks for metabolic pathways and protein-protein interactions.
References
1. M. P. Consens, F. Ch. Eigler, M. Z. Hasan, A. O. Mendelzon, E. G. Noik, A. G. Ryman, D. Vista. Architecture and Applications of the Hy+ Visualization System. IBM Systems Journal, vol 33, no. 3, pp. 458–476, 1994.
2. R. Ramakrishnan, D. Srivastava, S. Sudarshan, P. Seshadri. The CORAL Deductive System. VLDB Journal, vol 3, no. 2, pp. 161–210, 1994.
3. M. Widenjus, D. Axmark. MySQL Reference Manual, O’Reilly & Associates, Inc., June 2002. 4. Aspergillus Sequencing Project. Center for Genome Research. http://www.broad.mit.edu 5. D. Frishman, K. Heumann, A. Lesk, H. Mewes. Comprehensive, Comprehensible, Distributed
and Intelligent Databases: Current Status. Bioinformatics, vol. 14, No. 7, pp. 551–561, 1998. 6. I. Herman, G. Melanc¸on, M. S. Marshall. Graph Visualization and Navigation in Information
Visualization: a Survey. IEEE Trans. on Visualization and Computer Graphics, vol 6, no. 1, pp. 24–43, 2000.
7. C. Batini, T. Catarci, M. F. Costabile, S. Levialdi. Visual Query Systems. Report 04.91, Universita degli Studi di Roma La Sapienza, March 1991.
8. D. S. Parker, M. M. Gorlick, C. Lee. Evolving from Bioinformatics in the Small to Bioinformatics in the Large. OMICS, vol.7, no. 1, pp. 37–48, 2003.
9. M. Graves, E. R. Bergeman, C. B. Lawrence. Graph Database Systems for Genomics. IEEE Engineering in Medicine and Biology, vol. 14, no. 6, pp. 737–745, 1995.
10. R. Stevens, P. G. Baker, S. Bechhofer, G. Ng, A. Jacoby, N. W. Paton, C. A. Goble, A. Brass. TAMBIS: Transparent Access to Multiple Bioinformatics Information Sources. Bioinformatics, vol. 16, no. 2, pp. 184–186, 2000.
11. L. Zou. GraphLog: Its Representation in XML and Translation to CORAL. Masters Thesis, Dept. of Computer Science, Concordia University, 2003.
12. G. Wang. Linking CORAL to MySQL and PostgreSQL. Masters Thesis, Dept. of Computer Science, Concordia University, 2004.