Helsinki 26 June 2008 © Finnish Zoological and Botanical Publishing Board 2008
Large-scale landscape composition and capercaillie
(Tetrao urogallus) density in Finland
Janne Miettinen
1,3,*, Pekka Helle
1, Ari Nikula
2& Pekka Niemelä
31)Finnish Game and Fisheries Research Institute, Oulu Game and Fisheries Research, Tutkijantie 2 E,
FI-90570 Oulu, Finland (*e-mail: [email protected])
2)Rovaniemi Research Unit, Finnish Forest Research Institute, P.O. Box 16, FI-96301 Rovaniemi,
Finland
3)Faculty of Forest Sciences, University of Joensuu, P.O. Box 111, FI-80101 Joensuu, Finland
Received 14 June 2007, revised version received 18 Jan. 2007, accepted 18 Jan. 2008
Miettinen, J., Helle, P., Nikula, A. & Niemelä, P. 2008: Large-scale landscape composition and capercaillie (Tetrao urogallus) density in Finland. — Ann. Zool. Fennici 45: 161–173.
We studied the relationship between landscape composition and capercaillie density in 50 km ¥ 50 km grids in Finland, where modern forestry started in the 1950s and most
of the forests are in commercial use. Capercaillie density was positively associated with the young thinning stand proportion throughout the country, but unlike in numer-ous older studies, it wasn’t positively associated with the mature stand proportion in any part of the country. In central Finland this relationship was even negative. In cen-tral and southern Finland capercaillie density was associated positively with the forest land proportion, and negatively with the open area proportion. Results suggest that the overall amount of the forest cover is important for the capercaillie, and that clear-cut areas in the 1950s and 1960s, known as ‘large age classes’, have developed as suitable for them. A new aspect based on results is the potential reduction in the mature forest quality as capercaillie habitats.
Introduction
The capercaillie Tetrao urogallus is a large tetraonid bird belonging to the Siberian faunal type (Voous 1960). The distribution of the caper-caillie in Finland covers practically the entire country. The original distribution correlates with that of Scots pine (Pinus sylvestris), the main food source for the capercaillie in winter. The only areas where the capercaillie is not found are in the treeless north, in a part of the Baltic Sea archipelago, and in the most densely populated southwestern Finland (Väisänen et al. 1998). Declining densities have been reported through-out most of the species’ distribution during the
past few decades (e.g. Wegge 1979, Lindén & Rajala 1981, Hjorth 1994, Beshkarev et al. 1995, Catt et al. 1998, Storch 2000, Helle et al. 2003). The reasons most commonly put forward for the decline are unfavourable changes in the forest structure, bigger predator populations and, pos-sibly, excessive hunting (Helle & Helle 1991, Storch 2000). Changes in both forest stand and landscape scales caused by forestry are probably among the major factors having a negative effect on the species in Fennoscandia. Predation pres-sure on grouse nests and broods is also thought to be strongest in landscapes characterized by forest fragmentation associated with modern forestry (Sjöberg 1996, Storaas et al. 1999) or
agriculture (Kurki et al. 2000). The capercaillie, which is a species with a large home range, has been studied in the context of landscape ecology (e.g. Rolstad & Wegge 1989), and there is evi-dence that the capercaillie may have an umbrella species or indicator species characteristics, i.e. a vital capercaillie population would indicate the well-being of many other forest dwelling species (e.g. Suter et al. 2002, Pakkala et al. 2003).
In Finland, forestry, which has been consid-ered the main reason for the loss and degrada-tion of capercaillie habitats, changed extensively during the 20th century. Intensive forest manage-ment with clear-cuts started in the 1950s, while selective cuttings based on a minimum diameter had been used earlier (Leikola 1984). Forests, in northern Finland in particular, were extensively clear-cut after World War II. Now the forests in these former clear-cut areas are growing strongly. Since the middle of the 1970s, the annual pro-portion of clear-cuts has been constantly about 0.85% of the forest land area (Finnish Forest Research Institute 2005), but larger areas were clear-cut in the 1950s and the 1960s. These ‘large age-classes’ in Finnish forests are
gradu-ally returning as potential habitats for forest flora
and fauna due to growth. A slightly increasing proportion of forested areas (i.e. closed canopy) was also detected in southern Finland from the 1970s to the 1990s (Löfman & Kouki 2001). With regard to the capercaillie, it has been esti-mated that this recovery exceeds the loss of areas due to clear-cuts from the beginning of the 1980s (Rolstad & Andersen 2003).
In this work we study the relationship between landscape composition and capercail-lie density in different parts of Finland on a large scale, with a study unit size of 2500 km2,
using 12 year-average capercaillie density and 10 landscape classes. Most of the studies carried out on the habitat requirements of the capercail-lie have been made on the scale of an individual capercaillie or lekking population covering tens to thousands of hectares (e.g. Rolstad & Wegge 1989, Helle et al. 1990, Helle et al. 1994, Storch 1997, Miettinen et al. 2005), and our results will
be compared with those. Specifically, we test the
hypothesis whether the capercaillie is a species suited to mature forests (see e.g. Klaus et al. 1989), or more abundant, for example, in areas
characterized by middle-aged forests (Seiskari 1962).
Material and methods
Study area, capercaillie data and landscape data
Finland lies between 60–70°N and it extends from the hemiboreal zone to the arctic-alpine zone (Ahti et al. 1968). The average cover of forest in Finland is 60.1% of the total area (ca. 338 000 km2). Scrubland (mainly pine bog)
covers 7.9% and waste land (mainly open bog) 9.3%. Agricultural land and human settlements cover 12.7%, and water areas 10.0% (Finnish Forest Research Institute 2005). The dominant tree species are Scots pine (Pinus sylvestris), Norway spruce (Picea abies) and birch (Betula
spp.). Most of the forests are in commercial use and the landscape structure changed consider-ably during the 20th century due to logging and other human activities.
The capercaillie density data used in this study were derived from the results of wildlife triangle counts (Lindén et al. 1996) carried out in 1989–2000: density (ind. km–2) is calculated
for a forest land and it includes both adult and juvenile birds. The basic unit of this nationwide monitoring programme is a triangular-shaped transect with a side length of 4 km (total 12 km)
permanently marked in the field. Nearly 1000
triangles are studied annually; they are randomly located in forested areas throughout the country. Late summer count data were used in this study and August is a prime time for counting tetraonid birds since the young are still in broods together with their parent(s). Counts are carried out by a three-man chain: the person in the middle walks along the line and the two others at a distance of 20 m on either side; the width of the census belt is 60 m. For the details and reliability of the method, see Rajala (1974) and Brittas and Karlbom (1990). Volunteers (usually hunters)
do the fieldwork and the Finnish Game and
Fisheries Research Institute and the Hunters’ Central Organization run the programme jointly.
Capercaillie density fluctuates strongly from one year to another, and in earlier decades this fluc
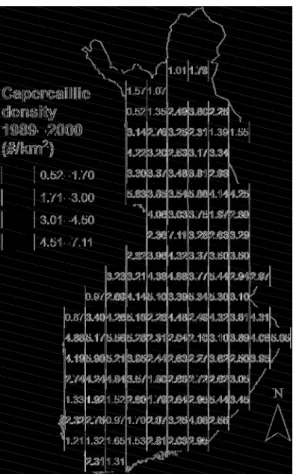
-tuation was cyclical with 5–7-year periods (e.g. Lindén 1989, Lindström 1996), but during this study period the cyclicity largely ceased. For this study, Finland was divided into 50 km ¥ 50 km
grids, giving a total of 150 grid cells (Fig. 1). We used 30 counts during a 12-year study period (1989–2000) in the grid as a minimum, and the
final data included 128 grid cells.
The proportion of waters, settlements,
agri-cultural fields, roads and different types of forest
were calculated for each grid cell (Table 1). The landscape data were derived from forest statistics reported for each municipality by the national forest inventory (NFI) from 1990–1994 (Tomppo
et al. 1998). Since the proportions of different types of forest were reported as a proportion of
forest land, all the values were first calculated
to correspond to the proportion of the land area of the municipality. If a grid cell included areas in two or more municipalities, then the values of each municipality were weighted by the propor-tion of the respective municipality area out of the total area of a grid cell. For example, if the area of a grid cell fell in three municipalities, A, B and C, and the proportions of pine-dominated forests within the municipalities were 60%, 30% and 40%, respectively, and the proportions of the area of a grid cell falling in the municipalities were 0.5, 0.25 and 0.25, respectively, then the proportion of pine-dominated forests in the grid cell was calculated as (0.5 ¥ 0.6) + (0.25 ¥ 0.3) +
(0.25 ¥ 0.4) = 0.3 + 0.075 + 0.1 = 0.475 (47%).
Except for the proportion of forests dominated
by specific tree species, the estimates produced
using this procedure omit the other structural variation of forests within municipalities.
Due to geographical variation and differences in forest-use history, there are gradients in the dominance of certain tree species on the regional scale. Therefore, the proportion of forests domi-nated by different tree species was interpolated to 1 km grid cells using pychnophylactic inter-polation (Tobler 1979). The idea of this method is to utilize the variation among neighbouring units, in this case municipalities, and to smooth the difference in variable values over the gra-dient. Smoothing was made by dividing each
municipality first into 1-km grid cells and then
allocating the original value of a variable to each cell. The algorithm then iteratively changes the
values of individual cells to correspond to a gra-dient within and among municipalities in such a way that the average of the grid cells within a municipality is the original value of a variable (mass preserving method) (Tobler 1979). The area and proportion of settlements, agricultural
fields and waters within the grid cells were cal -culated from 1:200 000 digitized maps (source: National Land Survey).
Statistical methods
Aggregating data to zones is a potential source of error if the criterion for aggregating is arbitrary in relation to the study question or data in use
(modifiable area unit problem, MAUP, see e.g. Jelinski & Wu 1996). Therefore, we preferred present-day landscape data in area division rather than e.g. traditional zonations based on vegeta-tion structure (Ahti et al. 1968) or avian
geog-Fig. 1. The study area. Study squares (50 km ¥ 50 km) were classified into northern (n = 57), central (n = 43) and southern Finland (n = 28) according to the land-scape data. Northernmost and some marginal squares were excluded because of insufficient data.
raphy (Järvinen 1980). We divided Finland into three sub-areas according to landscape data (var-iables) using the average linkage method (Cody 1974). As a result, northern Finland includes 57 cells, central Finland 43, and southern Finland 28. To further address the scale and zoning
prob-lems (MAUP), we compared results with the earlier findings from smaller scales, and studied
the data also without sub-area division. We used SPSS (11.5.1) and SAM (Spatial Analysis in Macroecology) (Rangel et al. 2006) softwares in the analyses (SAM is freely available at www. ecoevol.ufg.br/sam). Capercaillie density (Kol-mogorov-Smirnov test: in all Z < 0.738 and p > 0.648) and nearly all landscape class proportions were distributed normally in all regions. We used Pearson correlation to describe the relation-ship between landscape class proportions and capercaillie densities. Because the data are tied to geographical location, spatial autocorrelation may affect the classical tests of correlation
coef-ficients (see e.g. Legendre 1993, Legendre et al. 2002). Therefore Dutilleuls (1993) adjustment was used (whole distance range in 6 classes).
Because of large study units (2500 km2),
results may be affected by the broad-scale spatial structure in addition to the quality of individual patches (e.g. Legendre et al. 2002). Therefore the intercorrelation structure between the vari-ables was studied. Due to intercorrelations, we also studied partial correlations between caper-caillie density and landscape class proportions to
find possible changes in the results when some
variables were controlled. The result interpreta-tion here based on the changes in correlainterpreta-tion
coefficients. In these analyses spatial autocor -relation was not taken into consideration because Dutilleuls adjustment cannot be applied to partial correlation.
Results
Capercaillie density and landscape class proportions
The average capercaillie density in August in 1989–2000 was 3.19 ind. km–2 (SD = 1.26,
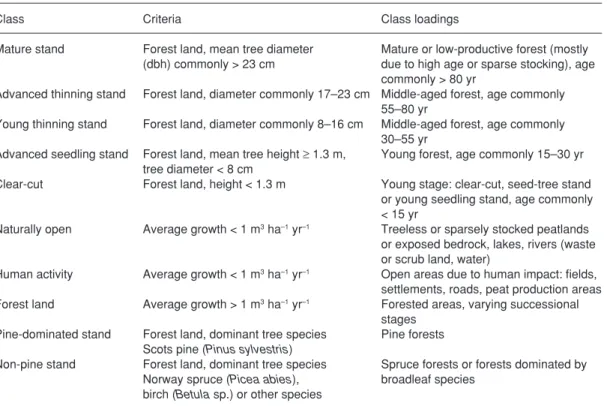
Table 1. Studied landscape classes.
class criteria class loadings
Mature stand Forest land, mean tree diameter Mature or low-productive forest (mostly (dbh) commonly > 23 cm due to high age or sparse stocking), age
commonly > 80 yr
Advanced thinning stand Forest land, diameter commonly 17–23 cm Middle-aged forest, age commonly 55–80 yr
Young thinning stand Forest land, diameter commonly 8–16 cm Middle-aged forest, age commonly 30–55 yr
Advanced seedling stand Forest land, mean tree height ≥ 1.3 m, Young forest, age commonly 15–30 yr tree diameter < 8 cm
clear-cut Forest land, height < 1.3 m Young stage: clear-cut, seed-tree stand or young seedling stand, age commonly < 15 yr
Naturally open Average growth < 1 m3 ha–1 yr–1 Treeless or sparsely stocked peatlands or exposed bedrock, lakes, rivers (waste or scrub land, water)
Human activity Average growth < 1 m3 ha–1 yr–1 Open areas due to human impact: fields, settlements, roads, peat production areas Forest land Average growth > 1 m3 ha–1 yr–1 Forested areas, varying successional
stages Pine-dominated stand Forest land, dominant tree species Pine forests
Scots pine (Pinus sylvestris)
Non-pine stand Forest land, dominant tree species Spruce forests or forests dominated by Norway spruce (Picea abies), broadleaf species
n = 57) in the northern region, 3.72 ind. km–2
(SD = 1.25, n = 43) in the central region, and 2.38 ind. km–2 (SD = 0.96, n = 28) in the
south-ern region (Fig. 2). The capercaillie densities varied between regions (One-way ANOVA: F
= 10.614, p < 0.001), and were significantly dif -ferent between the southern and central (Bonfer-roni post-hoc-test: p < 0.001) and southern and northern (p = 0.012) regions. The average length of wildlife triangle transects counted during the study period was very similar in all the regions, ranging from 1054 km/grid in the southern to 1072 km/grid in the northern region.
The proportion of advanced thinning stands increased towards the south, and the propor-tion of young thinning stands was higher in the northern and central regions than in the southern region, but all the other forest class proportions were relatively similar in all three regions. In all three regions positive correlations between capercaillie density and the young thinning stand proportion were observed (Table 2 and Fig. 3). In the southern region we detected a positive correlation between capercaillie density and the advanced seedling stand proportion and in the central region we detected a negative correla-tion between capercaillie density and the mature stand proportion.
The average proportion of naturally open areas was highest in the northern and central
Fig. 2. Average capercaillie densities (ind. km–2) during 1989–2000 in Finland within the 50 km ¥ 50 km squares.
Table 2. Average landscape class proportions (mean, cV) in studied regions. Landscape class proportion and capercaillie density correlations (Pearson, rp) in the third column. Statistical significance after Dutilleuls correction: * p < 0.05, ** p < 0.01, *** p < 0.001.
Landscape class Northern region central region Southern region
n = 57 n = 43 n = 28
Mean (%) cV (%) rp Mean (%) cV (%) rp Mean (%) cV (%) rp
Mature stand 16.37 30.79 –0.45 13.36 18.17 –0.33* 14.15 11.57 0.33 Adv. thinning stand 8.38 40.65 0.19 14.14 15.71 –0.09 16.38 11.78 0.26 Young thinning stand 23.52 25.68 0.58* 24.03 25.95 0.49** 19.52 24.90 0.70*** Adv. seedling stand 10.05 24.46 0.20 10.49 16.86 0.16 8.74 15.13 0.56**
clear-cut 6.51 25.70 0.03 5.96 25.17 0.22 5.84 24.62 0.35 Naturally open* 30.85 36.72 –0.29 19.68 43.67 –0.37* 13.55 46.65 0.29 Human activity 4.32 140.45 0.13 12.34 62.27 0.07 21.81 54.02 –0.64*** Forest land** 64.06 13.53 0.30 67.79 11.15 0.32* 64.28 13.06 0.67*** Pine stand 49.21 13.92 0.29 42.31 27.44 0.66*** 34.65 29.23 0.69*** Non-pine stand 14.51 30.71 0.10 24.70 32.60 –0.64*** 29.56 20.41 –0.16 * Naturally open areas 80% scrub or waste land in northern region, 78% water in central and southern regions. ** Includes mature stand, advanced thinning stand, young thinning stand, advanced seedling stand and clear-cut.
regions, and in the central region a negative cor-relation between capercaillie density and the nat-urally open area proportion was observed. The average proportion of human activity was high-est in the southern region, and a negative correla-tion between capercaillie density and the propor-tion of human activity was observed there.
The average proportion of forest land was 64%–68% in all three regions. In central and southern regions positive correlations between capercaillie density and the forest land propor-tion were detected. The average proporpropor-tion of pine stands increased and the proportion of non-pine stands decreased towards the north. In cen-tral and southern regions positive correlations between capercaillie density and the pine stand proportion were observed, and in the central region capercaillie density was negatively asso-ciated with the non-pine stand proportion.
When the relationship between the landscape class proportions and capercaillie density was studied over the entire study area, the young thinning stand (rp = 0.60, p < 0.001 [after Dutil-leul’s correction], n = 128), advanced seedling
stand (rp = 0.31, p = 0.018), forest land (rp = 0.39,
p = 0.003) and pine stand (rp = 0.50, p = 0.001) proportions were positively and the mature stand (rp = –0.32, p = 0.022) proportion was negatively correlated with capercaillie density.
Landscape class intercorrelations
In the northern region, negative correlations were observed between the mature stand and advanced thinning stand, young thinning stand, and human activity proportions (Table 3). On the other hand, positive correlations were detected between the mature stand and clear-cut and natu-rally open area proportions. Advanced thinning stand, young thinning stand and human activity proportions were positively correlated in the northern region. All three of those were also negatively associated with naturally open areas. In the northern region the pine stand proportion was positively associated with the young thin-ning stand, advanced seedling stand and clear-cut proportions. Northern Finland 1 2 3 4 5 6 7 Southern Finland Central Finland 1 2 3 4 5 6 7
Young thinning stan
d
M
ature stan
d
Capercaillie density (ind. km
2)
Landscape class proportion (%) rp = –0.448 p = 0.080 rp = 0.582 p = 0.025 rp = –0.333 p = 0.038 rp = 0.494 p = 0.002 rp = 0.696 p < 0.001 rp = 0.333 p = 0.083 10 20 30 40 50 60 1 2 3 4 5 6 7 10 20 30 40 50 60 10 20 30 40 50 60 Pine stan d rp = 0.686 p < 0.001 rp = 0.655 p < 0.001 rp = 0.293 p = 0.145
Fig. 3. capercaillie density and proportions of mature stand, young thinning stand and pine stand in northern, cen-tral and southern regions of Finland.
In the central region the intercorrelation struc-ture differed from that in the northern region. Both mature stand and advanced thinning stand proportions were positively associated with the non-pine stand proportion, whereas young thin-ning stands were negatively associated with the non-pine stand proportion. Negative correlations were observed also between the advanced thin-ning stand and young thinthin-ning stand and pine stand proportions. Also in the central region the pine stand proportion was positively associated with the young thinning stand, advanced seed-ling stand and clear-cut proportions.
In the southern region mature forests were positively correlated with the advanced seedling stand, clear-cut and non-pine stand proportions. The advanced thinning stand, young thinning stand and advanced seedling stand proportions were positively associated with the pine stand proportion. In the southern region the proportion
of human activity was negatively associated with
all five forest development classes.
Partial correlations
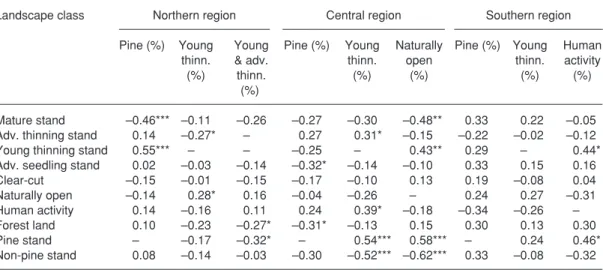
In the northern region the correlation coefficient
between the mature stand proportion and caper-caillie density was –0.11 when the young thin-ning stand proportion was controlled (Table 4).
However, the correlation coefficient between the
mature stand proportion and capercaillie density did not increase considerably from the original values (N: –0.45, C: –0.33 and S: 0.33, see Table 2) when the pine proportion, young thinning stand proportion or some other variables were controlled.
When the pine stand proportion was con-trolled, the clearest changes were detected in the central and southern regions. In the
cen-Table 3. correlation (Pearson) between landscape class proportions in northern (N: n = 57), central (c: n = 43) and southern region (S: n = 28). Statistical significance: * p < 0.05, ** p < 0.01, *** p < 0.001.
Mature Adv. Young Adv. clear-cut Naturally Human Pine Non-pine stand thinning thinning seedling open activity stand stand
stand stand stand Mature stand N 1.00 c S Adv. thinning N –0.66*** 1.00 stand c 0.19 S 0.13 Young thinning N –0.66*** 0.62*** 1.00 stand c –0.15 –0.61*** S 0.26 0.39* Adv. seedling N 0.05 –0.02 0.38** 1.00 stand c 0.28 –0.25 0.53*** S 0.52** 0.37* 0.70*** clear-cut N 0.42*** –0.31** 0.06 0.71*** 1.00 c 0.06 –0.20 0.58*** 0.51** S 0.40* 0.16 0.57** 0.64*** Naturally open N 0.35** –0.74*** –0.75*** –0.54*** –0.27* 1.00 c –0.26 –0.13 –0.31* –0.62*** –0.28 S 0.38* 0.23 0.14 0.28 0.00 Human N –0.59*** 0.84*** 0.42** –0.01 –0.30** –0.71*** 1.00 activity c –0.04 0.39* –0.47** –0.08 –0.43** –0.55*** S –0.58** –0.53** –0.73*** –0.76*** –0.51** –0.72*** Pine stand N –0.04 0.19 0.68*** 0.65*** 0.52*** –0.60*** –0.03 1.00 c –0.21 –0.42** 0.89*** 0.55*** 0.50** –0.52*** –0.17 S 0.14 0.56** 0.86*** 0.53** 0.32 0.17 –0.65*** Non-pine N –0.08 0.52*** 0.36** 0.35** 0.21 –0.71*** 0.52*** 0.09 1.00 stand c 0.64*** 0.40** –0.52*** –0.03 –0.08 0.20 –0.10 –0.74*** S 0.49** –0.09 –0.15 0.30 0.42* 0.11 –0.14 –0.52**
tral region correlation coefficient between the
advanced thinning stand proportion and caper-caillie density increased, but in the cases of the young thinning stand, advanced seedling stand and clear-cut proportion it decreased. In this case the strong positive correlation between the young thinning stand proportion and capercaillie density changed to a negative one.
Discussion
The importance of overall forest cover The capercaillie has traditionally been character-ized as a species adapted to the late-successional stages of forest (Klaus et al. 1989, Swenson & Angelstam 1993, Hjorth 1994). Our results suggest that in managed boreal forests middle-aged forests, in terms of single-cohort forest stand management (Oliver & Larson 1990), are suitable for the capercaillie because a positive relationship between the young thinning stand proportion and capercaillie density was observed throughout Finland. These middle-aged forests also include areas clear-cut in the 1950s and 1960s. In contrast to many earlier results (e.g. Rolstad et al. 1988, Rolstad & Wegge 1989, Helle et al. 1990, Helle et al. 1994, Storch 1995), the role of mature stands was weak, and the
cor-relation with capercaillie density was even nega-tive. The results are in agreement with recent
findings from Finland and Norway. In northern
Finland the number of males in the lekking site was positively correlated with the proportion of middle-aged forests in lekking site surroundings, but not with the proportion of mature forests (Miettinen et al. 2005). Accordingly, capercail-lie lek formation in young (or middle-aged) forests has recently been documented in Norway (Rolstad et al. 2007). Generally the results fol -lowed the pattern described by Seiskari (1962) and Swenson and Angelstam (1993), including a wide range of suitable successional stages for the capercaillie. This suggests that the overall amount of forest cover is more important for the capercaillie than any particular successional stage.
The main difference between regions was that capercaillie density was negatively associ-ated with human activity in southern Finland, whereas elsewhere it was negatively correlated with other characteristics of landscapes (water, waste land, scrubland, non-pine stands). The proportion of naturally open areas is tempo-rally quite constant, but, for example, in the south-coast area the proportion of human activ-ity increased from 29% to 36% from the 1970s to the 1990s (Finnish Forest Research Institute 1976, 2005). Due to this process large areas may
Table 4. Partial correlation coefficients between landscape class proportion and capercaillie density in three differ-ent regions of Finland when some of the variables are controlled. Statistical significance: * p < 0.05, ** p < 0.01, ***
p < 0.001.
Landscape class Northern region central region Southern region
Pine (%) Young Young Pine (%) Young Naturally Pine (%) Young Human
thinn. & adv. thinn. open thinn. activity
(%) thinn. (%) (%) (%) (%)
(%)
Mature stand –0.46*** –0.11 –0.26 –0.27 –0.30 –0.48** 0.33 0.22 –0.05 Adv. thinning stand 0.14 –0.27* – 0.27 0.31* –0.15 –0.22 –0.02 –0.12
Young thinning stand 0.55*** – – –0.25 – 0.43** 0.29 – 0.44*
Adv. seedling stand 0.02 –0.03 –0.14 –0.32* –0.14 –0.10 0.33 0.15 0.16
clear-cut –0.15 –0.01 –0.15 –0.17 –0.10 0.13 0.19 –0.08 0.04 Naturally open –0.14 0.28* 0.16 –0.04 –0.26 – 0.24 0.27 –0.31 Human activity 0.14 –0.16 0.11 0.24 0.39* –0.18 –0.34 –0.26 – Forest land 0.10 –0.23 –0.27* –0.31* –0.13 0.15 0.30 0.13 0.30 Pine stand – –0.17 –0.32* – 0.54*** 0.58*** – 0.24 0.46* Non-pine stand 0.08 –0.14 –0.03 –0.30 –0.52*** –0.62*** 0.33 –0.08 –0.32
have been or will become permanently unable to maintain viable capercaillie populations. There-fore the most southern parts of Finland can be
justifiably characterized as an ‘area of extinction’
for the capercaillie (Lindén et al. 2000).
If all successional stages of forest including closed canopy (young thinning stands, advanced thinning stands and mature stands) were assumed as roughly suitable — according to the estimate that forest suitability for capercaillie may be relatively constant after a certain age (Rolstad & Wegge 1990) — about 50% of the study area was suitable area for the capercaillie. Because the proportion is high, suitable patches are likely to form relatively large patches that are located automatically close to each other (see e.g. Andrén 1994), and are thus mostly ‘useful’ for the capercaillie. Therefore, the habitat propor-tion probably affects populapropor-tion size more than the patch size or isolation (Fahrig 1997, Jansson & Andrén 2003) of the capercaillie in Finland. On the other hand, as results concerning mature forests suggest, more coarse-grained aggregation
of resources may be beneficial for the species in
southernmost Finland, where the proportion of suitable area is low (see e.g. Rolstad & Wegge 1987).
In the study species density was used to describe the area quality as the capercaillie habitat. It is not necessarily the best indicator of habitat quality because during a short time high densities may occur even in poor habitats (Fretwell & Lucas 1969, van Horne 1983). But the large scale (2500 km2 study units) and long
period (12 years) used in this study make this source of error negligible. In a large scale and long period the basic population level proc-esses — birth, death, immigration and emigra-tion — are the most important processes instead of habitat selection by an individual in smaller scales (e.g. Andrewartha & Birch 1954). On the one hand, large study scale may mask relation-ships between landscape structure and capercail-lie density due to a small-scale variation in forest composition and in capercaillie density. Also some of the variation is evidently explained by factors not directly related to the landscape struc-ture. These factors include noise (uncontrolled
variation in habitat classification and capercaillie
density), climatic conditions (variation in winter
survival and breeding success) (e.g. Ludwig et al. 2006) as well as hunting and predation pressure (geographical variation in predator assemblages) (Helle & Helle 1991, Kurki et al. 2000, Storch 2000, Kauhala & Helle 2002) among others. On the other hand, the large size and the regular shape guarantee the approximate randomness of the wildlife triangles (Lindén et al. 1996), and as there was on average, a high number of counted transect in each grid cell (> 1000 km in all regions), capercaillie densities within the grid cells are most probably representative.
Mature forests and capercaillie
Taking into account the previous knowledge about the capercaillie, it was surprising that no positive effect of the mature forest proportion on capercaillie density was found in this study. However, it is already known that the capercail-lie does not always prefer old forests; in June and July they were found to use successional stages according to availability (Rolstad et al. 1988), and during winter females and subadult
males used middle-aged plantations (Gjerde &
Wegge 1989). On the other hand, in August — when the capercaillie data used in this study were collected — Rolstad et al. (1988) detected the capercaillie to prefer old forest.
The timing of the capercaillie data and land-scape data may cause a small bias in the results since the landscape data were from 1990–1994, and capercaillie data from 1989–2000. During the longest possible time gap, 10 years, many mature stands were clear-cut, which may affect the results. The average gap is only about 2 years, however, and therefore the time gap does not explain the observed results. Also the narrow range of the mature stand proportion in central and southern Finland is worth noting because a small variation in the landscape class proportion cannot simply explain the variation in capercail-lie density. In the northern region the amount of mature forest increased towards the north (°N vs. mature forest %: rp = 0.554, p < 0.001), whereas the general productivity decreases towards the north. We tested the effect of latitude in the northern region on the relationship between the mature forest proportion and capercaillie density.
We used latitude as a controlled variable in a par-tial correlation, but even this did not change the relationship to positive (rp = –0.273, uncorrected
p = 0.042). Thus other reasons may have caused the outcome.
The next potential explanation concerns northern Finland in particular and is based on landscape class intercorrelations and spatial structure (e.g. Legendre et al. 2002). First, the ‘large age classes’ of Finnish forests — areas clear-cut in the 1950s and 1960s — have grown and reached structural features suitable for the capercaillie. In the 1990s they were mostly at the thinning stand stage, and obviously formed large uniform patches where the spatial needs of the capercaillie are likely to be met. For exam-ple, a clear-cut of more than 1000 hectares was common in the 1950s and 1960s in northern Finland, and the largest one was about 18 000 hectares (Valtanen 1994). Since the 1960s the cutting patterns have changed towards a more
fine-grained regime (see also Löfman & Kouki 2001) and the large mature forest areas that have been cut diminished year by year. Whereas mature forests still formed large patches in the 1970s and 1980s, today they form mostly small patches (e.g. Östlund et al. 1997, Mykrä et al. 2000, Axelsson & Östlund 2001, Thingstad et al. 2003). In the northern region the mature forest proportion was positively associated with clear-cut and naturally open area proportions. All these classes were negatively associated with the thinning stand proportion. A negative association between mature and middle-aged forests can also be found from results obtained at smaller scale in Sweden (Jansson & Andrén 2003). These rela-tionships, as well as the increased correlation
coefficient between the mature stand proportion
and capercaillie density when the young thinning stand proportion was controlled, indicate that mature forests may suffer from the edge effect and isolation (Aune et al. 2005), which may lead to enlarged home ranges and reduced survival of the capercaillie (Wegge & Rolstad 1986, Storch 1995).
The tree-species composition could also affect the results. This is because during the winter the capercaillie is dependent on pine
nee-dles (e.g. Gjerde & Wegge 1989), and because
the mature forests especially in the central region
are mostly spruce forests. In the central and
southern regions the correlation coefficients
changed more than in the northern region when the pine stand proportion was controlled.
How-ever, we did not find any variable or group of
variables, which would have changed the rela-tionship between the mature stand proportion and capercaillie density to positive.
Another alternative is the inferior quality of the mature forest as a capercaillie habitat. In managed boreal forests (> 90% of forests in Finland) the late-successional stages may be degraded by thinnings because of the
simpli-fied stand structure (see e.g. Uuttera et al. 1997, Lilja & Kuuluvainen 2005). The role of dif-ferent forest successional stages as capercaillie habitats may also vary due to the variation in the forest stand structure between regions. In central Europe middle-aged forests are mostly too dense for the capercaillie, and mature forests largely represent optimal stand density for the species (Storch 1993). In Finland the forest stand
structure in the field layer, where the capercaillie
mostly stays during the snow-free season, could be too sparse (open-structured) in even-aged mature forests, especially at poor sites and in northern parts of the country.
Conclusions and prospects
The results showed that the capercaillie is not strictly an old-forest specialist. The overall forest cover may be more important for the capercail-lie than the old age or late successional stage of forests. Middle-aged forests, including the large areas cut in the 1950s and 1960s, known as ‘large age classes’ have obvious structural characteris-tics suitable for the capercaillie in the 1990s. In boreal areas, where forestry is major factor mod-ifying forests, the changes are not irreversible because clear-cut areas become young, growing forests relatively soon. An exception is the most southern parts of Finland, where the high propor-tion of human activity is still increasing. Spatial planning there leading to the aggregation of
forest cover would most probably be beneficial
for the capercaillie, but the primary concern is whether permanent fragmentation due to agri-culture, settlements and roads has exceeded the
critical threshold for maintaining viable caper-caillie populations.
Even though young thinning stands are not necessarily optimal for the capercaillie on the forest stand scale, they commonly form large uniform patches where the spatial needs of the species are likely to be met. Mature forests are known to be important for the capercaillie, as several older studies show, but this study also brought up other aspects. Mature forests may still be high quality capercaillie habitats on the forest stand scale, but the spatial aspects and differences in tree-species composition can over-run it. But the mature forest quality may also be reduced due to thinnings, or they could even naturally possess lower quality as capercaillie habitats than middle-aged forests.
At present, a crucial question in Finnish capercaillie habitat management is: how do thin-nings change the quality of forests for the caper-caillie? If the quality is not substantially reduced, the capercaillie can be simply and effectively taken into consideration in forest planning by increasing the amount of forest cover. In this case, based on forest age distribution, there would be plenty of suitable areas available for the species during the next few decades in most of Finland. In the other case, there is an urgent
need to find ways to improve thinning practice in
terms of the capercaillie’s needs. If such methods can be found, it would provide a novel tool for environmentally friendly forest management.
Acknowledgements
We wish to thank volunteer hunters throughout Finland. Their participation in the wildlife triangle counts has made this study possible. Thanks also to Vesa Nivala for his assist-ance in the data analysis, to Harto Lindén for his valuable comments on the manuscript and to an anonymous referee for the constructive criticism. We are grateful also to the
Emil Aaltonen Foundation, whose financial support (to JM)
has greatly helped our work.
References
Ahti, T., Hämet-Ahti, L. & Jalas, J. 1968: Vegetation zones and their sections in north-western Europe. — Annales
Botanici Fennici 5: 169–211.
Andrén, H. 1994: Effects of habitat fragmentation on birds
and mammals in landscapes with different proportions of suitable habitat: a review. — Oikos 71: 355–366.
Andrewartha, H. G. & Birch, L. C. 1954: The distribution
and abundance of animals. — University of Chicago
Press, Chicago.
Aune, K., Jonsson, B. G. & Moen, J. 2005: Isolation and
edge effects among woodland key habitats in Sweden: Is forest policy promoting fragmentation? — Biological
Conservation 124: 89–95.
Axelsson, A.-L. & Östlund, L. 2001: Retrospective gap analysis in a Swedish boreal forest landscape using historical data. — Forest Ecology and Management 147: 109–122.
Beshkarev, A. B., Blagovidod, A. A., Teplov, V. & Hjeljord, O. 1995: Populations of capercaillie and hazel grouse in large natural and logged forests in northern Russia. — In: Jenkings, D. (ed.), Proceedings of the 6th
Inter-national Grouse Symposium, Udine, Italy 1993: 12–18.
World Pheasant Association, Lower Basildon, UK. Brittas, R. & Karlbom, M. 1990: A field evaluation of the
Finnish 3-man chain: a method for estimating forest grouse numbers and habitat use. — Ornis Fennica 67: 18–23.
Catt, D. C., Baines, D., Picozzi, N., Moss R. & Summers R. W. 1998: Abundance and distribution of capercaillie
Tetrao urogallus in Scotland 1992–1994. — Biological
Conservation 85: 257–267.
Cody, M. L. 1974: Competition and the structure of bird
communities. — Princeton Univ. Press.
Dutilleul, P. 1993: Modifying the t-test for assessing the cor-relation between two spatial processes. — Biometrics
49: 305–314.
Fahrig, L. 1997: Relative effects of habitat loss and fragmen-tation on population extinction. — Journal of Wildlife
Management 61: 603–610.
Finnish Forest Research Institute 1976: Yearbook of forest
statistics1976.
Finnish Forest Research Institute 2005: Finnish Statistical
Yearbook of Forestry2005.
Fretwell, S. S. & Lucas, H. L. 1969: On territorial behaviour
and other factors influencing habitat distribution in birds.
I. Theoretical development. — Acta Biotheoretica 19: 16–36.
Gjerde, I. & Wegge, P. 1989: Spacing pattern, habitat use and
survival of capercaillie in a fragmented winter habitat.
— Ornis Scandinavica 20: 219–225.
Helle, P. & Helle, T. 1991: How do changes in forest struc-ture explain recent changes in Finnish grouse popula-tions? — Suomen Riista 37: 56–66. [In Finnish with English summary].
Helle, P., Jokimäki, J. & Lindén, H. 1990: Habitat selection of the male capercaillie in northern Finland: a study based on radiotelemetry. — Suomen Riista 36: 72–81. [In Finnish with English summary].
Helle, P., Helle, T. & Lindén, H. 1994: Capercaillie (Tetrao
urogallus) lekking sites in fragmented Finnish forest
landscapes. — Scandinavian Journal of Forest Research
9: 386–396.
Helle, P., Lindén, H., Aarnio, M. & Timonen, K. 1999: Metso ja metsien käsittely. Tietoa käytännön metsätaloudelle.
— Metsähallituksen metsätalouden julkaisuja 20: 1–23. Helle, P., Belkin, V., Bljudnik, L., Danilov, P. I. & Jakimov,
A. 2003: Changes in grouse populations in Finland and Russian Karelia during recent decades. — Suomen Riista
49: 32–43. [In Finnish with English summary]. Hjorth, I. 1994: Tjädern. En skogsfågel. — Skogsstyrelsen,
Jönköping.
Jansson, G. & Andrén, H. 2003: Habitat composition and
bird diversity in managed boreal forests. —
Scandina-vian Journal of Forest Research 18: 225–236.
Jelinski, D. E. & Wu, J. 1996: The modifiable areal unit prob -lem and implications for landscape ecology. —
Land-scape Ecology 11: 129–140.
Järvinen, O. 1980: Ecological zoogeography of northern
European bird communities. — Ph.D. thesis,
Depart-ment of Zoology, University of Helsinki.
Kauhala, K. & Helle, P. 2002: The impact of predator abun-dance on grouse populations in Finland — a study based on wildlife monitoring counts. — Ornis Fennica 79: 14–25.
Klaus, S., Andreev, A. V., Bergmann, H.-H., Müller, F., Porkert, J. & Wiesner, J. 1989: Die Auerhühner. — Die Neue Brehm-Bücherei, Band 86, Westarp
Wissenschaf-ten, Madgeburg, Germany.
Kurki, S., Nikula, A., Helle, P. & Lindén, H. 2000: Land-scape fragmentation and forest composition effects on grouse breeding success in boreal forests. — Ecology
81: 1985–1997.
Legendre, P. 1993: Spatial autocorrelation: trouble or new paradigm? — Ecology 74: 1659–1673.
Legendre, P., Dale, M. R. T., Fortin M.-J., Gurevitch, J.,
Hohn, M. & Myers, D. 2002: The consequences of spa-tial structure for the design and analysis of ecological
field surveys. — Ecography 25: 601–615.
Ludwig, G. X., Alatalo, R. V., Helle, P., Lindén, H., Lind -ström, J. & Siitari, H. 2006: Short- and long-term popu-lation dynamical consequences of asymmetric climate change in black grouse. — Proceedings of the Royal
Society B 273: 2009–2016.
Leikola, M. 1984: Present-day silviculture. — Silva Fennica
18: 338–342. [In Finnish with English summary]. Lilja, S. & Kuuluvainen, T. 2005: Structure of old Pinus
sylvestris dominated forest stands along a geographic
and human impact gradient in mid-boreal Fennoscandia.
— Silva Fennica 39: 407–428.
Lindén, H. 1989: Characteristics of tetraonid cycles in Fin-land. — Finnish Game Research 46: 34–42.
Lindén, H. & Rajala, P. 1981: Fluctuations and long-term trends in the relative densities of tetraonid populations in Finland, 1964–77. — Finnish Game Research 39: 13–34.
Lindén, H., Helle, E., Helle, P. & Wikman, M. 1996: Wildlife triangle scheme in Finland: methods and aims for moni-toring wildlife populations. — Finnish Game Research
49: 4–11.
Lindén, H., Danilov, P., Gromtsev, A., Helle, P., Ivanter, E. &
Kurhinen, J. 2000: Large-scale forest corridors to con-nect the taiga fauna to Fennoscandia. — Wildlife Biology
6: 179–188.
Lindström, J. 1996: Modelling grouse population dynamics.
— Ph.D. thesis, University of Helsinki.
Löfman, S. & Kouki, J. 2001: Fifty years of landscape transformation in managed forests of southern Finland.
— Scandinavian Journal of Forest Research 16: 44–53.
Miettinen, J., Helle, P. & Nikula, A. 2005: Lek area char-acteristics of capercaillie (Tetrao urogallus) in eastern Finland as analysed from satellite-based forest inventory data. — Scandinavian Journal of Forest Research 20: 358–369.
Mykrä, S., Kurki, S. & Nikula, A. 2000: The spacing of
mature forest habitat in relation to species-specific scales
in managed boreal forests in NE Finland. — Annales
Zoologici Fennici 37: 79–91.
Oliver, C. D. & Larson, B. C. 1990: Forest stand dynamics.
— McGraw-Hill, New York.
Östlund, L., Zackrisson, O. & Axelsson, A.-L. 1997: The his-tory and transformation of a Scandinavian boreal forest landscape since the 19th century. — Canadian Journal
of Forest Research 27: 1198–1206.
Pakkala, T., Pellikka, J. & Linden, H. 2003: Capercaillie
Tetrao urogallus — a good candidate for an umbrella
species in taiga forests. — Wildlife Biology 9: 309–316. Rajala, P. 1974: The structure and reproduction of Finnish
populations of capercaillie, Tetrao urogallus, and black grouse, Lyrurus tetrix, on the basis of the late summer census data. — Finnish Game Research 35: 1–51. Rangel, T. F. L. V. B., Diniz-Filho, J. A. F. & Bini, L. M
2006: Towards an integrated computational tool for spatial analysis in macroecology and biogeography. —
Global Ecology and Biogeography 15: 321–327.
Rolstad, E. & Andresen, J. 2003: Storfuglekologi og
skogbe-handling. — Skogforsk & Lövenskiold.
Rolstad, J. & Wegge, P. 1987: Distribution and size of capercaillie leks in relation to old forest fragmentation.
— Oecologia 72: 389–394.
Rolstad, J. & Wegge, P. 1989: Capercaillie populations and modern forestry — a case for landscape ecological stud-ies. — Finnish Game Research 46: 43–52.
Rolstad, J. & Wegge, P. 1990: Capercaillie habitat: a critical assessment of the role of old forest. — In: Lovel, T. W. I. & Hudson, P. J. (eds.), Proceedings of the 4th
Inter-national Grouse Symposium, Lam, West Germany 1989:
235–250. World Pheasant Association, Reading, UK.
Rolstad, J., Rolstad, E. & Wegge, P. 2007: Capercaillie
Tetrao urogallus lek formation in young forest. —
Wild-life Biology 13: 59-67.
Rolstad, J., Wegge, P. & Larsen, B. B. 1988: Spacing and habitat use of capercaillie during summer. — Canadian
Journal of Zoology 66: 670–679.
Seiskari, P. 1962: On the winter ecology of the capercaillie,
Tetrao urogallus, and the black grouse, Lyrurus tetrix, in
Finland. — Papers Game Research 22: 1–119. Sjöberg, K. 1996: Modern forestry and capercaillie. — In:
DeGraaf, R. M. & Miller, R. I. (eds.), Conservation of
faunal diversity in forested landscapes: 111–135.
Chap-man & Hall, London.
Storaas, T., Kastdalen, L. & Wegge, P. 1999: Detection of forest grouse by mammalian predators: A possible expla-nation for high brood losses in fragmented landscapes.
Storch, I. 1993: Habitat selection by capercaillie in summer and autumn: is bilberry important? — Oecologia 95: 257–265.
Storch, I. 1995: Annual home ranges and spacing patterns of capercaillie in central Europe. — Journal of Wildlife
Management 59: 392–400.
Storch, I. 1997: Male territoriality, female range use, and spatial organisation of capercaillie Tetrao urogallus leks.
— Wildlife Biology 3: 149–161.
Storch, I. (ed.) 2000: Grouse status survey and conservation
action plan 2000–2004. — WPA/BirdLife/SSC Grouse
Specialist Group, IUCN, Gland, Switzerland and Cam
-bridge, UK and the World Pheasant Association, Read
-ing, UK.
Suter, W., Graf, R. F. & Hess, R. 2002: Capercaillie (Tetrao
urogallus) and avian biodiversity: testing the
umbrella-species concept. — Conservation Biology 16: 778–788. Swenson, J. E. & Angelstam, P. 1993: Habitat separation by
sympatric forest grouse in Fennoscandia in relation to boreal forest succession. — Canadian Journal of Zool-ogy 71: 1303–1310.
Thingstad, P. G., Skjeggedal, T. & Markhus, G. 2003:
Human-induced alteration of two boreal forest land-scapes in central Norway, and some possible conse-quences for avian fauna. — Journal of Nature Conserva-tion 11: 157–170.
Tobler, W. J. 1979: Smooth pycnophylatic interpolation for
geographical regions. — Journal of American Statistical
Association 74: 519–530.
Tomppo, E., Katila, M., Moilanen, J., Mäkelä, H. & Peräsaari, J. 1998: Kunnittaiset metsävaratiedot 1990–94. — Folia
Forestalia 4B: 619–839.
Uuttera, J., Maltamo, M. & Hotanen, J.-P. 1997. The struc -ture of forest stands in virgin and managed peatlands: a comparison between Finnish and Russian Karelia.
— Forest Ecology and Management: 96: 125–138.
Väisänen, R., Lammi, E. & Koskimies, P. 1998: Distribution, numbers and population changes of Finnish breeding birds. — Otava, Helsinki. [In Finnish with English sum-mary].
Valtanen, J. 1994: Pohjois-Suomen suuret avohakkuut 1946–
70, yhteiskunnallinen tausta, toteutus ja vaikutukset.
— Metsäntutkimuslaitoksen tiedonantoja 533.
van Horne, B. 1983: Density as a misleading indicator of habitat quality. — Journal of Wildlife Management 47: 893–901.
Voous, K. H. 1960: Atlas of European birds. — Nelson, London.
Wegge, P. 1979: Status of capercaillie and black grouse in Norway. — In: Lovel, T. W. I. (ed.), Woodland grouse:
17–26. World Pheasant Association, Suffolk, UK.
Wegge, P. & Rolstad, J. 1986: Size and spacing of caper-caillie leks in relation to social behavior and habitat.
— Behavioral Ecology and Sociobiology 19: 401–408.