1-28-2014
Galaxy Merger Identification in the
GOODS-South Field
Erin O'Leary
Macalester College, ernoleary@gmail.com
Follow this and additional works at:http://digitalcommons.macalester.edu/mjpa Part of theAstrophysics and Astronomy Commons, and thePhysics Commons
This Capstone is brought to you for free and open access by
DigitalCommons@Macalester College. It has been accepted for inclusion in Macalester Journal of Physics and Astronomy by an authorized administrator of DigitalCommons@Macalester College. For more Recommended Citation
O'Leary, Erin (2013) "Galaxy Merger Identification in the GOODS-South Field,"Macalester Journal of Physics and Astronomy: Vol. 1: Iss. 1, Article 11.
Galaxy Merger Identification in the GOODS-South Field
Erin O’Leary
KPNO REU 2012 and Macalester College
Advisor: Dr. Jeyhan Kartaltepe (NOAO)
ABSTRACT
We analyzed a catalog of 7,628 galaxies at 0 <z<4 from CANDELS1 in the
GOODS-South2
field in order to identify a sample of galaxy mergers and inter-actions. Galaxy mergers are believed to play a fundamental role in galaxy evo-lution. Developing methods to robustly and efficiently identify mergers becomes vital with our increasing ability to study mergers at higher redshifts and in larger samples. We explored merger identification based on visual morphology classi-fication and preliminary attempts with automated quantitative methods. Using multiple detailed visual morphology classifications for each galaxy conducted by the CANDELS structure and morphology team, we created selection criteria to identify mergers from this visual classification catalog. We chose galaxies with high interaction classification and evidence of merger signatures (i.e. tidal fea-tures, double nuclei) to generate a catalog of 1051 galaxies we are confident are mergers. This represents a conservative sample of possible mergers. For compar-ison, we tested automated merger identification techniques previously used for
lower redshift (z < 1) galaxies. This is one of the first large investigations of
galaxy mergers at z > 1.
1http://candels.ucolick.org/
1. Introduction
Galaxy mergers are viewed as an important stage in hierarchical galaxy evolution. They allow for transformation in galaxy morphology, the assembly of mass, bursts of star forma-tion, and change in the overall number density of galaxies in the universe. In a cold, dark matter dominated universe, we would expect growth to be hierarchal. The most massive galaxies observed today are giant elliptical galaxies containing old stars and little to no star formation. In general, as we look back over cosmic time, we see fewer elliptical galaxies and more disk galaxies hosting dusty environments, star formation, and young stars. Local observations of mergers support the theory of hierarchical galaxy evolution, such as two disk galaxies merging to form a massive elliptical galaxy (Spergel et al. 2003; Toomre & Toomre 1972). However, the degree to which mergers play at high redshift, particularly at the peak
of galaxy assembly (z ∼ 2), is unclear. The role that mergers play is often measured by
analyzing the galaxy merger rate as a function of time, or redshift. In order to make such measurements, we first must have methods to identify as many mergers as possible at various redshifts.
A suite of techniques have been developed to identify galaxy mergers. Each technique is sensitive to different nuances of the data and identifying galaxies at different stages of the merging process. Visual and automated methods have had success in identifying mergers at lower redshifts in previous studies (e.g. Kartaltepe et al. 2010, Lotz et al. 2004, 2006, Con-selice et al. 2003). Individual visual classification of galaxy morphology is time consuming, yet the most robust method in identifying signature merger features to date. Automated classification has the appeal of increased efficiency but is strongly sensitive to the merging timescale. Kartaltepe et al. 2010 provides comparison of both techniques and finds 21% of automated classifications are recovered from visually classified mergers which is lower than the typical recovery fraction of 50%. We explore these two merger identification techniques to develop a working catalog of galaxy mergers for further analysis.
Previous studies using galaxy morphology to constrain the merger rate have been limited in both number of galaxy merger samples and the extent of the observable redshift range.
Our data is unique in that it extends to much higher redshift (z∼ 4) than most preexisting
data sets for morphology studies (e.g Lotz et al. 2006, Conselice et al. 2003, Le Fevre et
al. 2000), which extend to z ∼ 1 with sample sizes of ∼ 50-150. High redshift observations
are made possible by high resolution space based imaging from the Hubble Space Telescope (HST).
This paper steps through the significance of the CANDELS data, the visual morpholog-ical classification method, the automated classification method, and the comparison of these results in identifying mergers. We conclude with discussion of the future implications of this
study and routes of further analysis.
2. Data and Sample Selection
We begin with a collection of 7,628 images of galaxies and galaxy pairs from the Cosmic Assembly Near-infrared Deep Extragalactic Legacy Survey (CANDELS). CANDELS is the largest project in the history of the Hubble Space Telescope and covers a total of 5 legacy fields. These images were taken with the HST in the GOODS-South field with the Wide Field Camera 3 (WFC3) at 1600nm (H-band) and in 1250nm (J-band). We also include images from the HST- Avanced Camera for Surveys (ACS) in the V (600nm) and Z (850nm) bands used during classification. The visual classifications of these galaxies were completed by the CANDELS structure and morphology team, which is composed of over 100 individuals. Each image was classified by 3-6 people with the exception of a set of 200 images which have been classified by 42 classifiers.
The phenomenon known as bandshifting becomes significant as we look to high redshifts
(z >1). This is a result of the expanding universe and increased doppler shifting of galaxy
emission with increased redshift. At z ∼ 2, H-band near-infrared (NIR) images capture rest
frame optical wavelength light, exposing the galactic structure necessary for morphological classifications. Similarly, the ACS optical images also presented during classification probe
rest frame ultraviolet light at z ∼ 2 which reveal regions of clumpy star formation and
complicate morphology studies. High resolution NIR imaging is a vital tool for understanding galaxy structure over cosmic time.
In addition to the HST images, we utilize several data sets of parameters for each galaxy. A catalog of photometric redshifts calculated by fitting each spectral energy distri-bution (SED), stellar mass for each object with separate photometry, catalogs of absolute I magnitude as well as automated parameter catalogs of concentration, asymmetry, Gini
coefficient, M20 and Sersic index (parameters discussed further in Section 3.2) are provided
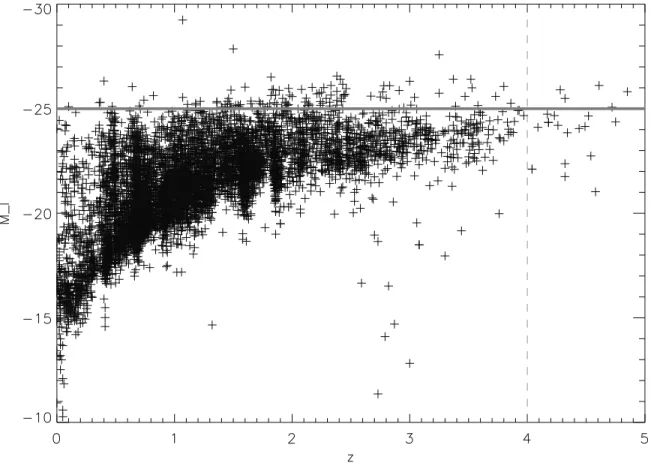
by the CANELS Structure and Morphology members. In order to ensure we are comparing the same population of galaxies in terms of luminosity across all redshifts, we create a cut in the sample above a certain magnitude. We match our set of galaxies with absolute I magnitude. This is the reddest filter for which we had a complete catalog of absolute
mag-nitudes. By plotting MI against redshift, we find the magnitude limit of our sample. This
is demonstrated in Figure 1 with the identified magnitude cut occurring at MI = -25. We
make a cut to our data, keeping only galaxies with MI > −25. After the photometric cut,
our catalog consists of 6,749 of the original 7,628 galaxies. These are the only galaxies that will be considered when compiling our set of mergers and interaction.
3. Methodology
3.1. Morphological Analysis: Visual Classification Method
The best technique for identifying mergers and interactions is first classifying as many galaxies and galaxy pairs as possible. The most common technique is visual morphology classification of individual galaxies. This process proves to be very time consuming and intrinsically introduces human bias into the classifications, but the human eye cannot be beat by any automated system in its ability to pick up on patterns and detect low surface brightness features. Features such as tidal arms or debris can appear very faint in galaxies, especially at high redshifts.
CANDELS has adopted an ambitious visual classification method involving many cat-egories of criteria. Each galaxy was classified by 3-6 individuals in order to smooth over individual bias. This scheme is discussed in Kartaltepe et al. (2012), but will be approached with more detail in Kartaltepe et al. (in preparation). Classification is completed through a web application or GUI that presents 5 images of the galaxy in V-band, Z-band, J-Band, and H-band, as well as a segmentation map extracted by SExtractor showing regions of same/separate photometry. Morphology classification should primarily be based on the red-der bands (H and J) with the optical bands present to reveal any clumpy structure in the UV. There are four categories of classifications. For our morphology analysis, we highlight the most pertinent components:
Main Morphology Classification: A galaxy may have multiple main morphology
classifica-tions. (1)Disk: Galaxies characterized by disk structure with or without central bulge. Can
be face-on or edge-on, disk dominated or bulge dominated. (2)Spheroid: Galaxies
charac-terized by centrally concentrated structure, roughly round or ellipsoidal. Should be selected
for bulge-dominated disk-spheroid systems. (3)Irregular: Galaxies that are not disks or
spheroids. Characterized by irregular structure. These can be slightly to strongly disturbed
systems. All mergers should be classified as Irregular. (4)Unresolved: A compact point
source. Structure cannot be resolved. (5)Unclassifiable: Objects that are too faint to
clas-sify or have problems with the images.
Interaction Classification: Only one interaction classification may be chosen. (1)Merger:
Galaxies that are single objects regardless of possible multiple nuclei. Double nuclei, tidal
features, and asymmetries are characteristics of mergers. (2)Interaction in Segmentation
Map: The primary galaxy shows signs of interaction with a clear companion within one
SExtractor segmentation map (meaning photometry of multiple systems are blended). In-teractions have signs of tidal interaction, duel asymmetries, and/or disturbed morphologies.
with a clear companion with a separate SExtractor segmentation map (meaning the pho-tometry of two or more objects is separate). Interactions have signs of tidal interaction,
duel asymmetries, and/or disturbed morphologies. (4)Non-interacting Companion: A close
companion that shows no evidence of tidal interaction or disturbed morphology. Possibly caused by projection effects, but must be confirmed with redshifts.
Structural Flags: (1)Tidal Arms: Disturbed arm(s) of debris resulting from an interaction.
These may appear very faint due to low surface brightness. (2)Double Nuclei: Multiple
nuclei existing within a singular stellar envelope. (3)Asymmetry: Clear asymmetry in the
galaxy’s light distribution.
Clumpiness Flags: Degree of clumpiness (more concentrated) or patchiness (more diffuse) in
each galaxy.
With visual classifications complete, we can calculate a classification fraction for each category for each galaxy from the visual classification data. The fraction was the ratio of the number of people who checked the given category by the number of classifiers for the given galaxy. Through analysis of correlations between categories and comparison to galaxy images, we can determine criteria to select out the merging galaxies.
3.2. Morphological Analysis: Quantitative Morphological Measurement Method
Another method of merger identification uses quantitative morphological measurements of galaxies. Automated routines for detecting mergers and interactions is an attractive thought as it would be less time intensive and subjective. Routines would be able to much more efficiently identify interacting galaxies without human involvement. There are five automated parameters that we consider in this identification method:
Concentration: How concentrated the flux is to the galaxy center. Calculation of the flux
ratio of an inner aperture versus an outer aperture. (Conselice et al. 2003)
Asymmetry: Calculation of how well the galaxy image is rotationally symmetric. Calculated
by comparing an image of the galaxy rotated 180 degrees to the original image. (Abraham et al. 1994)
Gini coefficient: Measure of the distribution of the flux among the pixels. (Abraham et al. 2003)
M20: Calculation of the second-order moment of the brightest 20 percent of the pixels. (Lotz
et al. 2006)
It tells us how disk-like (low value) or bulge-dominated (high value) the object is. (Peng et al. 2002)
By plotting combinations of these parameters, we can identify mergers by their location in a specified region of the plot. Routines run by Lotz et al. 2004 and 2008, Conselice 2003 have used these parameters to identify a significant fraction of visually confirmed merger galaxies at low redshift (z <1).
4. Results and Discussion
4.1. Visual Classification Method Results
4.1.1. Visually Identified Mergers
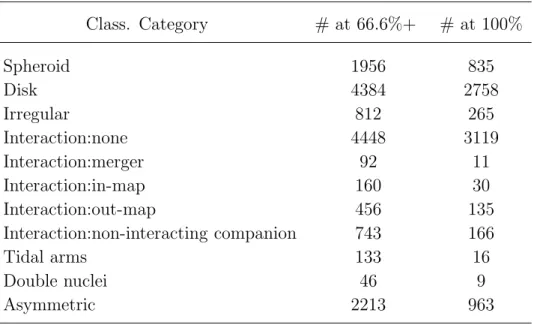
With classification fractions calculated for each of the categories, we can begin to de-termine what criteria is necessary to establish a galaxy merger. The number of galaxies that have over 66.6% and 100% classification percentages are listed in Table 1. From this data, we had to decide on conservative merger identification criteria. To create a set of merging and interacting galaxies, we included all systems that had a combined interaction classification fraction of 0.666 or more. This means that for each galaxy, the merger, the inside segmenta-tion map, and the outside segmentasegmenta-tion map classificasegmenta-tion fracsegmenta-tions were added. This makes more sense if the possible stages of the merging process we may be capturing these galaxies in are considered. We also chose to include all galaxies with a double nuclei or tidal arm classification fraction of 0.666 or more because these are significant merger signatures. These criteria capture those galaxies that we are sure are mergers or interactions. Ultimately, there are many possible mergers that do not meet these criteria. Our sample is thus a conservative sample of mergers from the full galaxy catalog. 1051 galaxies satisfy our criteria. A mosaic of examples of these identified mergers are displayed in Figure 2. Note the diverse structure in the galaxies and the presence of may tidal arms and double nuclei.
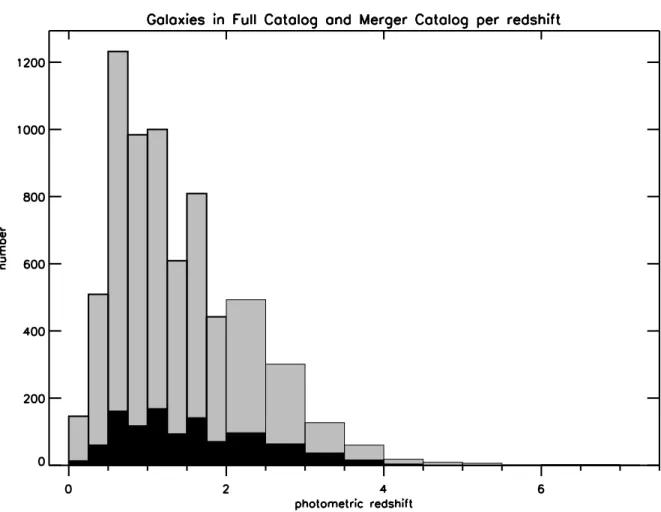
We then create a histogram of the photometric redshift for each galaxy. In Figure 3, the entire set of 6,749 galaxies are displayed in light gray with the visually identified mergers
shaded in black. The bin width is 0.25 for z < 2 and 0.5 for z ≥ 2 to account for the
increased uncertainty in the calculated photometric redshift at higher redshift. As shown,
the photometric redshift distribution of our entire set of galaxies peaks around z ∼ 1, but
extends to z ∼ 4. It is significant to note the redshift extent of our galaxy sample. The
4.1.2. Major and Minor Merger Detection
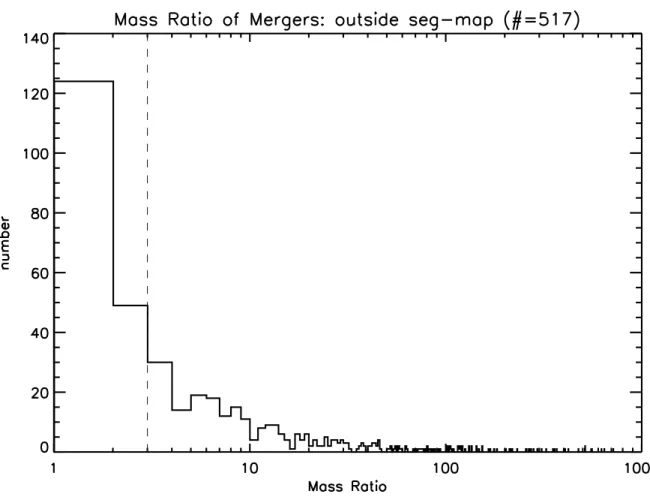
Astronomers assign descriptive qualities to merging systems, such as major or minor, to help describe how dynamic the situation is. This can be done by comparing the masses of the two constituent systems. From our sample of merger galaxies, we identify mergers that are predominantly classified as interactions outside of their segmentation maps. These systems have separate photometric information for each object in the system allowing us to calculate a mass ratio of the interacting pair. There are 517 galaxies that are predominately classified this way. With the photometric redshift and stellar mass catalog, we match each galaxy to its interacting galaxy companion by looking within ∆ z = 0.1 and finding the galaxy with the smallest angular distance away. We only consider companions within 100kpc. Gravitational galaxy interaction is typically observable within a distance of a few galaxy diameters away. 100kpc is adopted as our cut-off limit to ensure that the correct companion is matched. We limited the redshift range to ensure that the redshifts of the pair were similar to ensure they are not the result of project effects. The mass ratio is then calculated by taking the larger of the two masses divided by the smaller mass. Figure 4 displays a histogram of the resulting ratios.
With the mass ratio we can identify a merging system as either a major or a minor merger. Major mergers have a lower mass ratio. They tend to be systems of dynamic or
violent interaction. We adopt the standard that a mass ratio of (< 3 : 1) signifies a major
merger. Higher mass ratios (> 3 : 1) are then designated as minor mergers. Minor mergers
can be systems such as a spiral galaxy with asymmetries or a warped disk caused by an interaction with a much lower mass galaxy. The dotted line in Figure 4 separates the major and minor systems. Out of our merger subsample, we identified 173 major mergers and 344 minor mergers. These results can be used for later comparison of merger characteristics at different redshifts.
4.1.3. Preliminary Merger Fraction Calculation
A technique for quantifying the level of merger influence in galaxy evolution is by cal-culating the merger rate. We establish preliminary methodology to calculate this value. For
the redshift range from 0 ≤ z ≤ 4, we calculate the fraction of galaxies that are merging.
From the histogram displayed in Figure 3, we divide the number of merger galaxies in a redshift bin by the number of galaxies from the entire set in that redshift bin. We then
apply a least squares line fit to the points following the power law [(z+1)n
]. This is the adopted quantitative technique of measuring the merger rate in the literature. High values
mergers. As exhibited in Figure 5, the fit line represents the distribution of points very well
with all points falling within 1 or 2 σ.
We find an value of 0.634 which signifies a weak evolution by mergers. Previous findings
of n for low z samples suggest mergers as a significant or dominant mechanism for galaxy
evolution (eg. Kartaltepe et al. 2007; Conselice et al. 2003). We must note that this value must be considered a lower limit. Mergers are increasingly difficult to detect with increasing redshift, and therefore a correction should be applied to this exponent value to account for the undetected mergers at high redshfit.
4.2. Quantitative Morphological Measurement Results
The catalogs of the quantitative parameters only cover the central portion of the GOODS-S field. After matching each parameter to our galaxy set, we had 2,580 galaxies that had all five automated parameters along with the visual classification information. Out of these galaxies, 237 were visually classified mergers. With this information, we can test our visual classification results against automated merger identification method.
The first combination of parameters is the concentration parameter plotted against the asymmetry parameter. Figure 6 (top) displays this plot with the visually identified mergers shown in green, the major mergers shown in cyan, and the minor mergers shown in yellow. The dotted line represents the merger identification boundary as established by Conselice et al. (2003), above which merger galaxies should fall. We see that that the majority of the visually identified mergers are not automatically identified. Similar to this plot because of the strong correlation between concentration and the Gini coefficient, is the the plot of Gini versus asymmetry as displayed in Figure 6 (bottom). Again, we do not find that the visually identified mergers are recovered with the Conselice et al. (2003) boundaries. In both displays, the visually identified mergers do not show a distinctly different distribution than the rest of the galaxies. Compared to the results of previous studies (i.e. Conselice et al. (2003) and Lotz et al. (2008)), a considerable fraction visually identified mergers should be recovered. This is not apparent in our plots.
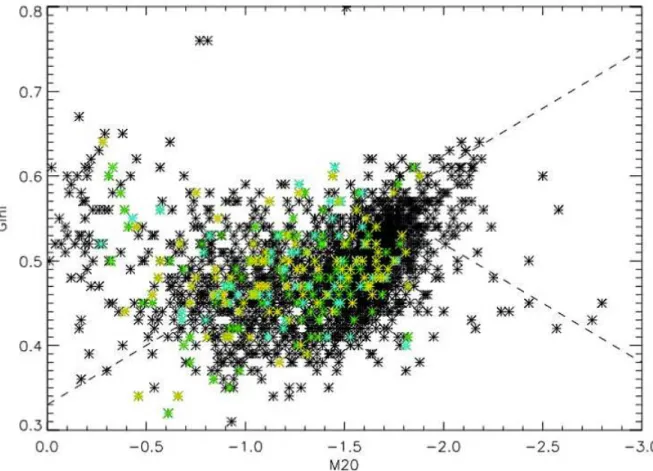
Another, and often viewed as a more efficient method of merger identification is the
M20 parameter versus the Gini coefficient. Displayed in Figure 7, the boundaries for merger
identification are established by Lotz et al. 2008. More visually classified mergers fall into the merger region than the previous two plots, but a fair number of not visually identified mergers also fall in this region. Overall, only a small portion of the visual mergers are recovered. The distribution of mergers and the rest of galaxies are indistinguishable.
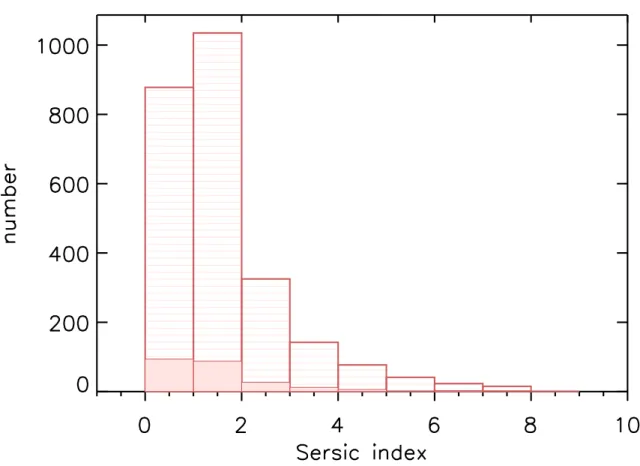
Figure 8 displays a histogram of the Sersic index for all galaxies in stripes and visually identified mergers in red. We observe that the mergers tend to have a low Sersic index signifying that they are more extended and disk-like. This agrees with what is known of mergers. The Sersic index by itself is not a robust method for identifying merging or non-merging galaxies.
While these trials do not suggest automated methods are robust methods for merger identification, It is significant that our first three plots to identify mergers did not do so with the same success of previous studies. There are several factors that can play into this. We have not considered if the automated parameters and the corresponding identification boundaries change with redshift. There may be a redshift limit out to which these techniques ”work.” This can be tested by binning our galaxy sample by redshift and reimplementing the plots. The galaxies that do fall in the merger region may also in fact be merging systems that fell below our strict visual merger criteria and should be looked into further. Overall it is important to note in these techniques that the criteria used have been established from galaxy samples at much lower redshifts and the same technique may not be a robust identification method at higher redshift.
4.3. Future Work
Future work comprises of experimentation with visual merger selection criteria and further exploration of the automated methods. This involves testing of automated methods on galaxy redshifts and reworking the merger identification boundaries on automated plots at high-z by finding correlations between the mergers we identified visually and automated parameters as well as looking into the galaxies that did fall in the merger identification region. Automated identification may be able to identify galaxies that are missed in visual identification and take a fraction of the time. Improved identification techniques can then be used on all five CANDELS fields to identify mergers and interactions.
4.4. Summary
We have presented results on galaxy merger identification using two methods: visual morphology classification of individual galaxies and quantitative automated parameters. A conservative visual merger catalog containing 1051 galaxies was constructed with visual morphology information. Out of these visual mergers, we are able to identify 173 major and 344 minor merger galaxies. We also establish preliminary methodology for calculating
the merger rate for this data set. A first pass at automated identification was completed
using combination of the Asymmetry, Concentration, Gini, and M20 coefficients as well as
the Sersic Index. We did not find high agreement with the galaxies we visually identified as mergers, which allows for several areas of further investigation.
5. Acknowledgements
I would like to express appreciation of Jeyhan Kartaltepe, my advisor for the KPNO REU, and the time she invested in helping me through my research, as well as Ken Mighelle, the REU coordinator.
This research was supported by the KPNO/NOAO Research Experience for Under-graduates (REU) Program which is funded by the National Science Foundation Research Experience for Undergraduates Program and the Department of Defense ASSURE program through Scientific Program Order No. 13 (AST-0754223) of the Cooperative Agreement No. AST-0132798 between the Association of Universities for Research in Astronomy (AURA) and the NSF.
REFERENCES
Abraham, R. G., Valdes, F., Yee, H. K. C., & van den Bergh, S. 1994, ApJ, 432, 75 Abraham, R. G., van den Bergh, S., & Nair, P. 2003, ApJ, 588, 218
Conselice, C. J., Bershady, M. A., Dickinson, M., & Papovich, C. 2003, AJ, 126, 1183 Kartaltepe, J. S., Sanders, D. B., Scoville, N. Z., et al. 2007, ApJS, 172, 320
408, 272
Kartaltepe, J. S., Sanders, D. B., Le Floc’h, E., et al. 2010, ApJ, 709, 572 Kartaltepe, J. S., Dickinson, M., Alexander, D. M., et al. 2012, ApJ, 757, 23 Le F`evre, O., Abraham, R., Lilly, S. J., et al. 2000, MNRAS, 311, 565 Lotz, J. M., Primack, J., & Madau, P. 2004, AJ, 128, 163
Lotz, J. M., Madau, P., Giavalisco, M., Primack, J., & Ferguson, H. C. 2006, ApJ, 636, 592 Lotz, J. M., Davis, M., Faber, S. M., et al. 2008, ApJ, 672, 177
Peng, C. Y., Ho, L. C., Impey, C. D., & Rix, H.-W. 2002, AJ, 124, 266 Toomre, A., & Toomre, J. 1972, ApJ, 178, 623
Table 1. 100% and 66% Category numbers Class. Category # at 66.6%+ # at 100% Spheroid 1956 835 Disk 4384 2758 Irregular 812 265 Interaction:none 4448 3119 Interaction:merger 92 11 Interaction:in-map 160 30 Interaction:out-map 456 135 Interaction:non-interacting companion 743 166 Tidal arms 133 16 Double nuclei 46 9 Asymmetric 2213 963
Fig. 1.— We apply a photometric cut to our galaxy sample. We cut at MI = -25, including
(a) (b) (c) (d) (e) (i) (m) (q) (u) (v) (r) (n) (j) (k) (g) (o) (s) (w) (x) (h) (l) (p) (t) (f)
Fig. 2.— 24 examples of merger galaxies visually identified. Note the presence of tidal arms and double nuclei among these images.
Fig. 3.— Histogram of photometric redshifts for full catalog of galaxies (light gray) and for the visually identified merger galaxies in black.
Fig. 4.— Mass ratio histogram for predominately classified as out-map interactions in the merger set. The dotted line drawn at 3 indicates the division between major and minor mergers.
Fig. 5.— Scatter plot of merger fractions per redshift with 1σ error bars. The best fit line
Fig. 6.— Plots of automated parameters for all 2580 galaxies. Visually identified mergers are in green, major mergers in cyan, and minor mergers in yellow, all other galaxies are plotted in black. Above: Concentration v. Asymmetry; dotted line at log(A) = -0.46 Below: Gini v. Asymmetry; dotted line at log(A) = -0.46
Fig. 7.— Plot of M20 v. Gini Coefficient for 2580 galaxies. Visually identified mergers are in green, major mergers in cyan, and minor mergers in yellow, all other galaxies are plotted in black.
Fig. 8.— Histogram of Sersic index for 2580 galaxeis. All galaxies in stripes and visually identified mergers overlaid in pink.

![Fig. 5.— Scatter plot of merger fractions per redshift with 1σ error bars. The best fit line follows the form [α(z+1) n ], where n = 0.634](https://thumb-us.123doks.com/thumbv2/123dok_us/10058459.2905534/18.918.148.783.321.827/fig-scatter-plot-merger-fractions-redshift-error-follows.webp)