9 Ngo, V., & Pavelková, D. (2017). Moderating and mediating effects of switching
costs on the relationship between service value, customer satisfaction and customer loyalty: investigation of retail banking in Vietnam. Journal of International Studies, 10(1), 9-33. doi:10.14254/2071-8330.2017/10-1/1
Moderating and mediating effects of
switching costs on the relationship
between service value, customer
satisfaction and customer loyalty:
investigation of retail banking in Vietnam
Vu Minh Ngo
Tomas Bata University in Zlín Czech Republic
ngo@fame.utb.cz
Drahomíra Pavelková Tomas Bata University in Zlín Czech Republic
pavelkova@fame.utb.cz
Abstract. Switching cost highlights the way how companies create barriers to proactively prevent customer defection which directly and significantly affects customer loyalty and then companies’ performance. The purpose of this paper is to provide empirical evidences about the impact of switching cost on customer loyalty by examining its mediating and moderating effects on the relationships between service value, customer satisfaction and customer loyalty. Specially, two difference types of switching costs, positive one and negative one, are proposed and tested independently in order to provide more insights about their impacts. The data about switching costs and other constructs are collected from 261 retail banking customers, and analysed using structural equation modelling and moderated path analysis. It is found that positive switching costs increase customer loyalty by partly transforming the effect of service value and customer satisfaction into customer loyalty. While negative switching cost only mediates the service value-loyalty relationship. Moreover, only negative switching cost has significant moderating effect on the satisfaction-loyalty relationships. Finally, the analysis reveals that negative switching cost might also weaken good impacts from positive switching cost on satisfaction-loyalty relationships.
Keywords: customer satisfaction, service quality, service value, customer loyalty, positive switching costs, negative switching costs, structural equation modelling. JEL Classification: M10, M31 Received: October, 2016 1st Revision: March, 2017 Accepted: April, 2017 DOI: 10.14254/2071- 8330.2017/10-1/1 Journal of International Studies
Scie
ntific Pap
ers
© Foundation of International Studies, 2017 © CSR, 2017Journal of International Studies Vol.10, No.1, 2017
10
INTRODUCTION
In spite of the fact that most of companies today strictly and intensively monitor their customers’ experiences with them, there are very few companies nowadays confident that their customers are truly loyal. Among several measures for customers’ experience, the most popular and prominent one is customer satisfaction. There are several ways through which companies can increase customer experience and customer satisfaction. However, they seem to be unsuccessful to make customers loyal in most of the cases. As indicated by the investigation of more than 390 companies in 40 industries by Chinese Enterprise Research Center of Tsinghua University, satisfied customers are not always loyal ones (Zhang, 2008). In fact, researchers have started to raise this issue of too solely focus on customer satisfaction among practitioners. Researchers assert that customer satisfaction is not enough to make customers loyal (Jones & Sasser, 1995). On the other hand, satisfaction with the service provided is the foremost condition for customer loyalty (Oliver, 1999). Therefore, it is necessary to further examine the nature of satisfaction-loyalty relationship to explorer more factors influencing the link between customer satisfaction and customer loyalty.
In marketing literature, as for the goal of retaining customers, Kotler (1997) proposes two primary approaches: making customer satisfied and raising switching costs. Switching costs refers to the loss that customers incur when they decide to change suppliers. Especially, in the relation to customer satisfaction and service quality, these potential losses can make customer stay loyal even when they are temporary not satisfied with the products or services before companies take some recovery actions (Aydin, Özer, & Arasil, 2005; Chen & Wang, 2009; Pick & Eisend, 2014). Because of this supplemental role, switching costs are usually considered as moderators for satisfaction-loyalty and service value - loyalty linkages. In addition to the moderating role, switching costs can also be referred as “customer bonding”, a deep and powerful relationship in which customers have built up and maintained with companies over time (Hess & Enric Ricart, 2003). These emotional linkages might make the defection decision much more difficult and take much more time for customers to decide, then ultimately increase the level of customers loyalty. Therefore, in this study customer bonding created by switching costs is assumed to be the further necessary step after customers are satisfied for transforming customer satisfaction and service value into customer loyalty. Therefore, switching costs are assumed to have both mediating effects and moderating effects on customer satisfaction - loyalty and service value -loyalty linkages in this paper.
Most of the previous studies have approached switching cost as a multidimensional construct but when investigating its role in the satisfaction-loyalty relationship, it is treated as an overall construct (Aydin et al., 2005; Chen & Wang, 2009; M. A. Jones, Reynolds, Mothersbaugh, & Beatty, 2007; M. A. Jones, Mothersbaugh, & Beatty, 2000; Pick & Eisend, 2014). This approach though good for examining the role of switching costs in general, cannot give enough information for deeper understanding of the impacts of switching costs. Therefore, with the objective of providing greater insights on the impact of switching costs on customer loyalty, this study separates switching costs into two different types of switching costs, positive switching costs (PSC) and negative switching costs (NSC). This classification is especially useful for practitioners by giving them more detailed guidance for applying switching costs in order to enhance customer loyalty.
In sum, switching costs with their proposed effects on customer loyalty are argured to be the missing links for strengthening the relationship between service quality, customer satisfaction and customer loyalty. Therefore, the primary objective of this study is to examine and empirically test the moderating and meditating effects of different types of switching costs on the service value - loyalty and satisfaction-loyalty relationships. The results of this analysis are expected to clarify the effects of different types of switching
11 costs on customer loyalty and provide more insights on how to use specific type of switching costs in real practice. The rest of this study is divided into sections as follows. First, the next section provides theoretical background and develops the hypotheses for this study. Second, the research methodology is discussed. Third, data analysis and results are presented. Finally, the findings of this study are concluded and managerial implications and limitations are discussed.
1. THEORETICAL BACKGROUND AND HYPOTHESES
1.1. Customer loyalty
Customer loyalty (CL) is argued as the closest step to the repurchase behavior of customer. Customer loyalty has been usually referred as the consequence for all the experiences which customer has with a service/product provider (Mascarenhas, Kesavan, & Bernacchi, 2006). The experiences might include the physical interactions, emotional involvements and value chain moments according to Mascarenhas et al. (2006). According to Oliver (1999), the shift to loyalty strategy from only satisfaction strategy can substantially increase customer retention and reduce marketing cost. In other study, Camarero and colleagues (2005) found on a Spanish case that customer loyalty have both positive impacts on firm’s market performance and economic performance. Generally, customer loyalty has been referred as the link between customer attitude, repeat purchase and financial performance (Heskett, Jones, Loveman, Sasser Jr., & Schlesinger, 2008; T. O. Jones & Sasser, 1995). Moreover, by including the psychological meaning of loyalty, Oliver (1999) defines customer loyalty as:
“a deeply held commitment to rebuy or re-patronize a preferred product/service consistently in the future, thereby causing repetitive same-brand or same brand-set purchasing, despite situational incidences and marketing efforts having the potential to cause switching behavior.”
In addition, according to Oliver (1999), loyalty can be developed through different phase which are cognitive sense, affective sense, conative manner and finally behavioral manner. The first three phases are usually referred as attitudinal loyalty which are dependent on the experiences that customers have with service providers (overall satisfaction). Completing these three stages can lead to the behavioral loyalty as the final stage (Oliver, 1999). This evolvement process of customer loyalty is confirmed by a meta-analysis about the antecedents of customer loyalty by Pan, Sheng and Xie (2012).
1.2. Customer satisfaction
Customer satisfaction (CS) has become one of the most popular business norms because of its crucial role in emerging customer-oriented approach pursuing by most of the companies in current business environment. Achieving and managing customer satisfaction is seen as the crucial business process in any organizations for improving profit margin, returns on equity, market value, retention and word-of-mouth effects (Chocholáková, Gabcová, Belás, & Sipko, 2015; Dotson & Allenby, 2010; Williams & Naumann, 2011; Yeung, Lee Chew Ging, & Ennew, 2002). Empirical studies in the literature show that customer satisfaction can lead to improvement in financial performance (Reimann, Schilke, & Thomas, 2010; Sun & Kim, 2013). Especially, managing customer satisfaction is considered as the higher-ordered capability which links other lower-order capabilities such as human analytic, information technology and service process innovation to firm’s financial performance (Chen & Tsou, 2012; Coltman, Devinney, & Midgley, 2011). From marketing literature, customer satisfaction is defined as an “emotional state that occurs in response to an evaluation of the interaction experiences” (Westbrook and Oliver, 1981). Specifically, customer
Journal of International Studies Vol.10, No.1, 2017
12
satisfaction is described as the customer’s attitude about the degree of the perceived performances meeting with their expectation (Awwad, 2012; Johnson, Gustafsson, Andreassen, Lervik, & Cha, 2001; Oliver, 1993). Moreover, satisfaction is not a static feeling but a dynamic process (Fournier & Mick, 1999), which is updated when customer gain more experienced with the service provider. Therefore, the overall satisfaction is the cumulative result of multiple transaction-specific satisfactions when interacting with service providers.
1.3. Customer satisfaction and customer loyalty
Although customer satisfaction and customer loyalty are distinct constructs, they are highly correlated (Hall, 2011; Silvestro & Cross, 2000). It is argued that customer satisfaction can lead to customer loyalty since people tend to be rational and risk-adverse so that they might have a tendency to reduce risk and stay with the service providers where they already had good experience. Actually, customer satisfaction has been suggested to be an antecedent of loyalty in service context in previous studies (Mittal & Kamakura, 2001; Santouridis & Trivellas, 2010). Oliver (1999) suggests that customer satisfaction can play many roles in the relationship with customer loyalty. It can be just the starting point of customer loyalty; it can be the core components of loyalty or it can just be one of the components of loyalty. In addition, the relationship between customer satisfaction and customer loyalty might be nonlinear. Heskett et al. (1997) suggested that customer loyalty should improve dramatically when customer satisfaction overcomes a certain level. In sum, the proposition is that satisfaction is an essential necessary parts to achieve customer loyalty.
However, customer satisfaction is not enough to retaining customers in the long-term in most of the cases. Fleming and Asplund (2007) assert that customers might need more than “satisfying transactions” to become the truly loyalty customer. They find that the level of engagement between customers and companies plays important role in forming the loyalty in customers. The engagement is usually affected by the emotional satisfied rather than the rational satisfied (Fleming & Asplund, 2007). If companies cannot afford to build the emotion connection with the customers, the satisfaction with the products or service is worthless (McEwen & Flaming, 2003). Neal (1999) finds that even highly satisfied customers usually switch brands and suppliers. He also argues that customer satisfaction did not have directly connection to loyalty because customer satisfaction is attitude which is too far from the behavior concept like customer loyalty. In this study, the authors compromise both school of though and proposed that customer satisfaction is the necessary ground for customer loyalty. However, in order to go the whole way to loyalty from satisfaction, other factors should be considered as moderator or mediators for this linkage.
1.4. Quality, value, customer satisfaction and customer loyalty
As mentioned earlier, customer satisfaction is described as a result of the comparison of customers’ expectations and his or her subsequent perceived value of service quality (Zeithaml, Berry, & Parasuraman, 1996). Therefore, main elements which determine customer satisfaction are the customer’s perception of service quality (SQ) and service value (SV). According to this conceptualization, perceived service quality is the first antecedents to overall customer satisfaction and perceived value is the second antecedents to overall customer satisfaction (Fornell, Johnson, Anderson, Cha, & Bryant, 1996). Perceived service valued in this sense is the perceived service quality relative to price and cost which customer has to incur to receive the services (Hallowell, 1996).
Other studies show evidences support this relationship between customer satisfaction and service quality, service value (Cronin Jr., Brady, & Hult, 2000; Santouridis & Trivellas, 2010). However, there are also debates about the causal relationship between customer satisfaction and service quality/value.
13 Specifically, there are three major positions about this relationship in the literature (Brady, Cronin, & Brand, 2002). First, as indicated above, service quality/value are described as antecedents to customer satisfaction (E. W. Anderson, Fornell, & Lehmann, 1994; E. W. Anderson & Sullivan, 1993; Cronin & Taylor, 1992). Second, some researchers suggest that customer satisfaction is the cause of service quality (Bitner, 1990). The third position of the service quality/value- satisfaction relationship argues that neither satisfaction nor service quality/value may be antecedent to the others but acting independently in the relationships with customer loyalty (Dabbolkar, 1995; McAlexander, Kaldenberg, & Koenig, 1994). In general, although there is the lack of consensus about the conceptualization of the service quality- satisfaction relationship, service quality is an antecedent to customer satisfaction is considered as dominant position. In addition, in this stream of research, most of the studies confirm that there is positive relationship between service quality and customer loyalty and customer satisfaction is usually the mediator between them (Brady et al., 2002; Chodzaza & Gombachika, 2013; Chu, Lee, & Chao, 2012; Cronin Jr. et al., 2000). In a recent meta-analysis about customer loyalty antecedents, the results show that the effect of quality on loyalty becomes stronger over time (Pan et al., 2012).
From the analysis above, the interrelationships between service quality, service value, customer satisfaction and customer loyalty are conceptualized and depicted in Figure 2 as the research model named „the satisfaction model“ supposing that satisfaction is the closet concept to customer loyalty so far. A hypothesis concerning the nature of the interrelationships between service quality, service value, customer satisfaction and customer loyalty is proposed for testing:
H1: In banking industry context, customer satisfaction mediates the effects of service quality and service value on customer loyalty.
1.5. Switching costs
Switching cost can be defined as the costs that customers need to incur when they move from one service or products providers to others (Heide & Weiss, 1995). Switching costs consist of both monetary expenses (fines, fees, contractual obligations) and nonmonetary costs (time or psychological efforts) (Dick & Basu, 1994). The psychological efforts might involve the loss of loyalty benefits which built up overtime with a company (Lam, Shankar, Erramilli, & Murthy, 2004). For example, customers might make investment in the interpersonal relationships with employees in their service providers. Therefore, customers might have the benefits of familiar with routines and procedures in their service providers. In addition, customer might also receive extra benefits when dealing with employees in their service providers (Colgate & Lang, 2001). In the same vein, Jones (2000) also classifies switching barriers into three categories as interpersonal relationships, perceived switching costs and attractiveness of alternatives. He finds each type of switching barriers has different impacts on the repurchase intention. In this study, the switching costs facing by customers are also divided into two different types, the positive one and negative one. The domains of positive switching costs (PSC) are included mainly the benefits from interpersonal relationships and benefit of loyalty which enhance the emotional connection with the service providers (M. A. Jones et al., 2007). Customers certainly enjoy these benefits at the current service providers. On the other hand, negative switching costs (NSC) domains consist of monetary costs and procedural expenses like times and efforts which make it more difficult for customers to leave. They only appear at the time of customers are going to churn and have no benefit to the customer relationships with service providers during the time of interaction (Reynolds & Beatty, 1999; Sharma & Patterson, 2000).
Journal of International Studies Vol.10, No.1, 2017
14
1.6. Switching costs’ moderating and mediating effects
As mentioned earlier, in order to transform satisfaction to loyalty, other factors need to be included in this linkage. For this purpose, switching cost is usually viewed as a moderator in the relationship between customer satisfaction and customer loyalty (Chen and Wang, 2009; Pick and Eisend, 2014). Switching costs’ roles are first mentioned in the strategic management literature by Porter in his works: Competitive strategy (1980) and Competitive Advantage (1985). In these works, Porter introduces five market forces driven the strategic management but asserts that the most important work of managers is to understand the underpinning sources of these forces (Porter, 1985). Switching costs is proposed as one of the underpinning sources of these forces. More specifically, in strategic management literature, switching costs are described as the key protection mechanisms which help to differentiate products/services and lock in buyer enough from the attractiveness of the competitors (Porter, 1989). This helps companies to buy more time to overcome the challenges from current competitors, emerging new entries, threats from substitute products or services and balances the bargaining powers from buyers and suppliers. In marketing literature, increasing switching costs is the way to make customer loyal besides increasing customer satisfaction (Kotler, 1997). The moderating effects of switching costs on the satisfaction-loyalty linkage depend on the nature of market competition (T. O. Jones & Sasser, 1995). If the market is competitive, but there are very little switching costs, customers who satisfied are very likely to be disloyal. However, if the market is competitive and there is high level of switching costs, only satisfied customer repurchased the services or products, and only small parts of repurchased customers are false loyal customers (T. O. Jones & Sasser, 1995). Thus, in the context of retail banking sector in Vietnam which is very competitive, the switching costs are expecting to strengthen the relationships between service value, customer satisfaction and customer loyalty. The research model are developed and depicted in Figure 1 as “The Moderating effects model”.
In addition, the mediating role of switching costs is usually overlooked in marketing literature. Oliver (1999) suggests that customer satisfaction might be just the starting point for customer loyalty and if the satisfaction is not nourished by other elements, satisfaction cannot transform to loyalty. Satisfaction with current service provider might lead to the commitment and the willing to invest in relationship with the current service provider then lead to the potential loss of social benefit when leaving the current relationship. Satisfaction with current providers can also lead to increase of using more services from current service
CS SV
PSC
CL
NSC
Model 1: The “Moderating Effects” Model
Moderating effects Figure 1. The moderating effects model
15 provider then lead to more binding and procedural cost when switching. These arguments are conceptualized in the term “customer bonding” proposed by Hax and Wilde (2001) in their works to describe more deep and meaningful relationships which customers have with their companies. According to marketing literature, this type of affective emotion connection is necessary to achieve beyond the satisfaction from customers to retain customers in the long-term (Fleming & Asplund, 2007; McEwen & Fleming, 2003; Jones & Sasser, 1995; Oliver, 1999). In this study, mediating effects of positive switching costs and negative switching costs on service value- loyalty linkage and satisfaction- loyalty linkage are tested separately and jointly in different research models named as “The positive switching costs model”, “The negative switching costs model” and “The switching costs model” respectively. These models are depicted in Figure 2. Based on the theoretical background, following hypotheses are proposed to test propositions of moderating and mediating effects of switching costs:
H2: In the retail banking context, the higher level of positive/negative switching costs, the stronger the link between customer satisfaction and customer loyalty is.
H3: In the retail banking context, the higher level of positive/negative switching costs, the stronger the link between service value and customer loyalty is.
H4: In the retail banking context, positive switching costs mediate the effects of customer satisfaction and service value on customer loyalty.
H5: In the retail banking context, negative switching costs mediate the effects of customer satisfaction and service value on customer loyalty.
CS
SV CL
SQ
Model 2: The “Cusotmer Satisfaction” Model CS SV PSC SQ CL
Model 3: The “Positive Switching Costs” Model
CS SV
NS SQ
CL
Model 4: The “Negative Switching Costs” Model
CS SV PSC SQ CL NS
Model 5: The “Switching Costs” Model
Figure 2. The mediating effects models Sources: own study.
Journal of International Studies Vol.10, No.1, 2017
16
2. METHODOLOGY
2.1. Instruments
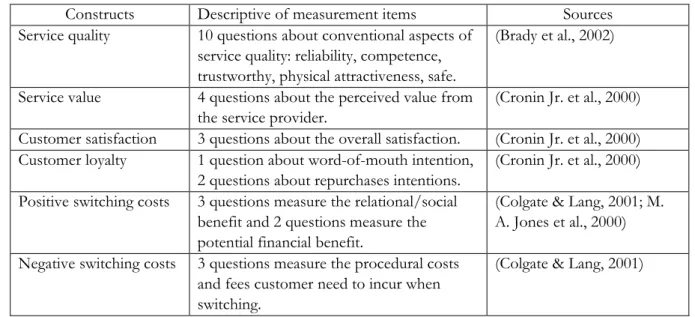
In this study, the measurement instruments for the concepts of service quality, service value, customer satisfaction, customer loyalty and switching costs are adopted from previous studies (Brady et al., 2002; Colgate & Lang, 2001; Cronin Jr. et al., 2000; M. A. Jones et al., 2000). Modifications and translations are made to transform the measurement scale to be readable for average retail banking customers in Vietnam and reflect the context of the retail banking industry in Vietnam. In general, the respondents are asked to give their agreement or disagreement with the statements as the indicators for measuring the mentioned concepts. Respondents give their opinion for each statement through 7-point Liker scale with 1 to indicate “strongly disagree” and 7 to indicate “strongly agree”. The sources of used measurement instruments in this study are presented in the Table 1 below.
Table 1 Constructs sources for measurement instruments
Constructs Descriptive of measurement items Sources
Service quality 10 questions about conventional aspects of service quality: reliability, competence, trustworthy, physical attractiveness, safe.
(Brady et al., 2002) Service value 4 questions about the perceived value from
the service provider.
(Cronin Jr. et al., 2000) Customer satisfaction 3 questions about the overall satisfaction. (Cronin Jr. et al., 2000) Customer loyalty 1 question about word-of-mouth intention,
2 questions about repurchases intentions.
(Cronin Jr. et al., 2000) Positive switching costs 3 questions measure the relational/social
benefit and 2 questions measure the potential financial benefit.
(Colgate & Lang, 2001; M. A. Jones et al., 2000) Negative switching costs 3 questions measure the procedural costs
and fees customer need to incur when switching.
(Colgate & Lang, 2001) Source: own study.
2.2. Data collection and sample
A questionnaire is developed by the authors for collection data from retail banking customers in Vietnam in February 2016. Retail banking customers have to use at least one service from one bank in Vietnam. Emails with a survey instrument were sent by author to a total 850 customers of 11 retail banks in Vietnam. There were 273 customers participated in the research. Among responds returned, there were 12 responses were eliminated because of uncompleted answers. Finally, there are usable 261 responses were collected and used, which make 30% successful response rate. The main demographic features of the respondents are described as followed. There are 102 respondents are males (39%) and 159 are female (61%). Respondents whose ages are from 20 to 30 and 30 to 45 constitute 46.2% and 51.4% of the sample population. The average income per month of respondents varied widely from $ 200 to more than $ 1500. Almost half of the respondents have the average income per month around $ 400 to $800 (46%), only small
17 portion of respondents have average income per month from $ 800 to more than $ 1500 (16%). Most of the respondents have college or university degree (80%) or have postgraduate degrees (14.5%). In addition, regarding the services that respondents use the most from their banks, most of the respondents use the debit/credit card and payment services (50%), transferring money services (25%), or deposit and saving purpose (15%).
Concerning the representative of respondents in the survey for retail banking customers in Vietnam, the similarity in income range and age of the respondents in the survey with the demographic characteristics of population in Vietnam might lessen the concern about the risk of bias in the sample. The GDP per capita of Vietnam in 2015 is 5668 USD according to Worldbank data which is similar to the average income of most of the respondents in the survey. More than 62% of total Vietnam population is the age from 15 to 54 (source: CIA world Factbook 2015) which might explain why more than 90% of respondents in the survey is from 20 to 45 years old. Report about Vietnam banking sectors in 2015 from Duxton Asset Management also show the new trend in retail banking customers which highlight the rapid increase of non-cash payment transaction through using credit cards, mobile banking and e-wallet. This report estimates that during the period 2009-2013, card transactions double. This explains why using debit/credit card and payment services is account for half of total services that respondents in the survey use with their banks.
2.3. Analytical techniques
2.3.1. Structural Equation Modeling (SEM)
The proposed mediating effects of customer satisfaction and switching cost in the hypotheses 1, 4 and 5 are tested by Structural equation modeling (SEM). For achieving this, Amos 22.0 is employed to test the research models 2,3,4 and 5. SEM is a very general statistical modeling technique which is first used in behavior science and becoming very popular in many disciplined such as marketing, management, education in recent years. SEM has some important features which match with the statistical analysis of this paper. First, SEM is capable of dealing with theoretical constructs which are measured by the latent factors. In this paper, all the important factors of analysis is unobserved and represented as latent variable such as such as service value, customer satisfaction, customer loyalty and switching cost. Second, SEM can be used as a more powerful alternatives to multiple regression, path analysis for examining the complex interrelationships between constructs which consists of multiple direct and indirect relationship like in our research models (Streiner, 2006). Advantages of SEM compared to multiple regressions and path analysis include more flexible assumptions; allowing interpretation even in the face of multicollinearity; use of confirmatory factor analysis to reduce measurement error; testing models overall rather than testing coefficients individually; testing models with multiple dependent variables; modeling complex causal paths taken by mediating variables.
In this paper, the confimatory approach of SEM is used. First, because of the fact that this study based on the collected data from an self-administrative questionnaire, the Common Method Bias test is necessary to see if there is unobserved common factors affects the data collected. Second, the confirmatory factor analysis (CFA), reliability and validity analysis are performed to assess the adequacy of the measurement model for each research model. Third, if the models have adequate fit with data, the structural models are tested to assess the significant of relationships within each research models in Figure 2. Then, the bootstrapping technique are employed to test the significant of direct effect and indirect effect between factors to reject or not to reject the hypotheses of mediating effects of customer satisfactions, positive
Journal of International Studies Vol.10, No.1, 2017
18
switching costs and negative switching costs on customer loyalty (H1, H4, H5). Finally, the R-square representing the % explained variance of customer loyalty of 4 mediating models are comparing to each other to assess the effects of each type of switching costs on explaining customer loyalty.
2.3.2. Moderated analysis
For testing the moderating effects of positive switching costs and negative switching costs, the moderated regression analysis (MRA) is used to test the proposed moderated relationships in the research model. The MRA is executed by also using SPSS Amos 22 as the proposed moderating research models in Model 1. First, all the interested factors are mean center. Then, the product terms of the predictors and the proposed moderators are calculated for each case and used as the variables for testing the moderating relationships. The regression coefficients of these product terms are tested to determine whether moderating effects are statistically significant (Saunders, 1956).
In addition to the conventional test for moderating effects, based on the results of the analysis, we further test the integration of moderating effect and mediating effect of positive and negative switching costs in order to elaborate how two types of switching costs interact with each other in explaining the relationship between customer satisfaction and customer loyalty. For doing it, the analytical framework using Moderated path analysis (MPA) are employed from Edward and Lambert (2007). In this research, we are interested in the moderated mediation, in which a mediating effect is thought to be moderated by some variable (Baron & Kenny, 1986). More specifically, it is assumed that the moderating effects of switching costs will moderates their mediating effects to some degree. For investigating this, some researchers will divide sample into smaller groups according to the level of moderated variables and mediating effect is tested in each group. In the other way, this method integrates moderated regression analysis (MRA) and path analysis; shows the direct, indirect and total mediating effects according to levels of moderator variable. Therefore, it can also overcome issues with the current method such as incomplete path analysis in mediating effects testing. The MPA analysis is executed in SPSS 22.
3. RESULTS
3.1. Descriptive overview
The descriptive statistics for each construct in the measurement instruments are provided in Table 2. The mean of all the constructs range from 4.31 to 5.14 which are above the average value according to 7-point Likert scale. With 1 as “strongly disagree” and 7 as “strongly agree” and 4 as “neutral”, most of retail banking customers’ answers are toward Agree continuum with the statements in the measurement instrument.
Customer loyalty is the constructs with the highest mean (5.1). This might suggest that most of the retail banking customers might have overall positive attitude toward their current banks. Positive switching cost (PSC) seems to be applied more often and have more impacts on customers than negative switching cost (NSC) by retail banks in Vietnam. This reflexes in higher mean and lower standard error for PSC over NSC. Other details about descriptive statistics can be seen from the Table 2.
19 Table 2 Descriptive Statistics
N Minimum Maximum Mean Std. Deviation
Statistic Statistic Statistic Statistic Std. Error Statistic
SQ 261 1.75 6.35 4.7846 .05343 .86314 SV 261 1.43 6.75 5.0206 .05438 .87848 CS 261 1.26 6.42 4.6461 .06505 1.05096 NSC 261 1.04 6.98 4.3141 .09097 1.46959 PSC 261 1.87 6.90 4.9149 .06179 .99833 CL 261 1.58 7.00 5.1449 .07105 1.14782
Source: own study.
Notes: SQ: Service quality, SV: Service Value, CS: Customer satisfaction, NSC: Negative switching costs, PSC: Positive switching costs, CL: Customer loyalty.
Common method bias
This study uses survey method and self-administrative questionnaire for collecting data from retail baking customers. Therefore, the test for common method bias is necessary to assess whether there is spurious common hidden factor affecting the constructs’ variances rather than themself in the instrument (Podsakoff, MacKenzie, Lee, & Podsakoff, 2003). Using the Harman’s single factor test, there is no single factor which account more than 50% of variance explained in the data collected. In addition, the common factors tests are conducted with the measurement model for all constructs in Amos 22. The differences of regression weights for each item in the instrument are compared between the models with common factors and without common factors. With the threshold of 0.25, only very small proportions of items (7/28) have been affected by the common factors. Therefore, the common method bias can be safely ignored for further analysis.
3.2. Constructs reliability and validity
Construct reliability refers to the degree to which a set of indicators consistently and stability reflect a given constructs. Cronbach’s alpha is the most commonly used for assessing the reliability of a construct. The Cronbach’s alpha of each construct in the research model is presented in Table 3. As indicated in Table 3, all the Cronbach’s alpha for all constructs exceeds 0.80, satisfying the general recommended level of 0.70 for the research indicators (Cronbach, 1951). Convergence validity refers to how well different indicators using for measuring a construct converge, indicating that a single dimension of meaning is being measured. Convergent validity can be assessed by examining the factor loading and the average variance extracted (AVE) of the constructs (Fornell and Larcker, 1981). All the indicators have significant loading onto the constructs which they expected to measure (p < 0.01). Moreover, as presented in Table 2, the AVE for each construct is greater than 0.50, which indicate the convergence validity of the constructs.
Journal of International Studies Vol.10, No.1, 2017
20
Table 3 Convergent Validity
Source: own study.
Table 4 Discriminant Validity SQ SV CS PSC NSC CL SQ 0.863 SV 0.431 0.863 CS 0.377 0.758 0.895 PSC 0.565 0.810 0.773 0.857 NSC 0.277 0.431 0.377 0.565 0.847 CL 0.553 0.768 0.875 0.853 0.533 0.910
Source: own study.
Discriminant validity refers to the fact that indicators for different constructs should not be so highly correlated across constructs which can be lead to the constructs overlap. Discriminant can be examined by comparing the construct’s square root of AVE with its square correlation with other constructs (Fornell and Larcker, 1981). As presented in Table 4, the square root AVE value of each construct are greater than its square correlation with other constructs, which support the discriminant validity of the constructs.
3.3. Testing the measurement models
Confirmatory Factor Analysis (CFA) is executed to assess how the proposed research models (Model 2-5) in the Figure 1 fits with the data collected from the samples. Previous studies suggest using more than one goodness-of-fit index to evaluate the model fit of the proposed model (J. C. Anderson & Gerbing, 1988). Therefore, in this study set of goodness-of-fit indices are used. Specifically, in the model 5 “switching costs” model, The Chi-square is significant χ2 = 228.3 (p = 0.00), the relative Chi-square (χ2/df = 1.65) (smaller than 2) show the acceptable fit with large sample. Other indices also show the good fit for the research model according to the conventional thresholds. The normed fit index (NFI) = 0.952, the comparative fit index (CFI) = 0.980, the Tucker-Lewis coefficient index (TLI) = 0.975 (NFI, CFI, TLI all > 0.95); the root mean square residual (RMR) = 0.072 and root mean square error of approximation (RMSEA) = 0.050 (both < 0.08). In sum, the data collected from the sample of retail banking customers are fit well with the proposed research model. The goodness of fit indexes of all the models is reported in the Table 5.
Constructs Cronbach’s alpha AVE
Service Quality (SQ) 0.940 0.604
Service Value (SV) 0.919 0.745
Customer satisfaction (CS) 0.923 0.802
Positive Switching cost (PSC) 0.933 0.728
Negative Switching cost (NSC) 0.883 0.717
21 Table 5 Goodness of fits of proposed research models
Models χ2/df NFI CFI TLI RMSEA
“Customer satisfaction” model 1.777 0.941 0.973 0.968 0.055
“Positive switching costs” model 1.688 0.931 0.971 0.966 0.051
“Negative switching costs” model 1.609 0.936 0.974 0.970 0.048
“Switching costs” model 1.585 0.925 0.971 0.967 0.047
Source: own study.
According to the results, all of the model show good fits with the data and are good for further analysis with structural model and moderated model. Comparing the goodness-of-fit indexes among 4 models, the “switching cost” model show the best results of fit with the observed data indicating that it is better to explain variances of customer loyalty when incorporating both types of switching costs into the only “customer satisfaction” model. We can expect that customer with higher perceived switching costs are more likely to be loyal customer.
3.4. Structural model: Testing the mediating effects
Path analysis of structural equation modeling is executed to test the hypotheses about the mediating effects (H1, H4 and H5) by assessing the statistical significance of direct and indirect relationships in the researches model 2-5. In addition, for investigating the statistical significance of mediation effects, the bootstrapping approach is used for the full “switching costs” model. Bootstrapping test is suitable in this study because it does not impose distributional assumptions (Preacher & Hayes, 2004). Table 6 presented the results of path analysis for all 4 models. The results of bootstrapping test for model 5 are presented in the Table 7. The goodness of fit indexes are also presented in Table 6, showing that all of the proposed structural models have good fits with collected data. In addition, the f-squared statistics are calculated for estimating the changes in explained variance of CL between the other models with model 2. The f-squared test is used to calculate the effect of the new variables on the explained variance of dependent variables’ comparing with the initial model without them (Aiken, West & Reno, 1991). In this study, f-squared tests represent the effect size of two types of switching costs separately and jointly on customer loyalty comparing with model 2. Then, these effects are then classified as “Large effect”, “Medium effect” and “Small effect” based on their size of impacts as in Table 6. The thresholds for the classification are employed from Aiken et al., 1991.
According to results in Table 7, there are insignificant coefficients reflecting insignificant relationships between particular constructs across all 4 research models which make these models not completely valid. However, this issue is expected in the statistical technique which use multiple regressions and path analysis at the same time like SEM. By taking into account the effects of all constructs simultaneously and incorporating both direct relationships and indirect relationships (mediating effects) between constructs, the insignificant coefficients of some direct relationship are usually expected. The direct relationship effects are usually cancel out by the indirect relationships. It can be seen as the “crowding out” effects of indirect relationships on direct relationships. For example, service quality is expected to directly influence customer loyalty but it is not in all 4 models because the direct effect of service quality on customer loyalty is fully mediated by other constructs such as customer satisfactions, service value and switching costs. More importantly, most of the interested direct and indirect relationships between constructs in proposed hypotheses are significant. The customer satisfaction directly influences customer loyalty in all 4 models.
Journal of International Studies Vol.10, No.1, 2017
22
The direct link from service quality, service value to customer satisfaction is also positive and significant. Therefore, the indirect links of service quality, service value to customer loyalty mediated by customer satisfaction are confirmed. H1 is supported. With service value, customer satisfaction only partly mediates its effects on customer loyalty (SV -> CL is significant in model 2). These results indicate that customers who perceived high quality with the service of their banks are more likely to be satisfied customer. Then if the satisfaction is consistent, it can developed gradually into loyalty. There are some cases the value received by customers are impressive enough to make the customers stay loyal with the banks without the effects of other factors.
Table 6 Estimations of structural model
Path/Goodness of fit indexes Model 2: Customer satisfaction model Model 3: Positive switching cost model
Model 4: Negative switching cost model
Model 5: Swithing costs model SQ -> SV 0.786 *** 0.797 *** 0.783 *** 0.796 *** SQ -> CS 0.243 *** 0.240** 0.245 ** 0.24 ** SQ -> CL 0.045 (ns) -0.050 (ns) 0.094 (ns) 0.038 (ns) SV -> CS 0.721 *** 0.720 *** 0.719 *** 0.720 *** CS -> CL 0.737 *** 0.568 *** 0.704 *** 0.586 *** SV -> CL 0.289*** 0.023 (ns) 0.154 (ns) -0.006 (ns) SV -> PSC - 0.605 *** - 0.620 *** SV -> NSC - - 0.571 *** 0.620 *** CS -> PSC - 0.350*** - 0.344 *** CS -> NSC - - 0.178 (ns) 0.164 (ns) PSC -> CL - 0.500 *** - 0.383 *** NSC -> CL - - 0.181 *** 0.121 *** χ2/df 1.777 1.683 1.613 1.679 NFI 0.941 0.931 0.935 0.919 CFI 0.973 0.97 0.974 0.966 TLI 0.968 0.966 0.97 0.961 RMSEA 0.055 0.051 0.049 0.051 R2 – CL’s explained variance 0.792 0.846 0.837 0.860
f-squared 0.3636 – Large effect 0.2883 – Medium effect 0.500 – Large effect
Source: own study.
Notes: *: p-value < 0.05, **: p-value < 0.01, ***: p-value < 0.001, ns: not significant. SQ: Service quality, SV: Service Value, CS: Customer satisfaction, NSC: Negative switching costs, PSC: Positive switching costs, CL: Customer
loyalty.
Both negative switching costs and positive switching cost positively relate to customer loyalty. They represent these direct links to customer loyalty both separately and jointly in Model 3, 4 and 5. Furthermore, the links from service value and customer satisfaction to positive switching costs are significant in model 3 and 5. Therefore, positive switching costs (PSC) are confirmed as the mediator for both customer
23 satisfaction and service value. In the case of negative switching costs (NSC), only service value is significantly related to them. Thus, NSC only mediate the effects of service value on customer loyalty. In fact, service value is fully mediated when either positive switching costs or negative switching costs or both of them appear in the model (SV -> CL is insignificant in model 3, 4 and 5). Bootstrapping analysis results represented in Table 6 for model 5 confirm the results of our analysis based on the estimation of 4 mediating research models. As a result, H1, H4 is fully supported and H5 is partly supported.
Table 7 Bootstrapping results for testing mediating effects
Path Direct effect Indirect effect
SQ -> CS 0.240* - SV -> CS 0.720*** - SV -> NSC 0.620** - CS -> NSC 0.164 (ns) - SV -> PSC 0.620*** - CS -> PSC 0.344** - NSC -> CL 0.121** - PSC -> CL 0.383*** - SQ -> SV -> CS -> CL 0.038 (ns) 0.843 *** SV -> CS -> NSC/PSC-> CL -0.006 (ns) 0.843 *** CS -> NSC/PSC -> CL 0.586*** 0.151 *
Source: own study.
As indicated in Table 6, the f -squared analysis suggests that when testing separately positive switching cost have stronger effect on customer loyalty than the negative switching costs. The effect size of the positive switching cost is 0.3636 in model 3 which is large effect (> 0.35). While the effect of negative switching cost is 0.2883 in model 4 which is medium effect (> 0.15 and < 0.35). In addition, the strongest effect on customer loyalty is recorded when both positive switching costs and negative switching costs jointly influence the customer loyalty, which is 0.5.
These findings give us new insights on the relative effect size of each type of switching costs on customer loyalty. First, there are more than one ways to achieving the loyalty of customers. Some of the customers go with the conventional path: perceiving high quality in services => gaining high service value => forming satisfaction with banks => perceiving high losses in both benefits and emotions if leaving => customer loyalty. This path is consistent with the path in propose hypotheses H1, H4 and partly H5. In this path, the satisfaction and perceiving emotional losses can be seen as “customer bonding” stage where customer are more emotional related to their bank. In the other hand, the other customers go with less common path without forming the emotional stage like the previous part as: perceiving high quality in services => gaining high service value => perceiving high losses in both benefits if leaving => customer loyalty. This path fits with customers who put the economic benefits as the first condition for becoming loyalty. Second, the effect size analysis confirms that using both positive switching costs and negative switching costs are necessary to keep the customers stay with your banks. In addition, the portion of positive switching costs should be more emphasized rather than negative one although forming positive switching costs are more difficult and less certain.
Journal of International Studies Vol.10, No.1, 2017
24
3.5. Moderated Regression Analysis: switching costs’ moderating effects
The “moderating effect” model presented in Figure 1 is also subjected to structural equation modeling analysis in Amos for exploring the switching costs’ moderating effects. For executing the moderated regression analysis on Amos, the summated scores of each construct in the Model 1 are computed. Then, they are centered by their mean using SPSS 22. After that, the interaction between customer satisfaction, service value and two types of switching costs are calculated which represent the moderating effects of switching costs by interacting with customer satisfaction and service value. These mean-centered summated scores and interaction terms are used as the inputs for the structural equation modeling analysis. First, the initial model from the Model 1 are tested to see how well it fits with the data. Then, the initial model are adjusted to find the final model which have the adequate fit with the data. Finally, we conduct the moderated regression analysis on the adjusted models. The result of moderated regression analysis and the goodness of fit indexes are reported in Table 8.
Table 8 Bootstrapping results for testing moderating effects
Paths Coefficients p-value
SV -> CL -0.53 0.101(ns) CS -> CL 0.567 < 0.001*** PSC -> CL 0.324 < 0.001*** NSC -> CL 0.194 < 0.001*** SV*PSC -> CL -0.027 0.405(ns) SV*NSC -> CL 0.45 0.213(ns) CS*PSC -> CL 0.045 0.188(ns) CS*NSC -> CL -0.116 < 0.001*** χ2/df 0.072 NFI 0.997 CFI 0.995 TLI 0.954 RMSEA 0.004 R2 – CL’s explained variance 0.838
Source: own study.
According to the results from the Table 8, the only interactive terms which have statistically significant impacts on customer loyalty is CS*NSC. Therefore, only negative switching costs have moderating effects. However, the sign of the coefficient of the interactive term between customer satisfaction and negative switching costs is negative. This means that negative switching costs do not strengthen the relationship between customer satisfaction and customer loyalty but actually weaken it. As a result, none of the hypotheses H2 and H3 are supported. Both type of switching costs do not strengthen the relationship between service value, customer satisfaction and customer loyalty in retail banking context. These results are not so expected but with new approache in this paper by separating switching costs into two types, new findings might be accepted . Negative switching costs such as monetary pushnishment and procedural steps seem to make customers more determined to leave their banks and lower the effects of other good initiatives in the past which make customer satisfied. This reduce the chance for recovery action taken by the banks with these customers.
25
3.6. The moderated path analysis: interaction between types of switching costs
According to the previous results, positive switching costs and negative switching costs have their own roles on the satisfaction-loyalty linkages. Specifically, positive switching costs mediating this relationship while negative switching costs moderate it. For answering the questions how two types of switching costs interact with each other in this interrelationship to transform the effects of customer satisfaction to customer loyalty, the moderated path analysis approach are employed according to Edwards and Lambert (2007). The research model are depicted to illustrate the frameworks for the relationships in Figure 3 below. The moderated path analysis will integrate the moderating effects and mediating effects together. It will break the moderating effect into stages and study the moderating effects on all stages which are: moderating effects on the path CS -> PSC (the “first stage”), moderating effects on the path PSC -> CL (the “second stage”) and moderating effects (the “direct effect”) on direct path from CS -> CL. Therefore, the analysis will give the insights how the moderating effects work on each stage of the mediating effects. We also have the equations for each stage represented below:
First stage equation: PSC = a0 + a1 CS + a2 NSC + a3 CS*NSC + e1.
(1)
Second stage equation: CL= b0 + b1PSC + b2 NSC + b3 PSC * NSC + e2. (2)
Direct effect equation: CL = c0 + c1 CS + c2 NSC + c3 CS * NSC + e3.
(3)
Combine both (1), (2) and (3), we have the equation of the total effect of CS on CL:
CL = [b0 + (b2+ c2) NSC + (a0 + a2 NSC) (b1 + b3 NSC)] + [(c1 + c3 NSC) + (a1 + a3 NSC)
(b1 + b3 NSC)] CS + e2 + e3 + b1 e1 + b3 NSC * e1
(4)
The indirect effects of both stages of the mediating processes through positive switching costs are effected by negative switching costs, as indicated by the term (a1 + a3 NSC) (b1 + b3 NSC). The path representing the direct effect of X on Y is indicated by the term (c1 + c3 NSC). We use the bootstrap procedure in Edwards and Lambert (2007) to calculate these terms and test their statistical significances.
CS CL
PSC NSC
Figure 3. Moderated path analysis
1
ststage
2
ndstage
Direct effects
Figure 4. Total effect at high and low level of NSC
3 4 5 6 7 8 9 1 7 L oyalty Satisfaction Low NSC High NSC
Journal of International Studies Vol.10, No.1, 2017
26
The negative switching costs’ estimated high value (above one standard deviation from the mean) and estimated low value (below one standard deviation from the mean) are used to illustrate the moderating effects of negative switching costs. The results are represented in Table 9. According to the analysis, the moderating variables which are negative switching costs moderate both first and second stages of the mediating processes. Moreover, when combining two effects together, they have statistically significant indirect effects and total effects. The direct combined effects are valid at the low level of negative switching costs but not significant at high level of negative switching costs. In addition, there are clear distinctions between high and low value of negative switching costs regarding the combined direct effects and total effects but not indirect effects. From the value of these effects, it can be seen that the higher the value of negative switching costs, the lower the combined effects of customer satisfaction on customer loyalty. It is also true for the effects on first and second stages of the mediating processes which state that negative switching costs weaken the mediating effects of positive switching costs. The Figure 4 depicted the combined total effects of moderating and meditating effects at high and low level for illustrating this argument.
Table 9 Analysis of integration of moderating and mediating effects
Negative switching costs
Stage Effect
First Second Direct Indirect Total
Low 0.625*** 0.526*** 0.291*** 0.329*** 0.619***
High 0.457*** 0.720*** 0.012 0.329*** 0.341*
Differences -0.168** 0.194** -0.279*** 0.000 -0.279***
Source: own study.
Figure 4 shows that the slopes representing relationship between CS and CL is different at low and high level of NSC. For the low level of NSC, this slope is steeper and indicating stronger influences of customer satisfaction on customer loyalty. On the other hand, high level of NSC make the slope flatter and the total effect of customer satisfaction on customer loyalty decrease significantly. Especially, from the results in Table 9, the difference coming from only the direct effects of CS on CL. This means that the NSC and PSC are quite independent in the way they express their impacts on CL. Retail banking customers seems to realize very clearly the different between two type of switching costs and their impacts on their behavior. Customers treat positive switching costs as good initiatives from their banks and this make them more emotional related to their banks. Negative switching costs seems to make the relationships between customers and banks more difficult to develop from value- dependent relationship to more emotion-dependent one.
4. DISCUSSION AND CONCLUSION
Our findings contribute to the discussion about the impacts of different type of switching costs on customer loyalty by examining their roles in the complex interrelationship between service quality, service value, customer satisfaction and customer loyalty. This study provides the empirical evidences of their mediating and moderating effects proposed in different research models in banking industry context. This study adopts the view that the interrelationship between service quality, customer satisfaction, switching cost and customer loyalty are complex and contribute to the previous research in the field in some new aspects. First, in contrast to most of previous empirical studies in which switching costs are assumed as an
27 overall constructs of some different dimensions for testing the relationship with other constructs, the switching costs in this study are separated into two different constructs as positive switching cost (social and lost benefit) and negative switching cost (procedural). The results show that only negative switching cost moderates the satisfaction- loyalty relationship. In contrast, there are no significant evidences about moderating effect of positive switching costs on the service value- loyalty and satisfaction-loyalty relationships. These findings support the mixed results in previous studies about the moderating role of switching costs (Chen and Wang, 2009; Jones et al., 2007; Lam et al., 2004). While Lam et al. (2004) found no evidences about the moderating effects of switching costs, Chen and Wang (2009) found that switching costs moderate both core service quality to loyalty and satisfaction to loyalty relationships. Moreover, the negative switching cost moderates the satisfaction-loyalty relationship in the direction that dampens positive relationship between them (β = - 0.116). Furthermore, this study give new insights about the interaction between different types of switching costs by integrating the moderating effects of negative switching costs and mediating effects of positive one into the total effects model of satisfaction-loyalty relationships. The results of the moderated path analysis confirm that in total switching costs have positive mediating effects on the satisfaction-loyalty linkages. However, the stronger negative switching costs are, the weaker the mediating effects of positive switching costs on satisfaction-loyalty linkage are. In more detail, negative switching costs weaken the direct effect of customer satisfaction on customer loyalty but do not affect the indirect effects of customer satisfaction on customer loyalty through positive switching costs. It seems that the effects of negative switching costs and positive switching costs on customer loyalty are independent. This finding reinstates the new approach of separating positive switching costs and negative switching costs into two different constructs for examining the effects of switching costs on customer loyalty.
Previous studies which research about the relationship between customer satisfaction and customer loyalty have paid attention to customer trust, customer commitment, relationship quality, etc. as mediators (Huang et al., 2007; Kantsperger and Kunz, 2010; Kim and Han, 2008). In this study, switching costs also express their mediating role. This study provides empirically evidences that switching costs also mediate the interaction between service value, customer satisfaction and customer loyalty. The estimation of structural model in table 6 and bootstrapping results in table 7 reveal that the positive switching costs has mediating effects on both satisfaction-loyalty and service value- loyalty relationships. In more detail, positive switching cost partially mediates the satisfaction- loyalty relationships. This is the path where emotional bonding between customers and theirs service providers is the decisive and core elements to make them becoming loyalty customers. In this sense, positive switching costs can be the answers for developing this necessary emotional bonding rather than other traditional marketing constructs such as trust, commitment or relationship quality. These mediating processes have to be rooted in the service value and customer satisfaction when customers encounter with the service provider. Consequences, if there are large enough positive cumulative experiences with the current service providers, customer naturally or intentionally invests more in the relationship to achieve the interpersonal relationship with the service provider. Moreover, service provider also rewards the customer who invests more to it with extra benefit compare to other customers to keep him/her. This exchange through time can gradually develop to loyalty relationship. Customers and service providers both actively engage in this process which can be referred as co-creation value process in the marketing literature. This finding again supports the new approach for building long-term relationship between customer and service providers which views customer as a co-creator (Payne and Frow, 2005). Especially, the positive effect of service quality on customer loyalty is fully mediated by customer satisfaction and both type of switching costs. Therefore, together with customer satisfaction, switching costs can be one of the necessary steps to fully transform a service-satisfied customer to a loyalty
Journal of International Studies Vol.10, No.1, 2017
28
customer with more emotional bonding between customers and their banks. The results also show that negative switching costs also mediate the service value-loyalty relationship but not the satisfaction-loyalty relationship. This path of affecting customer loyalty is totally different from the previous path which depends on the emotional bonding development between customers and their banks. Customers in this path might be persuaded to stay with their banks as long as they received high service value and the loss created by negative switching costs high enough to delay their defection decision and hope for the recovery of high service value they expect to gain from their bank. But this type of loyalty might be temporary and customers hardly continue to purchase additional products in the future.
In addition, the effect size analyses suggest that the effect of positive switching costs is bigger that the effect of negative switching costs in term of explaining the variances of customer loyalty. This finding together with the negative impacts of negative switching costs on the mediating processes raise the question about the effectiveness of negative switching costs in the practice.
The final major contribution of this study is to bring up some of the most popular constructs in the relationship marketing literature, namely, service quality, service value, customer satisfaction, and customer loyalty together for testing their interrelation relationships in developing economics’ retail banking context. Although in different context, this study’s results also support some popular findings in previous studies in relationship marketing field (Caceres & Paparoidamis, 2007; Camarero Izquierdo et al., 2005; Cameran, Moizer, & Pettinicchio, 2010; Chodzaza & Gombachika, 2013), as indicated below:
– Service quality and service value is the antecedents of customer satisfaction.
– Service quality, service value and customer satisfaction are antecedents of customer loyalty.
– Customer satisfaction partially mediates the relationship between service quality, service value and customer loyalty.
Managerial implication
The findings of the current study have some implications for service providers and managers. First, managers should realize the different impacts of each type of switching costs. From the findings in this paper, positive switching cost and negative switching cost have very different impacts on customer loyalty. Each type of switching costs will lead to different way of affecting customer loyalty. Managers should realize the type of customer groups to apply the right type of switching costs. With customers who are seeking only for high value and financial benefit, high negative switching cost might be good in the short-term. For this type of customers, creating long-term customers are almost impossible and it will cost more than what the companies received. Therefore, short-term relationship is enough for this group of customers. On the other hand, customers who are seeking for long-term and win-win relationship with their service providers are worth for investing the positive switching costs initiatives. Second, the proportion of each type in the total use of switching costs should be carefully considered. Specifically, the use of negative switching cost or procedural cost for increasing customer loyalty should be reexamined. In fact, this study suggests that managers might want to reduce the administrative steps and fees for customer to end the relationship to enhance the satisfaction- loyalty linkage as the empirical results suggest. Moreover, bank manager should consider to developing and adopting more positive switching costs such as encourage employees to create interpersonal relationship with key customers or provided value-added benefits as prioritized treatments over average customers. Personalizing relationship with customers makes them feel that they are respected with equally position with the banks in the economic exchange between them. It also makes customers think they know more about service providers. Then, trust to service providers can be formed which increase the attitudinal loyalty. Offering more value-added benefits might increase cost but if bank managers consider
29 the benefits of keeping loyalty customers, it will be worthy in the long-term. The most important implication which reveals in this study is that managers should realize that switching costs is not only an external factor in the satisfaction-loyalty relationship with their moderating effects but it is one of the internal factors in the cause-effects chain from service value to customer satisfaction and then to loyalty. It becomes a requisite part for the whole interrelationship process which starts from service quality and ends with customer loyalty. These findings might inform managers to better understand their customers. In this case, the following up actions from service providers to build specific positive switching costs such as interpersonal relationships or rewarded financial benefits might dramatically increase customer loyalty. In addition, although showing negative impacts in their moderating effects but negative switching costs should not be removed completely because they still have the positive mediating effects from service value to customer loyalty. This finding suggests that manager should still keep procedural costs as a limited and adequate level to prevent customers being attractive too easily by other competitors. It allows service providers to buy time for recovering the customers on the edge of leaving.
CONCLUSION
This paper takes a new approach to examine the impacts of switching costs on customer loyalty by separating the switching costs into positive one and negative one. By proving empirical evidences about their moderating and mediating effects, this paper shows that there are significant differences between two type of switching costs and managers should use them properly according to the type of customer loyalty they pursue and type of customers they are dealing with. According sto the results of this study, positive switching costs show very clear mediating effects on both service value- loyalty and satisfaction-loyalty relationships. On the other hand, negative switching costs only have mediating effects on service value- loyalty relationship but they show negative moderating effects on satisfaction-loyalty one. In addition, negative switching costs also weaken the mediating effects of positive switching costs on satisfaction-loyalty relationship.
LIMITATIONS AND FUTURE RESEARCHES
As is the case of most of research project, this study also represents some limitations should be considered. First, the measurement scales which are used for measuring service quality, customer satisfaction are not so optimal for the purpose of the research. Service quality and customer satisfaction should be measured with more completed instruments which are suggested in the literature such as SERVQUAL or National Customer Satisfaction Index methods. Unfortunately, because of the limited resources and such data are often difficult and costly to collect, this study use the direct scale to measure service quality and customer satisfaction. Second, the results presented in this study are based on the analysis of causal model with cross-sectional data. It is not optimal because the time orders of the constructs are ignored which are one of the important elements for causal model analysis. Therefore, definite evidence of causal effect cannot be inferred. Future research should attempt to collect pooled time series and cross-sectional data for investigating the objectives of this study. Finally, the relationship between the actual financial performance of each customer, his/her loyalty and switching costs should be targeted for the future research to improve the validity of this study’s findings which are very important to practitioners.