Sex differences in oncogenic mutational processes
Constance H. Li
1,2,3, Stephenie D. Prokopec
1, Ren X. Sun
1,4, Fouad Yousif
1, Nathaniel Schmitz
1, PCAWG
Tumour Subtypes and Clinical Translation*, Paul C. Boutros
2,3,4,5,6,7,8✉
& PCAWG Consortium*
Sex differences have been observed in multiple facets of cancer epidemiology, treatment and
biology, and in most cancers outside the sex organs. Efforts to link these clinical differences
to speci
fi
c molecular features have focused on somatic mutations within the coding regions
of the genome. Here we report a pan-cancer analysis of sex differences in whole genomes of
1983 tumours of 28 subtypes as part of the ICGC/TCGA Pan-Cancer Analysis of Whole
Genomes (PCAWG) Consortium. We both con
fi
rm the results of exome studies, and also
uncover previously undescribed sex differences. These include sex-biases in coding and
non-coding cancer drivers, mutation prevalence and strikingly, in mutational signatures related to
underlying mutational processes. These results underline the pervasiveness of molecular sex
differences and strengthen the call for increased consideration of sex in molecular cancer
research.
https://doi.org/10.1038/s41467-020-17359-2
OPEN
1Computational Biology Program, Ontario Institute for Cancer Research, Toronto, ON, Canada.2Department of Medical Biophysics, University of Toronto,
Toronto, ON, Canada.3Department of Human Genetics, University of California, Los Angeles, CA, USA.4Department of Pharmacology & Toxicology,
University of Toronto, Toronto, ON, Canada.5Vector Institute for Artificial Intelligence, Toronto, Canada.6Department of Urology, University of California,
Los Angeles, CA, USA.7Jonsson Comprehensive Cancer Center, University of California, Los Angeles, CA, USA.8Institute for Precision Health, University of
California, Los Angeles, CA, USA. *List of authors and their affiliations appears at the end of the paper.✉email:[email protected]
123456789
S
ex disparities in cancer epidemiology include an increased
overall cancer risk in males corresponding with higher
incidence in most tumour types, even after adjusting for
known risk factors
1,2. Cancer mortality is also higher in males,
due in part to better survival for female patients in many cancer
types, including those of the colon and head and neck
3.
Inter-estingly, female colorectal cancer patients respond better to
sur-gery
4and adjuvant chemotherapy, though this is partially due to
biases in tumour location and microsatellite instability
5. Similarly,
premenopausal female nasopharyngeal cancer patients have
improved survival regardless of tumour stage, radiation or
che-motherapy regimen
6. There is a growing body of evidence for sex
differences in cancer genomics
7–12, but their molecular origins
and clinical implications remain largely elusive.
Previous studies have mostly focused on protein coding
regions, leaving the vast majority of the genome unexplored. We
hypothesise that there are uncharacterised sex differences in the
non-coding regions of the genome. Using data from the
Pan-cancer Analysis of Whole Genomes (PCAWG) project
13, we
perform a survey of sex-biased mutations in 1983 samples (1213
male, 770 female) from 28 tumour subtypes, excluding those of
the sex organs (Supplementary Data 1). The PCAWG
Con-sortium aggregated whole-genome sequencing data generated by
the ICGC and TCGA projects. These data were re-analysed with
standardised, high-accuracy pipelines to align to the human
genome (reference build hs37d5). Our study leverages mutation
calls generated by PCAWG working groups
13–16to identify
molecular associations with sex. We exclude the X and Y
chro-mosomes to focus on autosomal sex differences in cancers
affecting both men and women, but there are known to be
sig-ni
fi
cant X-chromosome mutational differences between tumours
arising in men and women
8. Our analysis reveals sex differences
in speci
fi
c genes and in genome-wide phenomena including
mutation signature activity. These sex-biases occur not only at the
pan-cancer level across all 1983 tumours, but also in individual
tumour subtypes.
Results
Sex-biases in driver genes, mutation load and tumour
evolu-tion
. We began by investigating sex differences in driver gene
mutation frequencies, focusing on 165 coding and nine
non-coding mutation events
14(Supplementary Data 2). We used
proportion tests to identify candidate sex-biased events with a
false discovery rate (FDR) threshold of 10%. These putative
sex-biased events were modelled using logistic regression (LGR) to
adjust for tumour subtype-speci
fi
c variables (model
descrip-tions and variable breakdown in Supplementary Data 1).
Finally, we vetted these sex-biased events in two ways: we
assessed the impact of covariate imbalances in the data using
repeated down-sampling analysis; we also implemented
exten-ded regression models to adjust for additional variables like
stage or grade, which were only available for a greatly reduced
subset of the data (see
“
Methods
”
section). We con
fi
rmed that
all sex-biases remained signi
fi
cant under this additional
scru-tiny. This statistical framework formed the basis for our
ana-lysis of all genomic features.
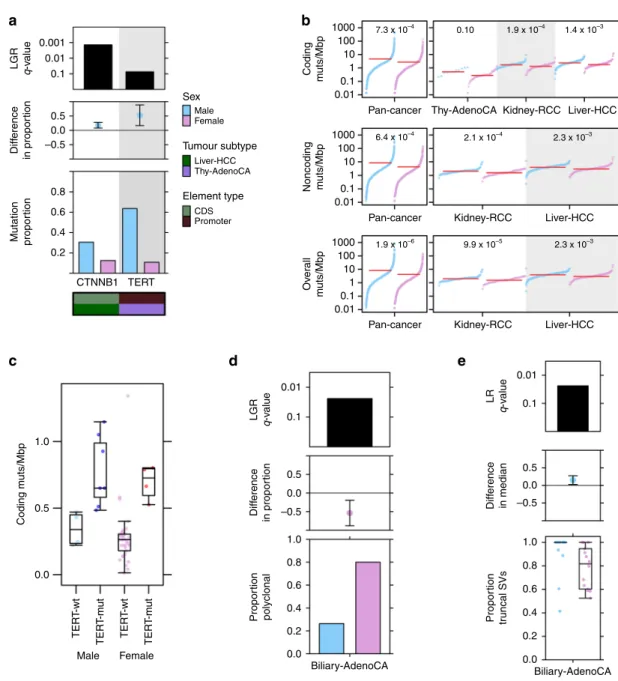
Tumour subtype-speci
fi
c sex-biased driver mutations included
CTNNB1
mutation frequency in liver hepatocellular cancer
(Liver-HCC), with more male-derived samples harbouring
CTNNB1
mutations: (male: 31%, female: 13%, 95% CI: 8.1
–
28%, prop-test
q
=
0.048, LGR
q
=
1.4 × 10
−3, Fig.
1
a, Supplementary Fig. 1). This
mirrors our previous
fi
nding of sex-biased
CTNNB1
mutation
frequency in liver cancer from TCGA exome sequencing data,
with similar effect sizes (male: 33% vs. female: 12%
11). We also
identi
fi
ed a large sex-disparity in a non-coding driver event in
thyroid cancer (Thy-AdenoCA):
TERT
promoter mutations were
observed in 64% of male-derived samples compared with only
11% of female-derived samples (95% CI: 17
–
89%, prop-test
q
=
6.9 × 10
−3, LGR
q
=
0.074, Fig.
1
a, Supplementary Fig. 1), again
supporting a previous
fi
nding
17. We did not
fi
nd pathogenic
germline variants in
TERT
or
CTNNB1
that might bias the
detection of sex-associated somatic mutations in these genes.
Other putative sex-biased events were detected, but were either
not statistically signi
fi
cant after multivariate adjustment at present
sample sizes (Supplementary Data 2), or were attributed to
over-represented tumour subtypes (Supplementary Fig. 2).
Our previous work
11found sex-biased mutation density across
a number of tumour subtypes, including cancers of the liver,
kidney and skin. We therefore investigated mutation density here
to identify tumour subtypes where the cancer genomes of one sex
accumulate more somatic single nucleotide variants (SNVs) than
those of the other sex. Returning to our statistical framework, we
fi
rst used Mann
–
Whitney
U
-tests to identify putative sex-biases,
and then applied multivariate linear regression (LNR) on
Box
–
Cox transformed mutation load to adjust for possible
confounders. The Box
–
Cox transformation applies a power
function to modify the shape of a variable
’
s distribution to better
approximate a normal distribution. It preserves monotonicity and
is often applied to make data more suitable for regression analysis
(see
“
Methods
”
section). We also compared the total number
of somatic SNVs and further divided mutations by coding and
non-coding SNVs to determine whether sex-biases may be
in
fl
uenced by speci
fi
c genomic contexts. Across all pan-cancer
samples, we identi
fi
ed higher mutation prevalence in
male-derived samples in all three contexts (coding LNR
q
=
7.3 × 10
−4,
non-coding LNR
q
=
6.4 × 10
−4, overall LNR
q
=
1.9 × 10
−6;
Supplementary Data 3). These sex-biases remained signi
fi
cant
even after adjusting for tumour subtype, ancestry and age in
multivariate analysis, and after evaluating the effects of
imbalanced tumour subtype and sex sample sizes (Fig.
1
b, left;
Supplementary Figs. 2, 3).
We investigated somatic SNV burden in each of the 23
individual tumour subtypes with at least 15 samples (
n
male+
n
female≥
15), applying the same statistical approach using tumour
subtype-speci
fi
c models (Supplementary Data 1). We found
sex-biased mutation load in three tumour subtypes (Fig.
1
b, right),
with trending higher male coding mutation load in thyroid cancer
(difference in location
=
0.26 mut/Mbp, 95% CI
=
0.12
–
0.43
mut/Mbp,
U
-test
q
=
0.028, LNR
q
=
0.10), and higher male SNV
load in hepatocellular cancer and kidney renal cell cancer
(Kidney-RCC) for all three genomic contexts (Supplementary
Data 3). We compared the group rank differences of coding and
non-coding mutation load between the sexes and found that in
renal cell cancer, the differences were similar at 0.40 mut/Mbp for
non-coding mutations and 0.37 mut/Mbp for coding mutations.
In hepatocellular cancer however, the median sex-difference in
non-coding mutation load was higher than the difference in
coding mutation load (non-coding difference
=
0.84 mut/Mbp vs.
coding difference
=
0.53 mut/Mbp). There was a similar effect for
pan-cancer mutations (non-coding difference
=
0.60 mut/Mbp
vs. coding difference
=
0.41 mut/Mbp) suggesting mutation
context may have a role in sex-biased SNVs in some tumour
subtypes.
On detecting sex differences in both the mutation frequency
of speci
fi
c drivers as well as SNV density in the same tumour
subtypes, we asked whether one may bias the other. For
instance, higher
CTNNB1
mutation frequency in male-derived
tumours may simply be due to more mutations occurring in
those same samples. We therefore looked for associations
between SNV burden with
CTNNB1
mutation in hepatocellular
cancer, and with
TERT
promoter mutation in thyroid cancer.
We did not
fi
nd a signi
fi
cant association between SNV burden and
CTNNB1
mutation in hepatocellular cancer. In thyroid cancer
however,
TERT
promoter mutation was associated with increased
overall mutation burden (medianTERT-wt
=
0.32 mut/Mbp vs.
medianTERT-mut
=
0.82 mut/Mbp,
U
-test
p
=
7.9 × 10
−8). We
further con
fi
rmed the association using a linear regression model
(linear regression
p
TERT=
2.4 × 10
−5,
p
sex=
0.37, Fig.
1
c). To
assess whether the sex-bias in
TERT
promoter mutation
frequency might be due to sex-biased accumulation of SNVs,
we examined tumour-matched mutation timing data generated
by the PCAWG consortium
15. We found that of eleven polyclonal
samples with
TERT
promoter mutations, nine of these were
earlier occurring truncal events.
We continued investigating whether sex-biased driver
muta-tions might occur at different stages of tumour evolution between
men and women and examined tumour subclonal architecture.
Focusing only on thyroid tumours with
TERT
promoter
mutations and liver tumours with
CTNNB1
mutations, we
compared the proportions of polyclonal vs. monoclonal tumours
between the sexes (Supplementary Fig. 4). We did not
fi
nd
sex-biased polyclonality in
TERT
promoter-mutated tumours, but did
detect a putative bias in the proportion of polyclonal
CTNNB1
-mutated tumours (80% of male-derived tumours are polyclonal
vs. 46% of female-derived tumours, 95% CI
=
−
0.019
–
0.70,
prop-test
p
=
0.039). We therefore accounted for polyclonality when
comparing the timings of the mutations in these driver events. On
0.001 1000 7.3 x 10⁻⁴ 6.4 x 10⁻⁴ 1.9 x 10⁻⁴ 1.9 x 10⁻⁶ 9.9 x 10⁻⁵ 2.1 x 10⁻⁴ 2.3 x 10⁻³ 2.3 x 10⁻³ 0.10 1.4 x 10⁻³ 100 1 0.1 0.01 Pan-cancer Pan-cancer Thy-AdenoCA Kidney-RCC Kidney-RCC Liver-HCC Liver-HCC
Pan-cancer Kidney-RCC Liver-HCC
Coding m uts/Mbp Coding m u ts/Mbp Noncoding muts/Mbp Ov er all m uts/Mbp 10 1000 100 1 0.1 0.01 10 1000 100 1 0.1 0.01 10 LGR q -v alue Diff erence in propor tion Mutation propor tion LGR q -v alue Diff erence in propor tion Propor tion polyclonal
a
c
d
e
b
0.01 0.1 –0.5 0.8 0.6 0.4 0.2 1.0 0.5 0.0 Male TER T -wt TER T -m u t TER T -wt TER T -m u t Female CTNNB1 TERT 0.5 Sex Tumour subtype Element type Male Female Liver-HCC CDS Promoter Thy-AdenoCA 0.0 –0.5 1.0 0.8 0.6 0.4 0.2 0.0 1.0 0.8 0.6 0.4 0.2 0.0 Biliary-AdenoCA Biliary-AdenoCA 0.5 0.01 0.1 LR q -v alue 0.01 0.1 0.0 Diff erence in median Propor tion tr uncal SVs –0.5 0.5 0.0Fig. 1 Sex-biases in mutation frequency of driver genes, SNV density and tumour evolution. aFrom top to bottom, each plot shows the logistic
regressionq-value for the sex effect; difference in proportion of mutated samples between the sexes with blue denoting male-dominated bias; and mutation proportion for each gene. Covariate bars indicate mutation context and tumour subtype of interest.bThe burden of somatic SNVs for coding, non-coding and overall mutation load. Linear regressionq-values are shown.cCoding mutation load for thyroid adenocarcinoma samples compared by sex and presence or absence ofTERTpromoter mutations.dThe proportion of polyclonal samples andethe proportion of truncal structural variants in biliary cancer. Tukey boxplots are shown with the box indicating quartiles and the whiskers drawn at the lowest and highest points within 1.5 interquartile range of the lower and upper quartiles, respectively. Error bars show the 95% confidence interval for the difference in proportions or medians between the sexes.
subsequently examining the frequency of clonal vs. subclonal
driver mutation events between the sexes, we found that while
there were differences in the proportions of truncal mutations
(e.g. 100% of
TERT
promoter mutations were truncal events in
male-derived vs. 50% truncal events in female-derived thyroid
cancer patients), no comparisons were statistically signi
fi
cant.
We expanded our clonality analysis to perform a general
survey of clonal structure and mutation timing across all tumour
subtypes and mutations (Supplementary Data 4). We found that
female-derived
biliary
adenocarcinoma
(Biliary-AdenoCA)
tumours were frequently polyclonal, whereas most male-derived
tumours were monoclonal (26% male-derived samples are
polyclonal vs. 80% female-derived, 95% CI
=
19
–
88%, prop-test
q
=
0.063, LGR
q
=
0.026; Fig.
1
d). In addition, we found
intriguing evidence suggesting there may be sex differences in
the mutation timing of structural variants (SVs) in this tumour
subtype. Structural variants in male-derived samples were more
frequently truncal events than in female-derived samples (median
male percent truncal SVs
=
100% vs. median female
=
82%, 95%
CI
=
0.9
–
32%,
U
-test
q
=
0.081, LNR
q
=
8.6 × 10
−3; Fig.
1
e).
Though other comparisons did not reach our statistical
signi
fi
cance threshold, we found some interesting trends that
may merit future study, including in oesophageal cancer
(Eso-AdenoCA) where SVs in female-derived samples were more
frequently truncal events while SVs in male-derived samples
occurred more frequently in subclones (median male percent
truncal SVs
=
55%, median female
=
100%; Supplementary
Fig. 5), and in medulloblastoma, where insertion-deletions
(indels) were more frequently truncal events in female-derived
samples than male (median male percent of truncal indels
=
65%,
median female proportion of truncal indels
=
70%;
Supplemen-tary Fig. 6). Our analysis of sex differences in tumour evolution
identi
fi
ed some sex-biased events and hint at putative sex-biases
that should be further explored in future analyses.
Sex-biases in genome instability and CNAs
. Next, we examined
percent genome altered (PGA), which provides a summary of
copy number aberration (CNA) load. A proxy for genome
instability, PGA is a complementary measure of mutation density
to somatic SNV burden. Although we did not
fi
nd associations
between sex and autosome-wide PGA, we observed sex-biases in
the copy number burden for speci
fi
c chromosomes (Fig.
2
a). In
pan-cancer analysis, male-derived samples exhibited a slight but
signi
fi
cant higher percent chromosome altered for chromosome
7 even after accounting for tumour subtype, ancestry and age
(median male PGA-7
=
5.4%, median female PGA-7
=
0.37%,
95% CI
=
9.4 × 10
−4–
2.4 × 10
−3%,
U
-test
q
=
5.0 × 10
−3, LNR
q
=
0.024; Supplementary Data 5). In individual tumour subtypes,
we found sex-biased PGA in renal cell cancer (chromosomes 7 &
12) and hepatocellular cancer (chromosomes 1 & 16). On further
scrutinising these sex-PGA associations using extended models,
we found that grade was a likely confounder in renal cell cancer,
though the sex effect after correcting for this variable was still
trending (extended LNR
q
=
0.17). By looking at copy number
gains and losses separately, we additionally identi
fi
ed
chromo-somes with sex-biases in the burden of copy number gains and
losses (Supplementary Fig. 7 and Supplementary Data 5),
including sex-biased percent copy gained on chromosomes 5, 8
and 17 in pan-cancer tumours. These biases in chromosome
instability were robust to imbalanced sex sample sizes
(Supple-mentary Fig. 8).
We next compared CNA frequency on the gene level to
identify speci
fi
c genes lost or gained at sex-biased rates.
Across all pan-cancer samples, we found 2,502 genes with
sex-biased gains across 13 chromosomes (LGR
q
-value < 10%, Fig.
2
b,
Supplementary Data 6, 7, Supplementary Figs. 2, 9), These genes
were all more frequently gained in male-derived samples than
female, with differences in copy number gain frequency up to
10% on chromosomes 7 and 8. Genes with male-dominated copy
number gains include the oncogene
MYC
(male gain frequency
=
37% vs. female gain frequency
=
28%, 95% CI
=
5.2
–
14%,
prop-test
q
=
2.5 × 10
−3, LGR
q
=
0.068). The driver
CTNNB1
was also
more frequently gained in male samples (male gain frequency
=
8.9% vs. female gain frequency
=
5.2%, 95% CI
=
1.4
–
6.1%,
prop-test
q
=
0.016, LGR
q
=
0.053). We did not
fi
nd pan-cancer
sex-biased copy number losses.
We repeated this analysis for every tumour subtype
indepen-dently and found sex-biased CNAs in renal cell and
hepatocel-lular cancer (Supplementary Data 6 and 7). In renal cell cancer
(Kidney-RCC), 1,986 sex-biased gains all occurred more
frequently in male-derived samples, with differences in frequency
up to 35% (Fig.
2
c). They spanned across chromosomes 7 and 12,
agreeing with our
fi
nding of male-dominated genome instability
in these chromosomes (Fig.
2
a; Supplementary Fig. 7). Using an
extended renal cell cancer model accounting for grade, we
obtained a high con
fi
dence set of 969 genes altered by sex-biased
gains (extended model
q
< 0.1), with the remaining 1017 genes
having a trending sex effect (extended model
q
< 0.17). In contrast
to the male-dominated gains in pan-cancer and renal cell
fi
ndings, we found higher female frequency of copy number
losses in hepatocellular cancer (Fig.
2
d). We identi
fi
ed 2226 genes
with higher copy number loss rates in female-derived samples. As
observed in renal cell cancer some of these losses span whole
chromosomes, in this case chromosomes 3 and 16. Extended
modelling in Liver-HCC incorporating stage and grade resulted
in a list of 1797 high con
fi
dence sex-biased genes (extended
model
q
< 0.1).
The concurrence between sex-biased PGA and gene-speci
fi
c
events in renal cell and hepatocellular cancer suggested that
PGA could be used to guide identi
fi
cation of additional
sex-biased CNAs on the gene level. We more closely examined
regions of interest in tumour subtypes of that did not have
sex-biased CNAs in our general CNA analysis, but did have
putatively sex-biased genome instability (
U
-test
q
< 0.2): biliary
cancer, B-cell non-Hodgkin lymphoma (Lymph-BNHL), and
chronic lymphocytic leukaemia (Lymph-CLL). We identi
fi
ed an
additional 203 genes on the p-arm of chromosome 8 that were
more frequently lost in female-derived biliary tumours
(Supplementary Fig. 10). These copy number losses were 50%
more common in female-derived tumours and affect genes such
as
DLC1
, a known tumour suppressor gene in hepatocellular
cancer that is thought to have a similar role in gallbladder
cancer
18. Although we did not identify additional sex-biased
CNAs in non-Hodgkin lymphoma, chronic lymphocytic
leukaemia or melanoma, our sex-biased PGA results suggest
these as regions of interest for future work.
Sex-biases in mutational signatures
. We hypothesised that sex
differences in mutation density and tumour evolution
char-acteristics might be driven by sex differences in mutational
pro-cesses. In addition to single base substitution (SBS) signatures,
which have been well annotated and linked to tumour
aetiology
19,20, we also examined doublet base substitution (DBS)
and small insertion-deletion (ID) signatures. Sex differences in a
mutational signature could shine insight on molecular differences
between the sexes. For each of 47 validated PCAWG SBS, 11 DBS
and 17 ID signatures
16, we performed a two-stage analysis. We
fi
rst compared the proportions of signature-positive samples
between the sexes; that is, we looked at the proportions of samples
with any mutations attributed to the signature to determine
whether there was a relationship between each signature and sex.
Then, we focused on signature-positive samples and compared
the percentage of mutations attributed to each signature between
the sexes to assess relative signature activity. For both analyses
we used univariate techniques to identify putative events, adjusted
for additional variables using linear models with SNV density as
a variable, and compared the distributions of attributed mutations
with Kolmogorov
–
Smirnov tests. We also evaluated hits using
the added scrutiny of down-sampling and extended regression
models (see
“
Methods
”
section; Supplementary Figs. 11, 12).
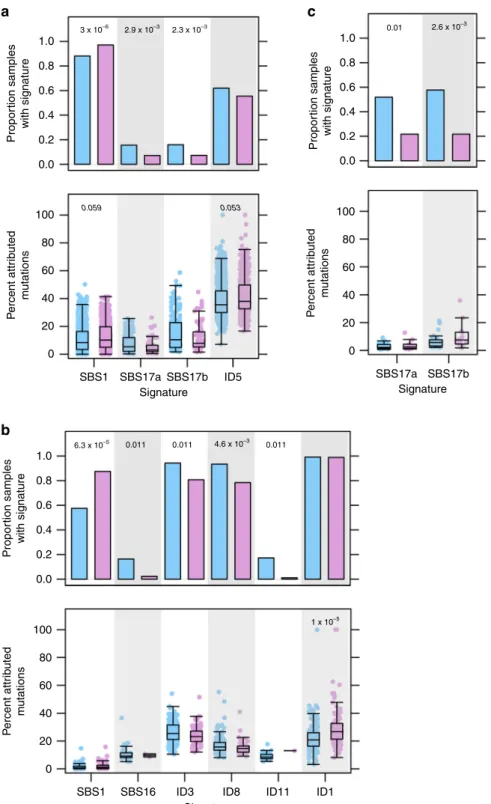
At the pan-cancer level, we identi
fi
ed three signatures that
occurred more frequently in one sex over the other (Fig.
3
a;
Supplementary Data 8). SBS1 was more commonly detected in
derived samples (88% of male-derived vs. 97% of
female-derived,
χ
2-test
q
=
9.2 × 10
−10, LGR
q
=
3.0 × 10
−6) and was also
associated with higher signature activity in these samples (male
median percent mutations attributed to SBS1
=
8.6%, female
median
=
10%,
U
-test
q
=
5.5 × 10
−3, LNR
q
=
0.059).
Con-versely, signatures SBS17a and SBS17b were detected in a larger
proportion of male-derived samples (16% of male-derived vs.
Pan-cancer
a
b
c
d
Biliary-AdenoCA Bladder-TCC Bone-Osteosarc CNS-GBM CNS-Medullo CNS-Oligo CNS-PiloAstro ColoRect-AdenoCA Eso-AdenoCA Head-SCC Kidney-ChRCC Kidney-RCC Liver-HCC Lung-AdenoCA Lung-SCC Lymph-BNHL Lymph-CLL Myeloid-MPN Panc-AdenoCA Panc-Endocrine Skin-Melanoma Stomach-AdenoCA Thy-AdenoCA 1 >0.001 0.01 0.1 1 2 3 4 5 6 7 8 9 10 12 14 11 13 15 17 19 21 (Autosomal) PGA 16 18 20 22 0.4 Pan-cancer (n = 1949) Liver-HCC (n = 314) Kidney-RCC (n = 143) 10–2 Sex Tumour type Thy-AdenoCA CNS-PiloAstro CNS-Medullo Panc-Endocrine Panc-AdenoCA Skin-Melanoma Lung-SCC Lung-AdenoCA Liver-HCC CNS-Oligo Kidney-RCC Kidney-ChRCC Head-SCC CNS-GBM Stomach-AdenoCA Eso-AdenoCA Lymph-BNHL ColoRect-AdenoCA Myeloid-MPN Lymph-CLL Biliary-AdenoCA Bone-Osteosarc Bladder-TCC 1 2 3 4 5 6 7 8 9 10 11 Neutral Gain Sex Sex Male (n = 226) Female (n = 88) Male (n = 90) Female (n = 53) EUR (n = 44) ASN (n = 266) AFR (n = 3) SAN (n = 0) AMR (n = 1) EUR (n = 122) ASN (n = 3) AFR (n = 14) SAN (n = 0) AMR (n = 3) 84 38 NA LICA-FR (n = 5) LIHC-US (n = 53) LINC-JP (n = 28) LIRI-JP (n = 228) 89 23 NA Ancestry Ancestry Age Project Age Loss Neutral Gain Loss 12 14 16 17 18 19 20 22 1 2 3 4 5 6 789 10 11121315 16 17 18 19 2022 1 2 3Loss Neutral Gain 4 5 6789 10 11121315 16 17 18 19 2022 Male Female 10–1 10–5 10–1 10–5 10–1 10–2 10–1 1.0 0.1 0.5 0.0 0.0 –0.1 q q Prop 1 0.5 0 Prop Gains Losses Cop y n umber profile Δ Prop 0.1 0 –0.1 1.0 q Gains Losses Cop y n umber profile Cop y n umber profile q Prop Prop Δ Prop Δ Prop 0.5 0.0 1.0 0.5 0.0 0.3 0.0 –0.3 Avg male Avg female 0.3 –0.3 0.0 10–3 10–1 10–3 10–1 1.0 q Gains Losses q Prop Prop Δ Prop Δ Prop 0.5 0.0 1.0 0.5 0.0 0.3 0.0 –0.3 Avg male Avg female 0.3 –0.3 0.0 Δ Prop 0.2 0 –0.2 –0.4
Fig. 2 Sex-biases in percent chromosome altered are reflected in gene-specific events. aA summary of associations between sex and genome instability
across tumour subtypes. Dot size shows difference in median percent genome altered or percent chromosome altered between the sexes. Dot colour shows direction of bias, with blue indicating higher instability in male-derived tumours and pink indicating higher instability in female-derived tumours. Background shading showsq-values from multivariate linear regression. Sex differences in CNAs forbpan-cancer,ckidney renal cell cancer, and dhepatocellular cancer. Each plot shows, from top to bottom: theq-value showing significance of sex from multivariate linear modelling with yellow/green points corresponding to 0.1 <q< 0.05, deep blue/red points corresponding toq< 0.05, and grey points indicating hits that were attributed to covariate sample size imbalances and rejected; the proportion of samples with aberration; the difference in proportion between male and female groups for copy number gain events; the same repeated for copy number loss events; and the copy number aberration (CNA) profile heatmap. The columns represent genes ordered by chromosome. Light blue and pink points represent data for male- and female-derived tumours respectively.
7.2% of female-derived). SBS1 is thought to be caused by
deamination of 5-methylcytosine to thymine, resulting in base
substitutions. Signatures SBS17a and SBS17b are of unknown
aetiology. We also identi
fi
ed a sex-bias in indel signature ID5,
which had higher activity in female-derived tumours (male
median percent attributed mutations
=
35%, female median
=
38%,
U
-test
q
=
1.1 × 10
−3, LNR
q
=
0.053). ID5 mutations are
clock-like and may accumulate in normal cells. Both SBS1 and
ID5 are correlated with age, but our multivariate model accounts
for this variable and sex-bias remains signi
fi
cant.
Since mutational processes are disease-speci
fi
c, we repeated the
mutational
signatures analysis in each tumour subtype.
We identi
fi
ed six sex-biased signatures in hepatocellular
cancer (Fig.
3
b; Supplementary Data 8). We again detected a
a
b
c
1.0 Propor tion samples with signature Propor tion samples with signature P ercent attr ib uted m utations Propor tion samples with signature 3 x 10⁻⁶ 6.3 x 10⁻⁵ 1 x 10⁻⁵ 4.6 x 10⁻³ 0.011 0.011 0.011 2.9 x 10⁻³ 2.6 x 10 –3 2.3 x 10⁻³ 0.01 0.8 0.6 0.4 0.2 0.0 1.0 0.8 0.6 0.4 0.2 0.0 100 80 60 40 0.059 0.053 20 0 P e rcent attr ib uted m u tations 100 80 60 40 20 0 SBS1 SBS16 ID3 SignatureID8 ID11 ID1
SBS1 SBS17a Signature Signature SBS17b ID5 SBS17a SBS17b P ercent attr ib uted m utations 100 80 60 40 20 0 1.0 0.8 0.6 0.4 0.2 0.0
Fig. 3 Sex differences in mutational signatures related to mutational processes.Comparisons between proportions of signature-positive samples (top)
and signature activity (bottom) forapan-cancer comparisons,bliver hepatocellular cancer, andcB-cell non-Hodgkin lymphoma. FDR-adjustedq-values for multivariate logistic regression (top) and multivariate linear regression (bottom) shown only for significant comparisons. Blue shows male- and pink shows female-derived tumours. Tukey boxplots are shown with the box indicating quartiles and the whiskers drawn at the lowest and highest points within 1.5 interquartile range of the lower and upper quartiles, respectively.
female-dominated bias in the proportion of SBS1-positive
samples (58% of male-derived vs. 88% of female-derived,
χ
2-test
q
=
3.5 × 10
−5, LGR
q
=
6.3 × 10
−5). We also detected a
male-dominated bias in SBS16 (16% of male-derived vs. 2.2% of
female-derived,
χ
2-test
q
=
9.8 × 10
−3, LGR
q
=
0.011). A
pre-vious study
21described this sex-biased signature and an
association between more
CTNNB1
mutations and higher activity
of SBS16 in an independent dataset; these
fi
ndings agree with
what we report here for PCAWG data. There were also four
sex-biased ID signatures in hepatocellular cancer: ID3 (94% of
male-derived vs. 81% of female-male-derived,
χ
2-test
q
=
5.0 × 10
−3, LGR
q
=
0.011), ID8 (93% of male-derived vs. 78% of female-derived,
χ
2-test
q
=
3.5 × 10
−3, LGR
q
=
4.6 × 10
−3) and ID11 (17% of
male-derived vs. 1.1% of female-male-derived,
χ
2-test
q
=
3.5 × 10
−3, LGR
q
=
0.011) occurred more frequently in male-derived samples. ID3
is associated with tobacco smoke, and ID8 with double-stranded
break repair. ID11 has unknown aetiology. Although ID1 was
detected at similar rates between the sexes, a greater proportion of
ID1-attributed mutations were found in federived than
male-derived samples (male median percent mutations attributed to ID1
=
21%, female median
=
27%,
U
-test
q
=
2.4 × 10
−6, LR
q
=
1.0 ×
10
−5). Using our extended hepatocellular model to further
scrutinise these signatures, we found that all remained sex-biased
after accounting for these variables except in ID3, where the effect
was trending (extended model
q
-value
=
0.12). Mutations
associated with ID1 are thought to result from slippage during
DNA replication and are associated with defective DNA mismatch
repair, suggesting that while male- and female-derived tumours
harbour defective DNA repair at similar rates, it is responsible for a
larger proportion of mutations in female-derived tumours.
Taken together, sex-biases in the aetiology underlying the
molecular landscape of hepatocellular cancer begin to emerge. In
this tumour subtype, spontaneous or enzymatic deamination of
5-methylcytosine to thymine and defective mismatch repair occur
more frequently in female patients and are also responsible for
more mutations. Conversely, tobacco smoking is more common in
male patients though the number of mutations attributed to
tobacco smoke is not different between the sexes; this leads to more
tobacco-associated male hepatocellular tumours.
In B-cell non-Hodgkin lymphoma, we identi
fi
ed signi
fi
cant
differences in the proportions of SBS17a- and SBS17b-positive
tumours (Fig.
3
c; Supplementary Data 8). More male-derived
samples had mutations associated with these signatures. There
were also several intriguing sex differences in mutational
signatures that did not meet our signi
fi
cance threshold. For
instance in thyroid cancer, DBS2 accounts for a higher percentage
of mutations in male-derived samples (male median percent
mutations attributed to DBS2
=
50%, female median
=
33%,
Supplementary Data 8). The association of DBS2 with tobacco
smoking suggests that future insight in this signature may provide
molecular explanations for the sex-speci
fi
c associations between
smoking and thyroid cancer risk
22. As the aetiologies of these
mutational signatures become better known, we can better
understand how underlying mutational processes lead to
molecular sex-biases. We may also be able to discern
environ-mental and lifestyle factors even in the absence of reported data,
allowing us to better account for confounding factors.
Finally, to ensure that our
fi
ndings were not skewed by
differences in sequencing quality, we checked for sex-biases in
quality control (QC) metrics. These included comparing the
coverage, read length, and overall quality summaries of both
tumour and normal genomes. We mirrored our main analyses
and used Mann
–
Whitney
U
-tests or
χ
2tests and linear modelling
to check each QC metric. We did not
fi
nd sex-biases in any QC
metric in pan-cancer or tumour subtype analysis after multiple
adjustment except in raw somatic mutation calling (SMC)
coverage. SMC coverage was higher in male-derived samples in
six tumour subtypes including thyroid cancer and oesophageal
cancer, and was higher in female-derived samples in lung
adenocarcinoma and B-cell non-Hodgkin lymphoma
(Supple-mentary Data 9 and Supple(Supple-mentary Fig. 13). Although we do not
fi
nd sex differences in comparing the SMC coverage pass/fail
rates using a recommended minimum of 2.6 gigabases covered, it
is prudent to consider sex-biased SMC in relation to our
fi
ndings.
Discussion
Our analysis of whole-genome sequencing data from the PCAWG
project uncovered sex differences in the largely unexplored
non-coding autosomal genome. In addition to validating previously
reported
fi
ndings in a novel dataset, we present sex-biases in
measures of non-coding mutation density, tumour evolution and
mutation signatures. These sex-biases suggest differences in the
origins and trajectories of tumours between men and women, and
that they are in
fl
uenced by different endogenous and
environ-mental factors. Although many of our
fi
ndings describe
pan-cancer differences, we have also uncovered an intriguing glimpse
into tumour subtype-speci
fi
c differences in cancers such as those
of the liver and kidney.
These results should be taken within context of a number of
caveats. As we use techniques like the Box
–
Cox transformation to
make the data better suited for our statistical methods, there are
likely characteristics that our models are unable to account for.
An alternate approach using robust modelling may be better
suited for future analyses. Secondly, the tumour subtype-speci
fi
c
results are bound by subtype sample size, and lack of annotation
data restricts the ability to account for confounding variables. It is
therefore important to consider these results within context of the
multivariable models used, which do not directly capture
char-acteristics such as tobacco smoking history. Many of our core
multivariate regression models omit stage and grade due to a
large number of missing values. We follow up this core regression
with extended modelling as an additional level of scrutiny.
Although these extended models do include stage or grade, they
are run on a much smaller (up to 50%) subset of the data and
there is a corresponding loss of statistical power. Finally, there are
imbalances across covariate sample sizes, such as
over-representation of some tumour types in pan-cancer analysis.
We evaluated these imbalances using down-sampling analysis
and rejected results that were biased by these imbalances.
Nevertheless, pan-cancer analysis is dependent on the tumour
subtypes included in the cohort and some
fi
ndings may re
fl
ect
subtype-speci
fi
c trends rather than general characteristics across
all cancers.
Future increases in sample size and robust associated
annota-tion will allow for the detecannota-tion of smaller effects and the control
of more confounders. Such large datasets are critical in validating
the preliminary
fi
ndings we have described in this study.
Increasing the diversity of donors will also allow the study of
intriguing cross-variable questions such as investigating whether
sex differences are universal across races, or if there are
race-speci
fi
c sex differences. Our results are based on single region
sequencing, which can bias the clonal reconstruction for these
tumours. Future work sampling multiple regions will allow us to
detect sex differences in more precise reconstructions at a greater
resolution. We will also be able to leverage germline data to assess
whether there are sex-biases in inherited variants that affect the
variants we observe in somatic mutation pro
fi
les.
Nevertheless, our analyses of driver genes and copy number
alterations suggest functional impacts of genomic sex-biases on
the transcriptome and tumorigenesis. By using signatures to
distinguish between mutations attributed to lifestyle factors such
as smoking history, we can better describe sex differences related
to biological factors such as hormone activity. And despite low
tumour subtype-speci
fi
c sample numbers, our mutation timing
and mutational signatures
fi
ndings at both the pan-cancer and
tumour-subtype level hint at underlying mutational processes
that may give rise to molecular sex-biases. Combined with our
previous work in whole-exome sequencing, we present a
land-scape of sex-biases in cancer genomics and mutational processes
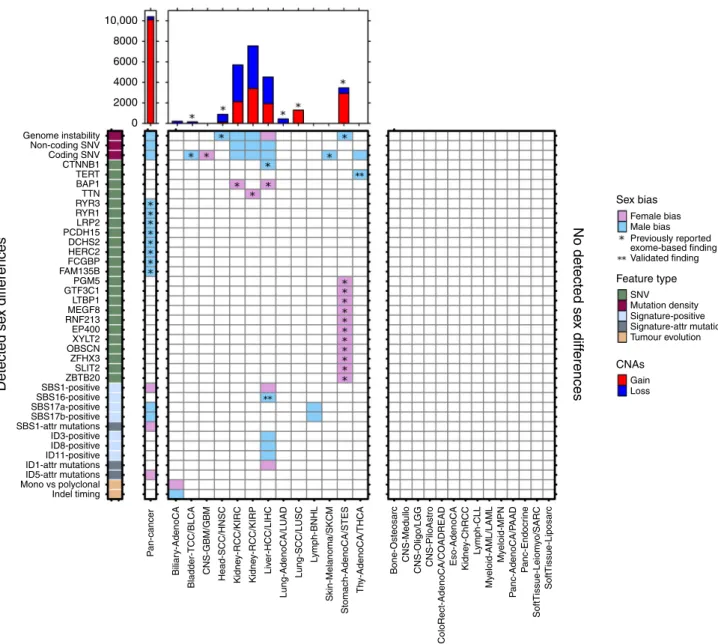
(Fig.
4
).
It is becoming clear that sex differences occur across many
mutation classes and the portrait of differences for each tumour
subtype is a unique re
fl
ection of active mutational processes and
tumour evolution. We have performed here a pan-cancer analysis
of sex differences in whole-genome sequencing data and
catalo-gued previously undescribed sex-biases. However, increased study
of molecular sex differences in future large-scale sequencing
efforts is needed to strengthen the
fi
ndings we present here, to
determine why men and women have molecularly different
tumours, and to determine how this information can be leveraged
to improve patient care.
Methods
General statistical framework. We only included non-sex-specific tumour sub-types in our analysis and focused on the autosome, excluding the sex chromo-somes. Covariate data include genomically matched sex, age at diagnosis, and imputed ancestry.
For each genomic feature of interest, we performed three stages of analysis. At stage one, we use non-parametric univariate tests (Pearson’sχ2proportion or Mann–WhitneyU-test)first, followed by false discovery rate adjustment to identify putative sex-biases of interest (q< 0.1).
At stage two, we further investigate these putative sex-biases by using multivariate linear or logistic modelling to account for potential confounders using bespoke models for each tumour subtype. Confounders were included as independent variables in each model. Supplementary Data 1 describes the model variables for each tumour context, as well as detail on when analyses included multivariate modelling. Variables were included based on availability of data (<15% missing), sufficient variability (at least two levels) and collinearity.
Discrete data were modelled using logistic regression. Continuous data were first transformed using the Box–Cox family and modelled using linear regression. 10,000 8000 6000 4000 2000 0
Detected se
x diff
erences
No detected se
x diff
erences
Genome instability Sex bias Feature type CNAs Male bias Previously reported exome-based finding Validated finding Female bias SNV Mutation density Signature-positive Signature-attr mutations Tumour evolution Gain Loss Non-coding SNV Coding SNV CTNNB1 TERT BAP1 TTN RYR3 RYR1 LRP2 PCDH15 DCHS2 HERC2 FCGBP FAM135B PGM5 GTF3C1 LTBP1 MEGF8 RNF213 EP400 XYLT2 OBSCN ZFHX3 SLIT2 ZBTB20 SBS1-positive SBS16-positive SBS17a-positive SBS17b-positive SBS1-attr mutations ID3-positive ID8-positive ID11-positive ID1-attr mutations ID5-attr mutations Mono vs polyclonal Indel timing P an-cancer Biliar y-AdenoCA Bladder-TCC/BLCA CNS-GBM/GBM Head-SCC/HNSC Kidne y-RCC/KIRC Kidne y-RCC/KIRP Kidne y-ChRCC L ymph-CLL My eloid-AML/LAML My eloid-MPN P anc-AdenoCA/P AAD P anc-Endocr ine SoftTissue-Leiom y o/SARC SoftTissue-Liposarc Liv er-HCC/LIHC Lung-AdenoCA/LU AD Lung-SCC/LUSC L ymph-BNHL Skin-Melanoma/SKCM Stomach-AdenoCA/STES Th y-AdenoCA/THCA Bone-Osteosarc CNS-MedulloCNS-Oligo/LGG CNS-PiloAstro Eso-AdenoCA
ColoRect-AdenoCA/CO
ADREAD
Fig. 4 The landscape of sex differences in cancer genomics.Summary of genomic features found to be sex-biased in pan-cancer analysis or in specific
tumour subtypes. Results from both PCAWG and TCGA analyses are shown. Direction of sex-bias is shown in coloration denoting which sex has higher or more frequent aberration of the genomic feature. Top plot shows union of genes found to be involved in sex-biased CNAs. Starred indicatefindings exclusively from exome sequencing data (n=7131), un-starred indicatefindings from PCAWG data (n=1983), and double-starred indicatefindings also described in other studies.
The Box–Cox family of transformations is a formalised method to select a power transformation to better approximate a normal-like distribution and stabilise variance. We used the Yeo–Johnson extension to the Box–Cox transformation that allows for zeros and negative values23:
yiλ¼ yiþ1 ð Þλ1 λ ; ifλ≠0;y≥0 logðyiþ1Þ; ifλ¼0;y≥0 ðyiþ1Þ2λ 1 2λ ; ifλ≠2;y<0 logðyiþ1Þ; ifλ¼2;y<0 8 > > > > < > > > > : :
FDR adjustment was performed forp-values for the sex variable significance estimate and an FDR threshold of 10% was used to determine statistical significance. For some tumour subtypes, the multivariate step is never performed because there are no univariate hits to evaluate.
The third stage of analysis involves re-evaluating our stage two sex-biases with a battery of additional modelling:
For pan-cancerfindings, we evaluate the effect of unbalanced tumour subtype sample sizes by repeatedly and randomly down-sampling to the median subtype sample size with replacement (nmedian=48). For each down-sampled dataset, we record the difference between the male and female median/proportion, as well as thep-value from the relevant univariate test (Supplementary Fig. 2). We repeat this 10,000 times for eachfinding to generate distributions of male–female differences andp-values. We calculate a 95% confidence interval using the male–female difference distribution and rejectfindings where this confidence interval overlaps with 0. We also rejectfindings where the median down-sampledp-value is greater than thep=0.05 threshold.
For both pan-cancer and tumour subtype-specificfindings, we evaluate the effect of unbalanced sexes when either female or male donors account for >60% of samples. We down-sample to the smaller number of samples with replacement and record the difference between the male and female median/proportion, as well as thep-value from the relevant univariate test (Supplementary Figs. 1, 3, 8, 9 and 11). We repeat this 10,000 times for eachfinding to generate distributions of male–female differences andp-values. We calculate a 95% confidence interval using the male–female difference distribution and rejectfindings where this confidence interval overlaps with 0. We also rejectfindings where the median down-sampled p-value is greater than thep=0.05 threshold. We present the median down-sampledp-values throughout Supplementary Data 2–8.
For tumour subtype-specific results, we also use extended models that incorporate additional variables such as tumour stage. Because this leads to up to 50% data loss, we only investigate a subset of results in this way. All extended modelling results are presented in Supplementary Data 2–8.
Specific details are provided for each analysis below.
Driver event analysis. We focused on driver events (syn11639581) described by the PCAWG consortium14. Driver mutation data were binarized to indicate
pre-sence or abpre-sence of the driver event in each patient. For thefirst stage of our analysis, we compared proportions of mutated genes between the sexes using univariate proportion tests. Aq-value threshold of 0.1 was used to select genes for further multivariate analysis in stage two using binary logistic regression. FDR correction was again applied and genes with significant pan-cancer sex terms were extracted from the models (q-value < 0.1). Driver event analysis was performed separately for pan-cancer analysis and for each tumour subtype.
Clonal structure and mutation timing analysis. Subclonal structure and muta-tion timing calls15were downloaded from Synapse (syn8532460). Subclonal
structure data were binarized from number of subclonal clusters per sample to monoclonal (one cluster) or polyclonal (more than one cluster). The proportion of polyclonal samples was calculated per sex and compared in thefirst stage of analysis using proportion tests for both pan-cancer and tumour subtype analysis. The univariatep-values were FDR-adjusted across all tumour subtypes to identify putatively sex-biased clonal structure. These cases were further scrutinised in stage two using logistic regression. A multivariateq-value threshold of 0.1 was used to determine statistically significant sex-biased clonal structure.
Mutation timing data classified SNVs, indels and SVs into clonal (truncal) or subclonal groups. The proportion of truncal variants was calculated for each mutation type (Number truncal SNVs
Total SNVs , etc) to obtain proportions of truncal SNVs, indels and SVs for each sample. These proportions were compared in stage one of analysis between the sexes using two-sided Mann–WhitneyU-tests and univariatep-values were FDR-adjusted to identify putatively sex-biased mutation timing. In stage two, linear regression was used to adjust for confounding factors and a multivariateq -value threshold of 0.1 was used to determine statistically significant sex-biased mutation timing. The mutation timing analysis was performed separately for SNVs, indels and SVs.
SNV density analysis. Consensus SNV calls were downloaded from Synapse
(syn7357330). Overall SNV density per patient was calculated as the sum of SNVs across all genes on the autosomes and scaled to mutations/Mbp. Coding mutation prevalence only considers the coding regions of the genome, and non-coding prevalence only considers the non-coding regions. Mutation load wasfirst
compared between the sexes using Mann–WhitneyU-tests for both pan-cancer and tumour-type specific analysis. Comparisons withU-testq-values meeting an FDR threshold of 10% were further analysed using linear regression to adjust for tumour subtype-specific variables. Mutation load analysis was performed separately for each mutation context, with pan-cancer and tumour subtypep-values adjusted together.
Chromosome and genome instability analysis. Consensus copy number data
were obtained from Synapse (syn8042988). Ploidy-adjusted calls were used to identify segments with copy number gains and losses. The number of bases in copy number gained or lost segments were summed per chromosome and divided by chromosome size to obtain percent chromosome gained and lost, respectively. All segments affected by any copy number aberration were also summed and treated in the same way to calculate percent chromosome altered. Percent copy number gained, lost and altered were also calculated over the autosomes. In stage one, genome and chromosome instability were compared in pan-cancer and tumour-subtype analysis using Mann–WhitneyU-tests to identify putatively sex-biased chromosome and genome instability. In stage two, putatively sex-biased events were further analysed using linear regression modelling. Genome instability analysis was performed separately for each tumour subtype with FDR adjustment performed over percent copy gained, loss and altered comparisons together.
Genome-spanning CNA analysis. Consensus copy number data (syn8042988)
were processed to gain/neutral/loss calls per gene. For each gene, we compared the proportion of gains for each sex using proportion tests. For putative sex-biased genes that passed an FDR threshold of 10%, we followed up with mul-tivariate logistic regression to adjust for tumour subtype-specific covariates (Supplementary Data 1). We repeated this analysis for copy number loss. This genome-spanning analysis was performed separately for losses and gains for each tumour subtype.
Mutational signatures analysis. The number of mutations attributed to each SBS (syn11738669), DBS (syn11738667) and ID (syn11738668) signature16per sample
was downloaded from Synapse. For each signature, we compared the proportion of samples with any mutations attributed to the signatures (“signature-positive”) usingχ2-square tests to identify univariately significant sex-biases. Signatures with putative sex-biases were further analysed using logistic regression.
We also compared the proportions of mutations attributed to each signature. The numbers of mutations per signature were divided by total number of mutations for each sample to obtain the proportion of mutations attributed to the signature. In thefirst stage of analysis, we used Mann–WhitneyU-tests to compare these proportions of attributed mutations, and Kolmogorov–Smirnov tests to compare their distributions between the sexes. Putative sex-biased signatures were further analysed using linear regression after Box–Cox adjustment.
In addition to tumour subtype-specific covariates, we included SNV density in all multivariate mutational signatures models to account for bias in calling more signatures in SNV-dense samples. Signatures that were not detected in a tumour subtype were omitted from analysis for that tumour subtype. We also used Kolmogorov–Smirnov tests to compare the distributions of attributed mutations and kept results where the sex-difference was significant or trending.
Reporting summary. Further information on research design is available in the Nature
Research Reporting Summary linked to this article.
Data availability
Somatic and germline variant calls, mutational signatures, subclonal reconstructions, transcript abundance, splice calls and other core data generated by the ICGC/TCGA Pan-cancer Analysis of Whole Genomes Consortium are described in the marker paper13and
available for download athttps://dcc.icgc.org/releases/PCAWG. Additional information on accessing the data, including raw readfiles, can be found athttps://docs.icgc.org/
pcawg/data/. In accordance with the data access policies of the ICGC and TCGA projects,
most molecular, clinical and specimen data are in an open tier that does not require access approval. To access potentially identification information, such as germline alleles and underlying sequencing data, researchers will need to apply to the TCGA Data Access Committee (DAC) via dbGaP for access to the TCGA portion of the dataset, and to the ICGC Data Access Compliance Office (DACO) for the ICGC portion. To access somatic single nucleotide variants derived from TCGA donors, researchers will also need to obtain dbGaP authorisation. In addition, the analyses in this paper used a number of datasets that were derived from raw PCAWG sequencing data and variant calls (Supplementary Data 10). The individual datasets are available at Synapse (https://www.
synapse.org/), and are denoted with synXXXXX accession numbers (listed under Synapse
ID); all these datasets are also mirrored athttps://dcc.icgc.org, with full links,filenames, accession numbers and descriptions detailed in Supplementary Data 10. Tumour histological classifications were reviewed and assigned by the PCAWG Pathology and Clinical Correlates Working Group (annotation version 9;syn10389158,syn10389164). Ancestry imputation was performed using an ADMIXTURE24-like algorithm by the
determined by whole-genome sequencing of the reference sample and are available in Supplementary Table 1 of the PCAWG marker paper13. The consensus somatic SNV and
indel (syn7357330)file covers 2778 whitelisted samples from 2583 donors. Driver events were called by the PCAWG Drivers and Functional Interpretation Group (syn11639581). Consensus CNA calls from the PCAWG Structural Variation Working Group were downloaded in VCF format (syn8042988). Subclonal reconstruction was performed by the PCAWG Evolution and Heterogeneity Working Group (syn8532460). SigProfiler mutation signatures were determined by the PCAWG Mutation Signatures and Processes Working Group for single base substitution (syn11738669), doublet base substitution
(syn11738667) and indel (syn11738668) signatures.
Code availability
The core computational pipelines used by the PCAWG Consortium for alignment, quality control and variant calling are available to the public athttps://dockstore.org/
search?search=pcawgunder the GNU General Public License v3.0, which allows for
reuse and distribution. All statistical analyses and data visualisation were performed in the R statistical environment (v3.4.3) using the BPG25(v5.9.8) and car (v3.0-2) packages.
Received: 18 April 2019; Accepted: 30 January 2020;
References
1. Cook, M. B. et al. Sex disparities in cancer incidence by period and age.Cancer Epidemiol. Biomark. Prev.18, 1174–1182 (2009).
2. Edgren, G., Liang, L., Adami, H.-O. & Chang, E. T. Enigmatic sex disparities in cancer incidence.Eur. J. Epidemiol.27, 187–196 (2012).
3. Cook, M. B., McGlynn, K. A., Devesa, S. S., Freedman, N. D. & Anderson, W. F. Sex disparities in cancer mortality and survival.Cancer Epidemiol. Biomark. Prev.20, 1629–1637 (2011).
4. Wichmann, M. W., Muller, C., Hornung, H. M., Lau-Werner, U. & Schildberg, F. W. Gender differences in long-term survival of patients with colorectal cancer.Br. J. Surg.88, 1092–1098 (2001).
5. Elsaleh, H. et al. Association of tumour site and sex with survival benefit from adjuvant chemotherapy in colorectal cancer.Lancet Lond. Engl.355, 1745–1750 (2000).
6. OuYang, P.-Y. et al. The significant survival advantage of female sex in nasopharyngeal carcinoma: a propensity-matched analysis.Br. J. Cancer112, 1554–1561 (2015).
7. Sun, T., Plutynski, A., Ward, S. & Rubin, J. B. An integrative view on sex differences in brain tumors.Cell. Mol. Life Sci.72, 3323–3342
(2015).
8. Dunford, A. et al. Tumor-suppressor genes that escape from X-inactivation contribute to cancer sex bias.Nat. Genet.https://doi.org/10.1038/ng.3726 (2016).
9. Yuan, Y. et al. Comprehensive characterization of molecular differences in cancer between male and female patients.Cancer Cell29, 711–722 (2016). 10. Warrington, N. M. et al. The cyclic AMP pathway is a sex-specific modifier
of glioma risk in type I neurofibromatosis patients.Cancer Res.75, 16–21
(2015).
11. Li, C. H., Haider, S., Shiah, Y.-J., Thai, K. & Boutros, P. C. Sex differences in cancer driver genes and biomarkers.Cancer Res.78, 5527 (2018). 12. Lopes-Ramos, C. M. et al. Gene regulatory network analysis identifies
sex-linked differences in colon cancer drug metabolism.Cancer Res.78, 5538–5547 (2018).
13. The ICGC/TCGA Cancer Analysis of Whole Genomes Network. Pan-cancer analysis of whole genomes.Nature578, 82–93 (2020).
14. Rheinbay, E. et al. Analyses of non-coding somatic drivers in 2,658 cancer whole genomes.Nature578, 102–111 (2020).
15. Gerstung, M. et al. The evolutionary history of 2,658 cancers.Nature578, 122–128 (2019).
16. Alexandrov, L. B. et al. The repertoire of mutational signatures in human cancer.Nature578, 94–101 (2020).
17. Liu, R. & Xing, M. TERT promoter mutations in thyroid cancer.Endocr. Relat. Cancerhttps://doi.org/10.1530/ERC-15-0533(2016).
18. Qin, Y. et al. The inhibitory effects of deleted in liver cancer 1 gene on gallbladder cancer growth through induction of cell cycle arrest and apoptosis. J. Gastroenterol. Hepatol.29, 964–972 (2014).
19. Nik-Zainal, S. et al. Mutational processes molding the genomes of 21 breast cancers.Cell149, 979–993 (2012).
20. Alexandrov, L. B. et al. Signatures of mutational processes in human cancer. Nature500, 415–421 (2013).
21. Letouzé, E. et al. Mutational signatures reveal the dynamic interplay of risk factors and cellular processes during liver tumorigenesis.Nat. Commun.8, 1315 (2017).
22. Cho, A., Chang, Y., Ahn, J., Shin, H. & Ryu, S. Cigarette smoking and thyroid cancer risk: a cohort study.Br. J. Cancer119, 638–645 (2018).
23. Yeo, I.-K. & Johnson, R. A. A New Family Of Power Transformations To Improve Normality Or Symmetry.Biometrika87, 954–959 (2000). 24. Alexander, D. H., Novembre, J. & Lange, K. Fast model-based estimation of
ancestry in unrelated individuals.Genome Res.19, 1655–1664 (2009).
25. P’ng, C. et al. BPG: Seamless, automated and interactive visualization of scientific data.BMC Bioinformatics20, 42 (2019).
Acknowledgements
We thank all the members of the Boutros lab for insightful discussions. This study was conducted with the support of the Ontario Institute for Cancer Research to P.C.B. through funding provided by the Government of Ontario. This work was supported by the Discovery Frontiers: Advancing Big Data Science in Genomics Research program, which is jointly funded by the Natural Sciences and Engineering Research Council (NSERC) of Canada, the Canadian Institutes of Health Research (CIHR), Genome Canada and the Canada Foundation for Innovation (CFI). P.C.B. was supported by a Terry Fox Research Institute New Investigator Award and a CIHR New Investigator Award. This work was supported by an NSERC Discovery grant and by Canadian Institutes of Health Research, grant #SVB-145586, to P.C.B. This work was supported by the NIH/NCI under award number P30CA016042 and an operating grant from the National Cancer Institute Early Detection Research Network (1U01CA214194-01). We acknowledge the contributions of the many clinical networks across ICGC and TCGA who provided samples and data to the PCAWG Consortium, and the contributions of the Technical Working Group and the Germline Working Group of the PCAWG Con-sortium for collation, realignment and harmonised variant calling of the cancer genomes used in this study. We thank the patients and their families for their participation in the individual ICGC and TCGA projects.
Author contributions
C.H.L. and P.C.B. initiated the project. C.H.L., S.D.P., R.X.S., F.Y. and N.S. analysed data. P.C.B. supervised research. C.H.L. and P.C.B. wrote thefirst draft of the manuscript, which all authors edited and approved. The PCAWG Tumour Subtypes and Clinical Translation working group and the PCAWG Consortium network provided variant calls, clinical annotation data and insightful commentary.
Competing interests
The authors declare no competing interests.
Additional information
Supplementary informationis available for this paper at
https://doi.org/10.1038/s41467-020-17359-2.
Correspondenceand requests for materials should be addressed to P.C.B.
Peer review informationNature Communicationsthanks Joshua Rubin, Melissa Wilson and the other, anonymous, reviewer(s) for their contribution to the peer review of this work. Peer reviewer reports are available.
Reprints and permission informationis available athttp://www.nature.com/reprints Publisher’s noteSpringer Nature remains neutral with regard to jurisdictional claims in published maps and institutional affiliations.
Open Access This article is licensed under a Creative Commons Attribution 4.0 International License, which permits use, sharing, adaptation, distribution and reproduction in any medium or format, as long as you give appropriate credit to the original author(s) and the source, provide a link to the Creative Commons license, and indicate if changes were made. The images or other third party material in this article are included in the article’s Creative Commons license, unless indicated otherwise in a credit line to the material. If material is not included in the article’s Creative Commons license and your intended use is not permitted by statutory regulation or exceeds the permitted use, you will need to obtain permission directly from the copyright holder. To view a copy of this license, visithttp://creativecommons.org/
licenses/by/4.0/.
PCAWG Tumour Subtypes and Clinical Translation
Fatima Al-Shahrour
9, Gurnit Atwal
1,5,10, Peter J. Bailey
11, Andrew V. Biankin
11,12,13,14, Paul C. Boutros
1,2,3,4,
Peter J. Campbell
15,16, David K. Chang
11,12, Susanna L. Cooke
11, Vikram Deshpande
17, Bishoy M. Faltas
18,
William C. Faquin
17, Levi Garraway
19, Gad Getz
20,21,22,23, Sean M. Grimmond
24, Syed Haider
1,
Katherine A. Hoadley
25,26, Wei Jiao
1, Vera B. Kaiser
27, Rosa Karli
ć
28, Mamoru Kato
29, Kirsten Kübler
17,20,21,
Alexander J. Lazar
30,31, Constance H. Li
1,2, David N. Louis
17, Adam Margolin
32, Sancha Martin
15,33,
Hardeep K. Nahal-Bose
34, G. Petur Nielsen
17, Serena Nik-Zainal
15,35,36,37, Larsson Omberg
38, Christine P
’
ng
1,
Marc D. Perry
34,39, Paz Polak
20,21,22, Esther Rheinbay
17,20,21, Mark A. Rubin
40,41,42,43,44, Colin A. Semple
27,
Dennis C. Sgroi
17, Tatsuhiro Shibata
45,46, Reiner Siebert
47,48, Jaclyn Smith
49, Lincoln D. Stein
1,10,
Miranda D. Stobbe
50,51, Ren X. Sun
1, Kevin Thai
34, Derek W. Wright
11,52, Chin-Lee Wu
17, Ke Yuan
53,54,55&
Junjun Zhang
349Bioinformatics Unit, Spanish National Cancer Research Centre (CNIO), Madrid 28029, Spain.10Department of Molecular Genetics, University of Toronto, Toronto, ON M5S 1A8, Canada.11Wolfson Wohl Cancer Research Centre, Institute of Cancer Sciences, University of Glasgow, Glasgow, UK.12Cancer Division, Garvan Institute of Medical Research, Kinghorn Cancer Centre, University of New South Wales (UNSW Sydney), Sydney, NSW, Australia.13South Western Sydney Clinical School, Faculty of Medicine, University of New South Wales (UNSW Sydney), Liverpool, NSW, Australia.14West of Scotland Pancreatic Unit, Glasgow Royal Infirmary, Glasgow, UK.15Wellcome Sanger Institute, Wellcome Genome Campus, Hinxton, Cambridge CB10 1SA, UK.16Department of Haematology, University of Cambridge, Cambridge CB2 2XY, UK.17Massachusetts General Hospital, Boston, MA 02114, USA.18Weill Cornell Medical College, New York, NY 10065, USA.19Department of Medical Oncology, Dana-Farber Cancer Institute, Boston, MA 02215, USA.20Broad Institute of MIT and Harvard, Cambridge, MA 02142, USA.21Harvard Medical School, Boston, MA 02115, USA.22Center for Cancer Research, Massachusetts General Hospital, Boston, MA 02129, USA.23Department of Pathology, Massachusetts General Hospital, Boston, MA 02115, USA.24Centre for Cancer Research, Victorian Comprehensive Cancer Centre, University of Melbourne, Melbourne, VIC 3052, Australia.25Lineberger Comprehensive Cancer Center, University of North Carolina at Chapel Hill, Chapel Hill, NC 27599, USA.26Department of Genetics, University of North Carolina at Chapel Hill, Chapel Hill, NC 27599, USA.27MRC Human Genetics Unit, MRC IGMM, University of Edinburgh, Edinburgh EH4 2XU, UK.28Bioinformatics Group, Division of Molecular Biology, Department of Biology, Faculty of Science, University of Zagreb, Zagreb, Croatia.29Department of Bioinformatics, Research Institute, National Cancer Center Japan, Tokyo 104-0045, Japan.30Departments of Pathology, The University of Texas MD Anderson Cancer Center, Houston, TX 77030, USA.31Department of Genomic Medicine, The University of Texas MD Anderson Cancer Center, Houston, TX 77030, USA.32Computational Biology Program, School of Medicine, Oregon Health & Science University, Portland, OR 97239, USA.33Hematology, Hospital Clinic, Institut d’Investigacions Biomediques August Pi i Sunyer (IDIBAPS), University of Barcelona, Barcelona, Spain.34Genome Informatics Program, Ontario Institute for Cancer Research, Toronto, ON M5G 0A3, Canada.35Academic Department of Medical Genetics, University of Cambridge, Addenbrooke’s Hospital, Cambridge CB2 0QQ, UK.36MRC Cancer Unit, University of Cambridge, Cambridge CB2 0XZ, UK.37The University of Cambridge School of Clinical Medicine, Cambridge, UK.38Sage Bionetworks, Seattle, WA 98109, USA.39Department of Radiation Oncology, University of California San Francisco, San Francisco, CA 94518, USA.40Department for Biomedical Research, University of Bern, Bern 3008, Switzerland.41Bern Center for Precision Medicine, University Hospital of Bern, University of Bern, Bern 3008, Switzerland.42Englander Institute for Precision Medicine, Weill Cornell Medicine and New York Presbyterian Hospital, New York, NY 10021, USA.43Meyer Cancer Center, Weill Cornell Medicine, New York, NY 10065, USA.44Pathology and Laboratory, Weill Cornell Medical College, New York, NY 10021, USA.45Division of Cancer Genomics, National Cancer Center Research Institute, Tokyo 104-0045, Japan.46Department of Oncologic Pathology, Dana-Farber Cancer Institute, Harvard Medical School, Boston, MA, USA.47Institute of Human Genetics, Ulm University and Ulm University Medical Center, Ulm 89081, Germany.48Human Genetics, University of Kiel, Kiel 24118, Germany.49Oregon Health and Science University, Portland, OR, USA.50CNAG-CRG, Centre for Genomic Regulation (CRG), Barcelona Institute of Science and Technology (BIST), Barcelona 08028, Spain.51Universitat Pompeu Fabra (UPF), Barcelona 08003, Spain.52MRC-University of Glasgow Centre for Virus Research, Glasgow G61 1QH, UK.53Li Ka Shing Centre, Cancer Research UK Cambridge Institute, University of Cambridge, Cambridge, UK.54University of Glasgow, Glasgow G61 1BD, UK.55School of Computing Science, University of Glasgow, Glasgow G12 8RZ, UK.