Errors in Laboratory Medicine
Pierangelo Bonini,
1,2*Mario Plebani,
3Ferruccio Ceriotti,
2and
Francesca Rubboli
2Background: The problem of medical errors has
re-cently received a great deal of attention, which will probably increase. In this minireview, we focus on this issue in the fields of laboratory medicine and blood transfusion.
Methods:We conducted several MEDLINE queries and
searched the literature by hand. Searches were limited to the last 8 years to identify results that were not biased by obsolete technology. In addition, data on the fre-quency and type of preanalytical errors in our institu-tion were collected.
Results: Our search revealed large heterogeneity in study designs and quality on this topic as well as relatively few available data and the lack of a shared definition of “laboratory error” (also referred to as “blunder”, “mistake”, “problem”, or “defect”). Despite these limitations, there was considerable concordance on the distribution of errors throughout the laboratory working process: most occurred in the pre- or postana-lytical phases, whereas a minority (13–32% according to the studies) occurred in the analytical portion. The reported frequency of errors was related to how they were identified: when a careful process analysis was performed, substantially more errors were discovered than when studies relied on complaints or report of near accidents.
Conclusions: The large heterogeneity of literature on laboratory errors together with the prevalence of evi-dence that most errors occur in the preanalytical phase suggest the implementation of a more rigorous method-ology for error detection and classification and the adoption of proper technologies for error reduction.
Clinical audits should be used as a tool to detect errors
caused by organizational problems outside the
laboratory.
© 2002 American Association for Clinical Chemistry
Measuring and improving laboratory-related patient out-comes require methods that relate the total quality of laboratory information to more effective patient manage-ment, including diagnosis, treatment of disease, clinical monitoring, and disease prevention. The improvement in analytical quality, documented through proficiency test-ing, should guarantee that the actual performances of clinical laboratories are suitable for improving a patient’s health. Furthermore, increased attention to patients’ needs is demonstrated by efforts to improve the quality of the entire service provided, e.g., reduction of the turn-around time (TAT). However, improvement of laboratory performance does not automatically indicate a reduction in the number of errors, both analytical and organiza-tional. Even certification or accreditation processes focus attention more on the general performance of the labora-tory than on events such as errors that, by their very nature, are considered exceptional. Moreover, the lack of a universally accepted definition of error and above all of “allowable error rate”, reduces the possibility of evaluat-ing the impact of laboratory error on patient outcomes.
Although there is abundant scientific literature dealing with increased laboratory quality (mainly analytical), the literature on errors in laboratory medicine is scarce. One reason for this, in addition to the insufficient attention paid to the problem, is the practical difficulty in reporting and measuring the number of errors.
In fact, there are several limitations in the study designs of reports dealing with the frequency and types of mistakes in the clinical laboratory.
The first limitation is that most of the studies focus simply on analytical errors, which represent only a per-centage of the errors in the total testing process, which includes all pre-, intra-, and postanalytical phases. Other studies are based on methodologies, such as the split-specimen design, that are insensitive to total testing process problems that can occur before specimens are collected and after results are obtained by the analytical process(1,2 ).
1Universita` Vita-Salute San Raffaele, Cattedra di Biochimica Clinica, Via Olgettina 58, 20132 Milan, Italy.
2Istituto Scientifico H. S. Raffaele, Servizio Integrato di Medicina di Laboratorio, Via Olgettina 60, 20132 Milan, Italy.
3Servizio di Medicina di Laboratorio, Azienda Ospedaliera di Padova, Via Giustiniani 2, 35100 Padova, Italy.
*Author for correspondence. Fax 39-02-2643-2640; e-mail bonini. [email protected].
Received July 20, 2001; accepted February 12, 2002.
The second limitation is that it is possible, even prob-able, that the most frequent preanalytical errors are rep-resented by an inappropriate choice of laboratory tests or panel of tests and that most postanalytical errors derive from inappropriate interpretation and utilization of labo-ratory results. Although large differences in labolabo-ratory test requests and utilization between hospitals, even within the same country, have been described recently (3 ), a systematic review of laboratory clinical audits has demonstrated that many studies identifying inappropri-ate laboratory use are based on implicit or explicit criteria not meeting methodologic standards(4 ).
Regarding the postanalytical phase, only a few studies are available that demonstrate the inappropriate utiliza-tion of or response to laboratory results. It has recently been demonstrated that the introduction of new techno-logic facilities (online connection between laboratory and wards) without proper organization can worsen, rather than improve the communications between laboratories and clinicians (5 ). The lack of immediate notification and/or clinical utilization of a critical value can have an effect on outcome as negative as a wrong result. As pointed out by Lundberg in an outstanding editorial in JAMA (6 ), proper interpretation and action must be accomplished before the laboratory test loops are actually completed.
The third limitation is that, apart from a reluctance in reporting their own errors, it is extremely difficult for laboratories to identify all errors because many errors will neither produce detectable abnormal results nor raise questions for the user. Although their observations were not based on actual data, Goldschmidt and Lent (7 ) estimated that up to 75% of errors produce results still within the reference intervals, that ⬃12.5% produce wrong results that are so absurd that they are not consid-ered clinically, and that the remaining 12.5% of laboratory errors may have an effect on patient health.
The fourth limitation is that new pathophysiologic insights and the development of highly specific and sensitive laboratory tests have changed the relationship between laboratory information and the gold standards. This is the case for myocardial damage in acute coronary syndromes, in which the measurement of cardiac tro-ponins is the method of choice for detecting small myo-cardial injuries. The same is true for molecular analyses to evaluate disease susceptibility. In this and other clinical situations where it is difficult or impossible to compare laboratory results to gold standards, possible errors should be identified by evaluating the relationship be-tween laboratory information and medical outcomes.
In contrast to the above-described situation, which was derived essentially from the scientific literature, “errors in medicine”, including laboratory mistakes and problems at blood banks, are frequently cited by the mass media even if the attention is especially driven by errors in other healthcare sectors (e.g., drugs or surgery). In many of these reports, it is suggested that the reported errors are
only the tip of the iceberg and that the consequences on patient outcome are likely to be worse than described. For this reason, we reviewed the scientific literature on errors in laboratory medicine and blood banks.
For laboratory medicine, we searched the MEDLINE database from January 1994 to June 2001 by crossing several headings: “laboratories, diagnostic services”; “chemistry, clinical”; “diagnostic errors”; and “medical errors”. All articles with the words “blunders OR prob-lems OR errors OR mistakes AND laboratory” in the title were also selected. Additional hand searching was per-formed, starting with the references of the selected pa-pers. Finally, only articles reporting information on the total testing process (including the preanalytical, analyti-cal, and postanalytical phases, not just one of them) in which data were obtained by direct collection (not just by questionnaires) were chosen and are compared in Table 1. For blood banks, we searched the MEDLINE database from January 1992 to June 2001 by crossing several headings: blood transfusion/st (standards); blood group, incompatibility/co (complications); blood transfusion/ae (adverse effects); quality of health care; quality control quality assurance; health care/sn (statistics & numerical data); quality assurance, health care/og (organization & administration); quality assurance, health care/st (stan-dards); safety; medication errors; and patient identifica-tion systems/st (standards). Starting from these results, we performed additional hand searching and selection. The results are presented in Table 2 and represent only those studies including more than three hospitals or a data collection period longer than 1 year. Only the most recent literature was analyzed because advances in labo-ratory informatics, automation, and analytical quality would make comparison to older studies nearly impossi-ble (see also Taimpossi-ble 3).
The most relevant features of the studies involving laboratory errors are summarized in Table 1: (a) data collection period; (b) number of tests considered; (c) number of patients involved; (d) total number of errors and their relative frequencies; (e) distribution of errors in the preanalytical, analytical, and postanalytical phases; (f) errors caused by patient misidentification; and (g) effect of errors on patient outcome. The findings confirm that there is a very limited number of studies on this topic and that those that exist are very heterogeneous. These studies used different data collection approaches [process analy-sis (8 ), audit and questionnaires (9 ), and collection of complaints(7 )], the time span for data collection ranged from 3 months to 10 years, and the laboratory sectors examined were very different. Another obstacle to com-paring these studies or reaching general conclusions is that in some reports, the errors are indexed to patients, whereas in others they are indexed to tests performed. Data have been partially re-elaborated to calculate fre-quencies, to divide them into the phases of the working process, and to harmonize the categories of relevance of the effect on patient outcome. It is evident from the data
Table 1. Review of the literature on laboratory errors. Sector of the laboratory Lapworth and Teal (10 ) Clinical chemistry Goldschmidt and Lent (7 ) Whole laboratory Nutting et al. (36 ) Primary care Plebani and Carraro (8 ) Stat laboratory Stahl et al. (37 ) Whole laboratory Hofga ¨ rtner and Tait (9 ) Molecular genetic tests onsite survey (2 laboratories) Molecular genetic tests questionnaire (101 sent, 42 respondents) Data collection period 1 year 6 years 6 months 3 months 3 years 10 years 1 year No. of tests ⬃ 997 000 ND a ND 40 490 676 564 b 4234 88 394 No. of patients ⬃ 249 000 ND 160 714 ND ND ND ND No. of errors 120 133 180 189 4135 b 16 293 Frequency 0.05% of patients 0.11% of patients 0.47% of test results 0.61% b of test results 0.38% of test results 0.33% of test results Preanalytical phase 31.6% 53% 55.6% 68.2% 75% b 44% 60% Analytical phase 31.6% 23% 13.3% overall (4.4% if referral laboratory; 40% if POCT) 13.3% 16% b 31% 19% Postanalytical phase 30.8% 24% 30% 18.5% 9% b 12.5% 15% Multiple phases 6% 12.5% 6% Identification errors 41 (34%) 77 (58%) ND 5 (2,6%) ND ND ND Impact on patient outcome ND None 43% 74% 63.4% Mild 23% (delays) 13% 19.6% (further investigations) 25% 20% Moderate 26% (potential damage) 13% 6.4% (inappropriate therapy modification) 50% 10.2% Severe 8% (erroneous medical interventions) 25% 6.4% Very severe None a ND, not defined; POCT, point-of-care testing. b Mean values of the 3 years.
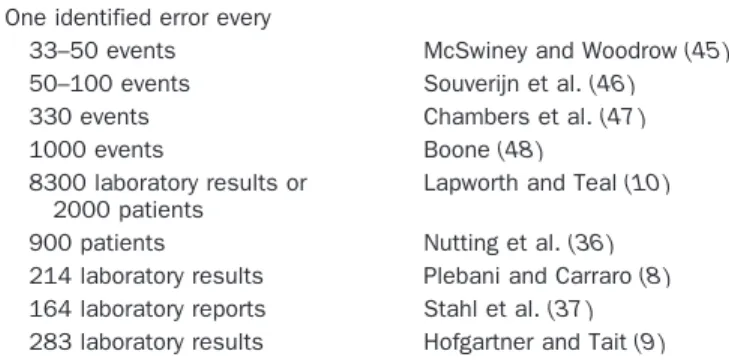
shown that the collection method has a very strong influence on both the prevalence and the error types. For example, when data collection was based on complaints (7 )or on more or less fortuitous finding of blunders(10 ), the errors reported were mainly attributable to misiden-tification, and their number was very low: 133 errors in 6 years(7 )or 0.05%(10 ). On the other hand, when a careful review of the whole working process was performed(8 ), the number of errors increased substantially (189 in 3 months, 0.47% of the test results). In this last report (8 ), misidentification errors represented only 2.6% of all er-rors, but their absolute frequency was more than double that reported by Lapworth and Teal(10 ). The heteroge-neity of the literature is even more obvious in Table 3, where only the frequencies of errors from these and older studies are reported.
One common finding in this review of data on labora-tory errors is that even when different study designs, patient numbers, and discovery techniques were used, the distribution of errors across the different phases of the entire testing process was very similar. This comes through despite the large differences in actual error frequencies. In particular, all available studies demon-strated that a large percentage of laboratory errors occur in the pre- and postanalytical phases, with fewer mistakes occurring during the analytical step. Indirect evidence of the importance of the preanalytical phase stems from the
results of several recent studies. In the College of Amer-ican Pathologists Q-Probe study (11 ) performed in 660 institutions, a total of 5514 of 114 934 outpatients requisi-tions (4.8%) were associated with at least one type of order entry error. In 1658 (1.4%) of the requisitions, one or more tests on the requisition were not ordered in the laboratory computer, whereas in 1221 cases (1.1%) at least one test was ordered in the computer that had not appeared on the requisition. A total of 2130 requisitions (1.9%) contained one or more physician name discrepan-cies between the requisition and the laboratory computer entry, Finally, in 943 requisitions (0.8%), an incorrect test priority was entered for at least one of the requested tests. In an Australian survey on transcription and analytical errors, the transcription error rate was up to 39%, the most frequent types of errors being associated with misidenti-fication of the requested tests, the requesting doctor, and/or the patient. The laboratory with the worst perfor-mance had errors in 46% of requests, but even the three best-performing laboratories achieved an error-free re-porting of onlyⱖ85%, with only one achieving 95%(12 ). Another indirect indicator of the importance of preana-lytical processes stems from studies that have demon-strated that the evaluation of specimen adequacy is a critical preanalytical factor affecting test result accuracy and usefulness(13 ).
Shown in Table 4 are the errors, relative only to the
Table 2. Review of transfusion errors.
Transfusion-related studies
Renner et al.(38 ) McClelland and Phillips(39 ) Linden and Kaplan(40 ) Shulman et al.(32 )
Data collection period
4 weeks 2 years 22 months 6-month pilot study followed
by 2-year main experience
Sample description 712 hospitals (US) 245 hospitals (UK) 285 regulated
facilities (US)
2000-bed hospital (US)
Number of observations
Patient wristbands checked on 2 463 727 occasions
ND 1 784 641 red cell
transfusions
35 000 transfusions/year
Results and patient outcome
67 289 errors (2.7%) Total incidents, 111 (1/29 000
transfusions); deaths, 6 (1/ 550 000 transfusions); morbidity, 12 (1/275 000 transfusions); no adverse effect, 93 (1/36 000 transfusions)
Total errors during the study period, 104; ABO-incompatible transfusions, 54 (1/33 000); ABO-compatible errors (estimated), 96 (1/ 19 000) ABO-incompatible transfusion, 1/6000 transfused patients Types/causes/ sources of error Absent wristband, 49.5%; multiple wristbands, 18.3%; incomplete data, 17.5%; partly erroneous data, 8.6%; illegible data, 5.7%; wrong wristband, 0.5%
Wrong blood tube, 23; laboratory errors, 6; transfused wrong blood, 82
Outside blood bank, 61 (45 patient misidentification); in blood bank and outside, 18; in blood bank, 25
Major cause of errors, misidentification
preanalytical phase, detected in the San Raffaele Hospital Laboratory in 1 year. All the preanalytical problems that prevented us from reporting a result were automatically collected and divided by in- and outpatients. The data indicate the number of missing test results attributable to a specific type of preanalytical problem, not the number of problematic samples (e.g., a single hemolyzed tube could have caused the absence of 20 or more results). The difference between in- and outpatients is noteworthy: there were a total of 15 503 errors in 2 583 850 test results (0.60%) for inpatients vs 792 errors in 2 032 133 tests results (0.039%) for outpatients. There are multiple rea-sons for this difference: (a) direct control of sample
drawing for the outpatients vs blood drawing performed by ward personnel, who have a high degree of turnover and lower skill, and (b) the higher complexity of the
Table 3. Error rates in clinical laboratories. One identified error every
33–50 events McSwiney and Woodrow(45 )
50–100 events Souverijn et al.(46 )
330 events Chambers et al.(47 )
1000 events Boone(48 )
8300 laboratory results or 2000 patients
Lapworth and Teal(10 )
900 patients Nutting et al.(36 )
214 laboratory results Plebani and Carraro(8 )
164 laboratory reports Stahl et al.(37 )
283 laboratory results Hofgartner and Tait(9 )
Table 2. Continued.
Transfusion-related studies
Taswell et al.(41 ) Baele et al.(22 ) Linden(42 ) Williamson et al.(43 ) Linden et al.(44 )
10 years (1982–1992) 15 months 5 years (New York State
Department of Health); 1 year FDAa
2 years (1996–1997) (1996–1998)
10 years (1990–1999)
1 hospital (US) 3 teaching hospitals
(Belgium) ND (US) 1996–1997: 94 hospitals; 1997–1998: 276 hospitals (UK) 256 transfusion services (US) ND 808 patients of 1448 undergoing surgery were transfused with 3485 units of RBC or FFP
ND 3 400 000 red cell
transfusions
9 000 000 transfusions
Overall error rate, 20–30/ 10 000 procedures; identification, 2.2/10 000; performance, 15.5/ 10 000; transcription, 7.9/10 000; storage and retrieval 2.7/10 000 Incidence of errors, 165 (1/21 transfusions)
Deaths from ABO-incompatible transfusion, 1/1 700 000 units in New York State; 1/1 300 000 units in US, (FDA) Errors, 191 (1/18 000); deaths 9 (1/199); major morbidity, 42 (1/199); minor or no morbidity, 136 (1/ 199); death attributable to underlying condition, 12 (1/199) Identification errors, 1–3/ 10 000 procedures; performance, 15–17/ 10 000; transcription, 5–11/10 000 165 errors/3485 transfusions (misidentification, 7; misrecordings, 61; mislabelings, 6; failure to document transfusions, 83; other, 8)
Administration to the wrong recipient, 38%;
phlebotomy errors, 13%; blood bank errors, 29%; multiple errors, 15%; others, 5%
aFDA, Food and Drug Administration; ND, not defined; RBC, red blood cells; FFP, fresh frozen plasma.
Table 4. Types of preanalytical errors registered during the year 2000 at the Laboratory of San Raffaele Hospital.
Type of error
No. of missing results Inpatients Outpatients Hemolyzed sample 8494 256 Insufficient sample 3256 102 Incorrect sample 1824 289 Clotted sample 792 80 Incorrect identification 287 2
Lack of signature (blood group) 266
Empty tube 238 8
Lack or wrong compilation of the accompanying module
120
Sample not on ice 75 6
Tube broken in the centrifuge 57 36
Test not reserved 31
Urine not acidified 24
Open container 20 13
Module without signature 14
Urine volume not indicated 5
examinations performed and multiple blood drawings for the inpatients.
Guidelines for collecting samples and for evaluating submitted specimens are therefore essential because ac-ceptance of improper specimens for analysis may lead to erroneous information that could affect patient care, but only by monitoring on a regular basis the rejected speci-mens and identifying factors associated with the rejection can we avoid errors and promote continuous quality improvement of laboratory service (14 ). Moreover, an increasing body of evidence demonstrates the importance of the postanalytical phase for monitoring and improving the TAT(15 ), for improving the appropriateness of refer-ence intervals(16 ), and for allowing more objective vali-dation and interpretation of data by use of expert systems (17,18 ). Recently, there has been growing interest in implementing and disseminating guidelines for the pro-vision of interpretative comments on laboratory reports (19 ). To avoid possible errors, this critical activity requires that the laboratory personnel receive adequate training; moreover, there is the need for quality assurance in providing interpretative comments and for auditing this activity(20 ).
We also paid attention to the area of blood banking. This field is strictly related to laboratory medicine and has very similar working methodologies, which are always being subjected to a very high degree of control because of the high degree of related risk. A report from the College of American Pathologists in collaboration with the CDC Outcomes Working Group(21 )describes error stratifica-tion in the working process for clinical laboratories similar to the one reported in Table 1. Of⬎88 000 defects, 41% were observed in the preanalytical phase of testing, 55% in the postanalytical phase, and only 4% in the analytical phase(21 ).
Table 2 summarizes a selection of the published reports on errors in transfusion medicine, taking into consider-ation the effect of the error on the patient. In this case, the essential elements have been extracted: duration of data collection; frequency of misidentification errors; and effect of the error on the patient’s health. Once again the heterogeneity of the results of the different studies is noteworthy; particularly evident is the very high number of risks of error (4.7% of the transfusions) reported by Baele et al. (22 ). Point 3 below presents a tentative explanation for this fact.
The heterogeneity of the reported data, in addition to underlining the total lack of a benchmark, the lack of a definition of “maximum allowable error rate”, and the lack of a classification of errors, puts in evidence some aspects of critical relevance:
1) There is a need for better definition of laboratory errors and their causes. In fact, we can agree that laboratory errors may be defined as “any defect from ordering tests to reporting results and appropriately interpret-ing and reactinterpret-ing on these”, but because our aim was to
identify the most critical steps in the total testing process and to set up a plan for a corrective strategy, we made a distinction between (a) errors exclusively inside the laboratory (analytical errors, but also an undue increase in TAT or a sample mismatch during the analysis) and (b) laboratory errors caused by orga-nizational problems outside the laboratory (e.g., sam-ple-patient mismatch during the blood withdrawal performed by nonlaboratory personnel).
For errors within the laboratory, an increasing body of evidence demonstrates that the analytical error rate has improved significantly over time(23 ); it is affected by the training and qualification of testing personnel(24,25 )and by the correct adoption of rules for defining the allowable errors in internal quality-control practice(26 ). Moreover, the effectiveness of external quality assessment schemes and proficiency testing programs has been widely dem-onstrated, not only in identifying analytical errors, but also in detecting their possible sources, thus allowing laboratories to prevent further errors(27 ).
For laboratory errors caused by organizational prob-lems outside the laboratory, these causes are often related to other frequent errors in healthcare and require similar corrective actions aimed at improving the organization of the ward. Typical examples of these errors are mistakes in patient identification for blood drawing or drug admin-istration and transcription of data to the patient chart. Therefore, as stated by David Blumenthal, “the quantita-tively largest reductions in laboratory error are likely to result from interdepartmental cooperation designed to improve the quality of specimen collection and data dissemination” (28 ). The role of the clinical audit in detecting this type of error and in improving clinical performance is being increasingly recognized; laborato-ries need to monitor adverse incidents, to learn how to minimize risk by studying them, and to establish proce-dures to prevent them(29 ).
2) It is important to classify laboratory errors by relating them to their real or potential effects on patient out-comes, allowing definition of the relevance of the error itself. A hemolyzed sample is probably less problem-atic than sample mismatching or a TAT that is too long in a critical situation. However, abnormal hemolysis that prevents sample analysis can lead to a request for a new sample, which prolongs the TAT and could potentially be very harmful for critical patients. More-over, it would be advisable to define the acceptable error rate to give medical laboratories a realistic goal for quality improvement initiatives.
3) A standard for laboratory error detection and report-ing needs to be defined, and an accurate analysis of the risk of errors in the clinical laboratory needs to be performed. In the previously mentioned report, Baele et al. (22 ) demonstrated the existence of 1 error for every 21 transfusions (4.7%), whereas in other reports, the mean error frequency is⬃1 error for every 6000 –
12 000. This enormous error risk is attributable to the methodology of process analysis adopted by the au-thors, who reviewed all the transfusions in three University Hospitals in the Brussels area. To our knowledge, this is the only case of systematic analysis of the transfusion process at the bedside, and it shows the very high risk for strictly controlled events such as blood transfusions. The enormous difference in sensi-tivity of an error detection method based on com-plaints or fortuitous detection (very low sensitivity) and one based on systematic analysis of all the steps needed to complete the medical act (very high sensi-tivity) thus is extremely evident. Introducing process analysis in laboratories to identify the error risk related to different procedures is quite advisable (e.g., risk of sample mismatching during blood drawing or during the analytical process).
4) It is important to define ways to decrease laboratory errors and to possibly avoid completely those with a real or potentially significant negative effect on a patient’s health. It is impossible in medicine, as in any other human activity, to completely eliminate errors, but it is possible to reduce them. It is advisable to adopt techniques for error prevention and evaluation, perhaps taking them from some industrial sector such as the aviation industry, and searching for systems with error rates in the 1–2 ppm range. To reach the goal of error reduction, it is necessary to go outside the laboratory and to reorganize the activity of the wards. This can be done with appropriate educational pro-grams and by introduction of automation technology and robotics. These solutions are also likely to contrib-ute to error reductions in other aspects of patient care, such as drug administration, as we demonstrated in other studies(30,31 ). Errors attributable to sample or patient misidentification have been recognized as a significantly severe source of problems that will worsen the quality of healthcare in all developed countries unless appropriate remedial actions are taken(32–34 ). On this topic, the European Countries within the CEN (Commission Europeenne de Normal-ization), the European standardization body, recently unanimously approved a document (34 ) for correct patient identification regardless of the medical act. In Italy, a document on patient safety, including stan-dards on correct patient identification, has been issued and is currently being implemented.
5) An appropriate error detection program and adequate measures for error reduction that quantify the effects of these measures and evaluate whether the reduction can be considered satisfactory are critical. A reduction in the number of errors is a valid and sensitive indica-tor of the efficacy of the corrective actions only for less-severe errors (errors with little or no effect on patient health, such as an empty tube or a hemolyzed sample). The important errors, those dangerous for patient health (e.g., patient mismatch during blood
drawing, drug administration, or transfusion), appear to be, at least in the reviewed literature, rare events (none of the authors reports very severe consequenc-es). Therefore, relying on their reduction to judge the efficacy of the adopted measures might not be suffi-ciently sensitive. In these cases, the only effective criterion is the demonstration, via process analysis, of an adequate reduction of the error risk. The introduc-tion and use of auto-controlled and noncircumventable systems for patient identification can help in the reduc-tion of errors(31,33,34 ).
6) Another fundamental step is to create a culture in which the existence of risk is acknowledged and injury prevention is recognized as everyone’s responsibility. As stated Leape et al.(35 ), the transforming insight for medicine (and for laboratory medicine) from human factor research is that errors are rarely attributable to personal failings, inadequacies, and carelessness and that naming, blaming, shaming, and punishing have not worked in addressing and decreasing errors. On the contrary, the new look has focused research on how people, individually, as groups, and as organiza-tions, make safety. This needs training, education, and culture.
References
1.Shahangian S, Krolak JM, Gaunt EE. A system to monitor a portion of the total testing process in medical clinics and laboratories: feasibility of a split-specimen design. Arch Pathol Lab Med 1998; 122:503–11.
2.Shahangian S, Cohn RD, Gaunt EE. System to monitor a portion of the total testing process in medical clinics and laboratories: evaluation of a split-specimen design. Clin Chem 1999;45:269 – 80.
3.Larsson A, Palmer M, Hulten G, Tryding N. Large differences in laboratory utilization between hospitals in Sweden. Clin Chem Lab Med 2000;38:383–9.
4.van Walraven C, Naylor D. Do we know what inappropriate laboratory utilization is? A systematic review of laboratory clinical audits. JAMA 1998;280:550 – 8.
5.Kilpatrick ES, Holding S. Use of computer terminals on wards to access emergency test results: a retrospective audit. BMJ 2001; 322:1101–3.
6.Lundberg GD. The need for an outcomes research agenda for clinical laboratory testing. JAMA 1998;280:565– 6.
7.Goldschmidt HMJ, Lent RW. Gross errors and work flow analysis in the clinical laboratory. Klin Biochem Metab 1995;3:131– 40. 8.Plebani M, Carraro P. Mistakes in a stat laboratory: types and
frequency. Clin Chem 1997;43:1348 –51.
9.Hofga¨rtner WT, Tait JF. Frequency of problems during clinical molecular-genetic testing. Am J Clin Pathol 1999;112:14 –21. 10. Lapworth R, Teal TK. Laboratory blunders revisited. Ann Clin
Biochem 1994;31:78 – 84.
11. Valenstein P, Meier F. Outpatient order accuracy. A college of American Pathologists Q-Probes study of requisition order entry accuracy in 660 institutions. Arch Pathol Lab Med 1999;123: 1145–50.
12. Khoury M, Burnett L, Mackay MA. Error rate in Australian chemical pathology laboratories. Med J Aust 1996;165:128 –30. 13. Jones BA, Calam RR, Howanitz PJ. Chemistry specimen
14. Carraro P, Servidio G, Plebani M. Hemolyzed specimens: a reason for rejection or a clinical challenge? Clin Chem 2000;46:306 –7. 15. Negri M, Carraro P, Caenaro G, Cappelletti P, Giavarina D, Mezzena G, et al. External quality assessment of stat test intralaboratory turnaround times. Clin Chem Lab Med 1998;36: 867–70.
16. Zardo L, Secchiero S, Sciacovelli L, Bonvicini P, Plebani M. Reference intervals: are interlaboratory differences appropriate? Clin Chem Lab Med 1999;37:1131–3.
17. Smith BJ, McNeely MDD. The influence of an expert system for testing ordering and interpretation of laboratory investigations. Clin Chem 1999;45:1168 –75.
18. Oosterhuis WP, Ulenkate HJLM, Goldschmidt HMJ. Evaluation of LabRespond, a new automated validation system for clinical laboratory test results. Clin Chem 2000;46:1811–7.
19. The Royal College of Pathologists. Guidelines for the provision of interpretative comments on biochemical reports. Bull R Coll Pathol 1998;104:25.
20. Marshall WJ, Challand GS. Provision of interpretative comments on biochemical reports. Ann Clin Biochem 2000;37:758 – 63. 21. Boone DJ, Steindel SD, Herron R, Howanitz PJ, Bachner P, Meier
F, et al. Transfusion medicine monitoring practices. Arch Pathol Lab Med 1995;119:999 –1006.
22. Baele PL, De Bruyere M, Deneys V, Dupont E, Flament J, Lamber-mont M, et al. Bedside transfusion errors. A prospective survey by the Belgium SAnGUIS Group. Vox Sang 1994;66:117–21. 23. Witte DL, VanNess SA, Angstadt DS, Pennell BJ. Errors, mistakes,
blunders, outliers, or unacceptable results: how many? Clin Chem 1997;43:1352– 6.
24. Hurst J, Nickel K, Hilborne LH. Are physicians’ office laboratory results of comparable quality to those produced in other labora-tory settings? JAMA 1998;279:468 –71.
25. Stull TM, Hearn TL, Hancock JS, Handsfield JH, Collins CL. Variation in proficiency testing performance by testing site. JAMA 1998;279:463–7.
26. Jenny RW, Jackson-Tarentino KY. Causes of unsatisfactory perfor-mance in proficiency testing. Clin Chem 2000;46:89 –99. 27. Cembrowski GS, Carey RN. Adding value to proficiency testing
programs [Editorial]. Clin Chem 2000;46:7– 8.
28. Blumenthal D. The errors of our ways [Editorial]. Clin Chem 1997;43:1305.
29. Gray TA. Clinical governance. Ann Clin Biochem 2000;37:9 –15. 30. Bonini PA, Sanna A. A kiosk and a smart cart to bring the hospital
services closer to the patient. LabAutomation2000 Final Confer-ence Program, January 22–26, 2000, Palm Springs, CA:85. 31. Bonini PA., Rubboli F. Risk of errors in complex health care
delivery systems. A multidimensional approach [Abstract]. Clin Chem Lab Med 2001;39:77.
32. Shulman IA, Lohr K, Derdiarian AK, Picukaric JM. Monitoring transfusionist practices: a strategy for improving transfusion safety. Transfusion 1994;34:11–5.
33. Serig DI. Radiopharmaceutical misadministrations: what’s wrong. In: Bogner MS, ed. Human error in medicine. Hillsdale, NJ: LEA Publishers, 1994:179 –95.
34. Sanna A, Wilikens M, Borio di Tigliole A, Klein G, Bonini PA. Safety procedures for identification of patient related object. CEN Document N00-049. http://www.centc251.org/tcmeet/doclist/doclist2000. htm (Accessed October 2001).
35. Leape LL, Woods DD, Hatlie MJ, Kizer KW, Schroeder SA, Lund-berg GD. Promoting patient safety by preventing medical error. JAMA 1998;280:1444 –7.
36. Nutting PA, Main DS, Fischer PM, Stull TM, Pontious M, Seifert M, et al. Problems in laboratory testing in primary care. JAMA 1996;275:635–9.
37. Stahl M, Lund ED, Brandslund I. Reasons for a laboratory’s inability to report results for requested analytical tests. Clin Chem 1998;44:2195–7.
38. Renner SW, Howanitz PJ, Bachner P. Wristband identification error reporting in 712 hospitals. A College of American Pathologists’ Q-Probes study of quality issues in transfusion practice. Arch Pathol Lab Med 1993;117:573–7.
39. McClelland DBL, Phillips P. Errors in blood transfusion in Britain: survey of hospital haematology departments. BMJ 1994;308: 1205– 6.
40. Linden JV, Kaplan HS. Transfusion errors: causes and effects. Transfus Med Rev 1994;8:169 – 83.
41. Taswell HF, Galbreath JL, Harmsen WS. Errors in transfusion medicine. Detection, analysis, frequency, and prevention. Arch Pathol Lab Med 1994;118:405–10.
42. Linden JV. Decrease in frequency of transfusion fatalities. Trans-fusion 1997;37:243– 4.
43. Williamson LM, Lowe S, Love EM, Cohen H, Soldan K, McClelland DB, et al. Serious hazards of transfusion (SHOT) initiative: analy-sis of the first two annual reports. BMJ 1999;319:16 –9. 44. Linden JV, Wagner K, Voytovich AE, Sheehan J. Transfusion errors
in New York State: an analysis of 10 years’ experience. Transfu-sion 2000;40:1207–13.
45. McSwiney RR, Woodrow DA. Types of error within a clinical laboratory. J Med Lab Technol 1969;26:340 – 6.
46. Souverijn JHM, Swaanenburg J, Visser R. Onderzoek naar de nauwkeurigheid waarmee monsters worden geselecteerd op een klinisch-chemisch laboratorium. Tijdschrift NVKC 1980;6:183– 4. 47. Chambers AM, Elder J, O’Reilly DS. The blunder-rate in a clinical
biochemistry service. Ann Clin Biochem 1986;23:470 –3. 48. Boone DJ. Comment on “Random errors in haematology tests”.