SUPPLEMENTAL WATER RELEASES FOR FISHERIES RESTORATION IN A
BRAZILIAN FLOODPLAIN RIVER: A CONCEPTUAL MODEL
yALEXANDRE L. GODINHO,a* BOYD KYNARDband CARLOS B. MARTINEZc
a
Graduate Program in Wildlife and Fisheries Conservation, University of Massachusetts Amherst, MA 01003, USA
b
U. S. Geological Survey, Leetown Science Center, S. O. Conte Anadromous Fish Research Center, Turners Falls, MA, USA
c
Fish Passage Center, Federal University of Minas Gerais, Minas Gerais, Brazil
ABSTRACT
Highly productive floodplain rivers in Brazil and elsewhere provide livelihood and recreational fishing for millions of people around the world, but damming and controlled water discharge are a threat to these valuable ecosystems. Supplemental water releases (SWRs) at a dam are increasingly used for restoring fisheries productivity in many floodplain rivers. We proposed a conceptual model for a hypothetical water release to enhance fisheries using Treˆs Marias Reservoir (TMR) on the Sa˜o Francisco River (SFR), Brazil. The information needed by the model follows: (i) Biologically, what is the best release date? (ii) How much water will be released? (iii) What is the pattern of impoundment and how much impounded water will be released? (iv) What is the lost revenue to the power plant associated with SWR? (v) What is the relationship between river discharge and the area of floodplain that is flooded? (vi) What is the relationship between SWR and fisheries value? Ichthyoplankton studies in the SFR showed a clear positive relationship between fish density and water level (WL). While the relationship between WL and floodplain area flooded and recruitment is not known, we concluded the best date for release is when there is a natural flood, which naturally triggers fish spawning and the SWR will add to the natural flood and cover a greater floodplain area. The released volume will range from 0.302 km3 to 2.192 km3, depending on SWR duration. In most years from 1976 to 2003, TMR impounded enough water for SWR only in the second half of the fish-spawning season (January–March). Lost revenue at TMR depended on release volume and ranged from US$ 0.493 million to US$ 3.452 million for the actual power rate. However, SWR could increase commercial fisheries income an estimated US$ 4.468 million. We forecast that SWR can bring fisheries benefits that surpass the lost revenue. Published in 2007 by John Wiley & Sons, Ltd.
key words: hydroelectric dam effects; floods; fisheries restoration; floodplain restoration; fish spawning; ichthyoplankton drift
Received 26 January 2007; Accepted 22 February 2007
INTRODUCTION
Millions of people around the world count on highly productive floodplain rivers for commercial, subsistence and recreational fisheries (Bayley, 1981; Thuok, 1998; Craiget al., 2004). These fisheries ultimately depend on floods because flooding is the principal factor responsible for productivity in floodplain rivers (Junket al. 1989). Fisheries harvest is directly related to the frequency and intensity of natural floods (Welcomme and Hagborg, 1977; Moses, 1987; Smolderset al., 2000). However, fisheries in floodplain rivers are threatened by anthropogenic activities such as river damming, which attenuates intensity of floods, and construction of dikes along river banks, which prevent flood waters reaching floodplain lakes.
Supplemental water releases (SWRs) from dams can be used to create the high water conditions required to restore fisheries that have declined (Cowx, 1994). A series of water releases in the Pongolo River, South Africa, induced fish to spawn and flooded the floodplain lakes fish use for rearing (Welcomme, 1989). Also, SWR from Shire River Dam, Malawi, improved the fisheries catch, and controlled discharge from the Kariba Reservoir, Zambezi River, Zambia/Zimbabwe, resulted in the occurrence of juveniles of several species in floodplain lakes.
River. Res. Applic.23: 947–962 (2007) Published online 12 July 2007 in Wiley InterScience (www.interscience.wiley.com) DOI: 10.1002/rra.1018
*Correspondence to: Alexandre L. Godinho, Fish Passage Center, Federal University of Minas Gerais, 31270-901 Belo Horizonte, Minas Gerais, Brazil. E-mail: agodinho@ufmg.br
An in-depth discussion of the importance of SWRs for biota is found in Stanfordet al.(1996), Galatet al. (1998), and Koel and Sparks (2002).
The Sa˜o Francisco River (SFR; Figure 1), Brazil, located southeast of the Amazon River, was once a major inland fishing river. Menezes (1956) cited several impressive fisheries reports from the river during the first half of the last century. For instance, Carneiro (1921) reported that 6000 surubims (Pseudoplatystoma corruscans) weighing 5–50 kg were harvested in one floodplain lake with just one seine haul. Seine hauls that captured 12 000 surubims and 3000 fish of various species were reported and harvests of 4000–5000 fish were common (Magalha˜es, 1942). Contemporary fisheries landings in the SFR are much lower than the historical level and they continue to decline (Godinho and Godinho, 2003). For instance, the yield of commercial fishers’ at Pirapora, an important fishing area in the middle course of the SFR at river km (rkm) 1978 decreased from 11.7 kg per fisherday1in 1987 to 3.1 kg per fisherday1in 1999 (Godinhoet al., 1997; Godinho and Godinho, 2003). Harvest was also reduced in quality. Surubim, the most valuable fish, was 86% of the yield in 1987, but only 27% in 1999 (Godinho et al., 1997; Godinho, unpublished work). This collapse of the fisheries threatens a traditional livelihood of thousands of families along the river (Valencioet al., 2003).
The SFR has experienced changes in flood intensity and frequency due to both natural and human changes. Lack of significant floods that occurred historically is likely one of the major factors responsible for the recent fishery collapse in the SFR. Flooding controls river productivity (Junk et al. 1989), affecting rearing success and recruitment of fisheries species that use floodplain lakes as their main nursery ground (Sato and Godinho, 2003). Additionally, floods are needed for successful spawning (Godinho and Kynard, 2006). The last major flood in the SFR was in 1992 when the river reached 11.8 m (a 20-year recurrence interval flood) in its middle course at rkm 1837. After 1992, all floods had recurrence interval of less than 3 years with maximum annual WLs ranging from 5.9 to 8.7 m. Collapse of the fishery forProchilodus lineatusin the Pilcomayo River was attributed to the absence of floods due to El Nin˜o (Smolderset al., 2000).
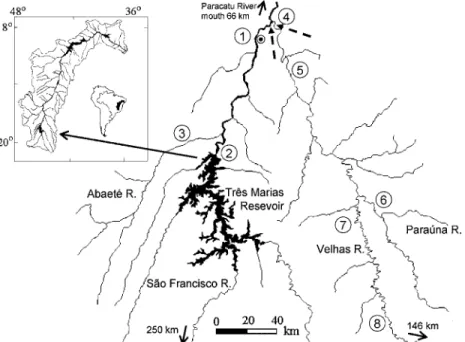
We proposed a conceptual model for SWR to address important information needs on biological, river, dam and reservoir, and economic factors. The questions we asked to generate data for the conceptual model were: (I) Biologically, what is the best release date? (II) How much water will be released? (III) What is the pattern of Figure 1. Map of the Sa˜o Francisco and Velhas rivers upstream the ichthyoplankton sampling sites (dashed arrows). Locations of gauging
stations are indicated by numbers (1¼Pirapora, 2¼Treˆs Marias, 3¼Abaete´, 4¼Guacuı´, 5¼Va´rzea das Palmas, 6¼Parau´na, 7¼Licinio,
8¼Raul Soares) and location of Pirapora city by ( ). Distance to the headwater is shown for Sa˜o Francisco and Velhas rivers. Insert shows the
impoundment and how much impounded water will be released? (IV) What is the lost revenue to the power plant associated with SWR? (V) What is the relationship between river discharge and the area of floodplain that is flooded? (VI) What is the relationship between SWR and fisheries value?
We applied questions I to IV of the conceptual model to the situation in the SFR to plan for potential SWRs from Treˆs Marias Reservoir (TMR; Figure 1). The goal of the SWRs is to increase fish recruitment and ultimately the fisheries by spilling water during the fish spawning season. This should enable early life stages to reach floodplain lakes where they rear, and enable them to return back to the river at a later time. We sampled ichthyoplankton to answer question I, and further, tested the hypothesis that flooding triggers fish spawning by comparing ichthyoplankton density in a regulated river (SFR) and a non-regulated river, the Velhas River (VR; Figure 1). We analyzed discharge data of the rivers and the impoundment at TMR to answer questions II and III. To address question IV, we estimated lost revenue for a range of SWR durations based on the TMR hydraulic head during each month of the spawning season and for a range of power rates. We alternatively estimated the annual drop in income using commercial fishery yield in the SFR before and after the fisheries collapse to determine the relationship between SWR and fisheries value.
FISHERIES AND STUDY SITE
Fisheries
The SFR basin is home to almost 160 species of freshwater fishes (Britskiet al.,1988; Sato and Godinho, 1999; Alves and Pompeu, 2001). Seven most important commercial species are migratory fishes that broadcast their semi-buoyant eggs (Satoet al., 2003, Sato and Godinho, 2003) during the rainy season (Bazzoli, 2003). Hatching 16–22 h after fertilization is a common feature among these fishes (Satoet al., 2003), and the larval stage ends within 3–5 days for five of these important species (Godinhoet al., 2003). Floodplain lakes are the major nursery grounds for early life stages and juveniles of important fisheries species (Satoet al., 1987, Pompeu and Godinho, 2003).
Treˆs Marias Dam and the river downstream
The TMR was built in the early 1960’s at rkm 2109 for flow regulation, flood control, irrigation and power generation (Britskiet al., 1988). It has never been used to produce a SRW to restore the fishery, but a 2002 state law requires dam owners to repair the damage if river flow regulation disrupts the nursery function of floodplain lakes. The TMR live storage is 15 278 km3and maximum hydraulic head is 57.5 m. The power plant installed capacity is 396 MW and maximum penstock discharge is 900 m3s1. To avoid flooding downstream, maximum allowed discharge is 3500 m3s1.
Downstream of TMR, the river runs free for 1090 km until Sobradinho Reservoir and flows through the states of Minas Gerais and Bahia (state border at rkm 1543). The mouths of the two largest tributaries, VR and Paracatu River, are located 157 and 243 km downstream of TMR. Mainstem discharge just downstream of these two tributaries is 73% of the total river discharge that reaches the ocean. Floodplain lakes along the mainsteam are abundant mainly downstream of the Paracatu River. The floodplain area downstream of TMR is estimated at 2000 km2(Welcomme, 1990). The rainy season is from October to March when rains supply 91% of the annual 1.13 m rainfall. December and January are the two rainiest months.
MATERIAL AND METHODS
What is the best release date?
We sampled for ichthyoplankton in the SFR and VR at sites located 3.5 km upstream from the junction of the two rivers (Figure 1). We sampled daily early in the morning and late in the afternoon from late November to early February during two consecutive spawning seasons (1998–1999 and 1999–2000). We used a conical net (32 cm mouth diameter, 140 cm long and 0.35 mm mesh size) set in the river channel 50 cm below the surface during 10–15 min to sample the ichthyoplankton. The net’s mouth had a mechanical flowmeter to measure the volume of
filtered water. We preserved the samples in a buffered solution of 5% formalin. After we sampled for ichthyoplankton, we measured water temperature, conductivity and turbidity with a Horiba U10 multi-parameter water quality meter.
We sorted each ichthyoplankton sample once and classified each individual in the following early life stages: egg, yolk-sac, preflexion, flexion and postflexion (Kendallet al., 1984). The stages from yolk-sac to postflexion correspond to the larva stage (Kendallet al., 1984). We classified damaged individuals that could not be classified into a development stage as unknown. We divided the number of individuals by the volume of filtered water to calculate density per m3. We calculated density per m3for each early life stage and for total ichthyoplankton, which included the unknown-stage individuals.
WL at gauging stations was determined once each day. We used data from two gauging stations in the SFR and four stations in the VR (Figure 1). We also used data from one gauging station located in the largest tributary upstream of each ichthyoplankton sampling site. Data from all gauging stations were provided by third parties except data for the most downstream station in the VR.
We used SAS (SAS Institute, 1999) for statistical analysis. We used chi-square to test for differences in frequency data between groups. For analysis of continuous variables, we used non-parametric statistics because most variables did not have a normal distribution. We used Wilcoxon two-sample test with normal approximation and continuity correction of 0.5 to compare data between two groups, Kruskal–Wallis test for comparisons when there were more than two groups, and Spearman correlation to test relationships between two continuous variables. For each early life stage except postflexion, we calculated the cross-correlation between daily fish density and WL with maximum delay time of 8 days, sufficient time for most migratory fishes to complete development of the larval stage (Godinho et al., 2003).
How much water will be released?
To calculate the SWR volume, we used an operating rule for a SWR with three discharge phases: increasing, stable and decreasing. Duration of both increasing and decreasing discharge phases was 24 h. During the increasing phase, discharge increased from 900 m3s1 (¼ maximum penstock discharge) to 3500 m3s1 (¼ maximum allowed discharge) at the rate of 108.3 m3s1per hour. We used the same rate during the decreasing phase to reduce discharge from 3500 to 900 m3s1. For the stable phase, we set the discharge¼maximum allowable discharge, and then we calculated the volume released during 1, 2, 3, 4, 5 and 6 days. We then calculated the SWR volume adding the volume of water used in each phase for SWR with total duration of 2 days (1 day increasing discharge and 1 day decreasing) to 8 days (1 day increasing discharge, 6 days stable and 1 day decreasing).
What is the pattern of impoundment and how much impounded water will be released?
We used the TMR historical data to determine the volume of water impounded in TMR every month from 1976 to 2003. We also calculated the percentage of SWR volume in relation to daily live storage for every day from November to March (the fish-spawning season) from 1976 to 2003.
What is the lost revenue to the power plant associated with SWR?
To determine Treˆs Marias power plant lost revenue (R), we used the following equation:
R¼X
n
t¼1
ðQth g"$Þ 103 (1)
wheretis hours since the beginning of spill,Qtis spill discharge (m3s1) at timetas determined by the SWR operating rule,his hydraulic head,gis gravity acceleration (¼9.8 m s2),eis power unit efficiency (¼0.84), and$
is power rate in US$/MWh. To convert currency, we used the exchange rate of US$ 1.00¼R$ 2.79 (R$¼Brazilian real) as of November 2004.
We calculatedRusing meanhfor each month from November to March 1976–2003. In addition, we calculatedR
power purchase agreement (i.e. US$ 18.83) between producer and the distribution companies that negotiate power produced by Treˆs Marias power plant (ANEEL, 2004). The greatest value was 14.3% greater than the mean power purchase agreement in Brazil in 2000 (ELETROBRA´ S, 2001), so estimates of R already incorporate future adjustments in the power purchase agreement.
What is the relationship between SWR and fisheries value?
To forecast the income increase, we used the decrease in commercial fishery annual income that followed the fisheries collapse in the SFR. We determined the commercial fishery annual income (I) before and after the collapse using the following equation:
I¼f d wCPUE (2)
wherefis the number of commercial fishers,dis the number of working days,wis the commercial value of a kilo of fish, and CPUE is the capture per unit of effort in kgfisher1day1. We consideredf¼1946, which is the number of fishers downstream of TMR in Minas Gerais state (Mirandaet al., 1988);d¼188, which is the number of days during the fishing season, excluded Saturdays, Sundays and holidays; andw¼US$ 1.42, which is the mean cost per kilogram of the three fish species that comprise most of the fisheries in 1997 (Franco de Camargo and Petrere, 2001). We used the CPUE of the commercial fishers’ of Pirapora in 1987 (¼11.7 kgfisher1day1) and 1997 (¼3.1 kgfisher1day1), i.e., before and after the SFR fisheries collapse, to calculate two values ofI. Then, we used the difference between them to forecast the increase inIafter a SRW.
RESULTS
What is the best release date?
During the 2-year sampling period, WL varied only 0.81 m in the SFR, but varied 3.38 m in the VR (Figure 2). Several floods happened each sampling season and they were always more intense in the VR. In the SFR, WL at Pirapora was significantly correlated with three physical–chemical variables—conductivity, temperature and turbidity (Spearman coefficient of correlation—rs; Table I). A similar relationship occurred between WL and physical–chemical variables at Guacuı´ in the VR (Table II). In both rivers, conductivity and temperature were negatively related to increasing WL while turbidity had a positivers. Absolute values ofrswere greater in the VR than in the SFR.
We sorted 15 803 eggs and larvae in the SFR and 25 921 eggs and larvae in the VR. Total ichthyoplankton density ranged from 0 to 39.9 individuals per m3in the SFR (median¼0.9) and from 0 to 51.8 individuals per m3in the VR (median¼2.8). Total ichthyoplankton density was significantly smaller in the SFR (Wilcoxon two-sample test:
W¼63653, df¼1,p<0.0001). Egg density was greater in the morning than in the afternoon in the SFR (Wilcoxon two-sample test: W¼17824, df¼1, P¼0.01) and in the VR (Wilcoxon two-sample test: W¼22899, df¼1,
P¼0.004).
Figure 2. Daily water level (WL) in the Sa˜o Francisco and Velhas rivers from late November to early February during two consecutive spawning seasons (1998–1999 and 1999–2000)
Daily variation of egg and larva densities was similar in both rivers (Figure 3). Density peaks were more frequent and, most of the time, greater in the VR than in the SFR. Egg and yolk-sac stages were more abundant among SFR ichthyoplankton while preflexion and flexion were more abundant in the VR. We caught very few postflexion: 68 in the SFR and 113 in the VR.
Eggs and larvae occurred during the entire sampling period (Figure 4). However, the Kruskal–Wallis test showed that density was not constant during the spawning season in the SFR (spawning season of 1998–1999:H¼57.2, df¼7,p<0.0001; spawning season of 1999–2000:H¼31.7, df¼7,p<0.0001) and in the VR (spawning season of 1998–1999: H¼40.9, df¼7, p<0.0001; spawning season of 1999–2000: H¼36.0, df¼7, p<0.0001). Greater densities were more common until the first 10 days of January in both rivers and spawning seasons. Floods also occurred more frequently until January in the Abaete´ River (chi-square test:x2¼52.8, df¼14,p<0.0001) and in the VR (chi-square test:x2¼124.4, df¼14,p<0.0001; Figure 5).
Among all gauging stations, egg density in both rivers had greatest correlation with WL of the largest upstream tributary (Tables I and II). Peaks of egg density in the SFR and VR were associated with floods in these tributaries (Figure 6). For instance, near the end of the 1998–1999 sampling season in the SFR, egg density peaked due to a 3-day, 22-cm flood in the Abaete´ River after 20 days of very low density or no drifting eggs and constant WL in the mainstem SFR. Furthermore, the total change in WL from one day to the next of the largest upstream tributary was associated with change in the egg density in the SFR (Kruskal–Wallis test:H¼18.4, df¼8,P¼0.02) and in the VR (Kruskal–Wallis test:H¼26.8 df¼14P¼0.02). In both rivers, we found the greatest egg densities when WL variation was positive (Figure 7). On the other hand, variations in discharge of TMR did not influence egg density in the SFR (Table I) and several small floods in SFR caused by only discharge from TMR were not followed by an increase in egg density.
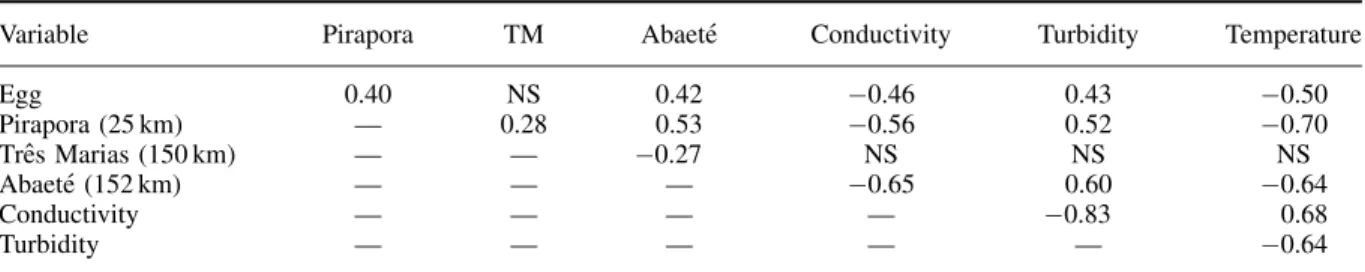
The egg and yolk-sac stages had the strongest cross-correlations with WL with a time lag of 0 or 1 day at all gauging stations (Table III). In general, the closer to the gauging station, the greater the correlation for these life Table I. Spearman correlation matrix of egg density, water level at three gauging stations (Pirapora, Treˆs Marias and Abaete´), conductivity, turbidity and temperature in the Sa˜o Francisco River
Variable Pirapora TM Abaete´ Conductivity Turbidity Temperature
Egg 0.40 NS 0.42 0.46 0.43 0.50 Pirapora (25 km) — 0.28 0.53 0.56 0.52 0.70 Treˆs Marias (150 km) — — 0.27 NS NS NS Abaete´ (152 km) — — — 0.65 0.60 0.64 Conductivity — — — — 0.83 0.68 Turbidity — — — — — 0.64
Gauging station distance to the ichthyoplankton sampling site is given. Abaete´ gauging was located in the Abaete´ River and the two other gauges were in the Sa˜o Francisco River. Mean daily values were used to calculate correlation coefficient for egg density, conductivity, turbidity and
temperature. All coefficients withP0.001 except NS, which was not significative.
Table II. Spearman correlation matrix of egg density, water level at four gauging stations (Guacuı´, VP¼Va´rzea das Palmas, Licinio and Parau´na), pH, conductivity, turbidity and temperature in the Velhas River
Variable Guacuı´ VP Licinio Parau´na Conductivity Turbidity Temperature
Egg 0.51 0.50 0.49 0.54 0.38 0.39 0.50 Guacuı´ (3 km) — 0.94 0.87 0.76 0.79 0.79 0.86 VP (65 km) — — 0.91 0.82 0.78 0.82 0.83 Licinio (281 km) — — — 0.74 0.76 0.74 0.78 Parau´na (292 km) — — — — 0.53 0.62 0.66 Conductivity — — — — — 0.76 0.75 Turbidity — — — — — — 0.68
Gauging station distance to the ichthyoplankton sampling site is given. Parau´na gauging station was located in the Parau´na River and all others were in the Velhas River. Mean daily values were used to calculate correlation coefficient for egg density, conductivity, turbidity and temperature.
stages. Preflexion had the strongest cross-correlation with WL mostly with a time lag of 2 or 3 days. The flexion stage had the strongest cross-correlation with WL with a time lag of 3 days in the SFR and 4–7 days in the VR.
How much water will be released?
During the 24-h increasing phase of the SWR, 0.190 km3of water was used to increase the discharge from 900 to 3500 m3s1at the rate of 108.3 m3s1per hour. The same amount of water was used during the decreasing phase of Figure 3. Daily mean density of ichthyoplankton life stages in the Sa˜o Francisco (top panels) and Velhas (bottom panels) rivers during two
consecutive spawning seasons (1998–1999 and 1999–2000)
Figure 4. Mean and one standard deviation of total ichthyoplankton density in the Sa˜o Francisco and Velhas rivers from late November to early February during two consecutive spawning seasons (1998–1999 and 1999–2000). 10-day period comprises: 1 (day 1–10), 2 (day 11–20) and 3
the SWR. Therefore, SWR volume for a 2-day release (1 day increasing and 1 day decreasing) was 0.380 km3 (Table IV). Water released during stable discharge was 0.302 km3per day. Thus, SWR volume was 2.192 km3for an 8-day release (1 day of increasing discharge, 6 days stable and 1 day decreasing).
What is the pattern of impoundment and how much impounded water will be released?
From November to March 1976–2003, mean monthly water accumulation was 1.2041.173 km3(meanSD; range¼ 1.096 to 4.657 km3). During the spawning season, negative accumulation occurred during all months, but November was the only month with negative mean (Figure 8).
Figure 5. Percentage of days with flood (water level at any day at least 20 cm greater than the day before) from November to March in the Abaete´ and Velhas rivers. 10-day period comprises: 1 (day 1–10), 2 (day 11–20) and 3 (day 21–31). Historical data series cover 1963–2003 for the
Abaete´ River and 1938–2003 for the Velhas River
Figure 6. Daily mean egg densities in the Sa˜o Francisco (top panels) and Velhas (bottom panels) rivers near their junction and the daily water level (WL) in the biggest upstream tributary from late November to early February during two consecutive spawning seasons (1998–1999 and
From November to March 1976–2003, daily storage varied greatly (range, 1.322–15.162 km3; mean and SD, 9.2903.552 km3). Consequently, the percentage of SWR volume in live storage had a large range of variation (Figure 9). Mean percentages and ranges were greater in November and December and smaller in January to March. Mean percentage reached 13% in November and December for short-term SWR (up to 3 days) and 28–42% for Figure 7. Mean and one standard deviation of egg densities in the Sa˜o Francisco and Velhas rivers near their junction. Water level change is the
24-h variation in the biggest upstream tributary
Table III. Strongest cross-correlation between daily mean density of the ichthyoplankton life stage and water level at gauging stations in the Sa˜o Francisco and Velhas basins
Gauging station and distance Early life stage
Egg Yolk-sac Preflexion Flexion
Sa˜o Francisco Pirapora (25 km) 0.28 (0) 0.28 (1) 0.32 (2) 0.45 (3) Treˆs Marias (150 km) 0.19 (0) 0.18 (0) 0.02 (3) 0.28 (1) Abaete´ (152 km) 0.18 (0) 0.28 (0) 0.42 (2) 0.38 (3) Velhas Guacuı´ (3 km) 0.42 (0) 0.30 (0) 0.38 (2) 0.23 (7)
Va´rzea das Palmas (65 km) 0.37 (0) 0.26 (0) 0.37 (2) 0.12 (6)
Parau´na (281 km) 0.33 (0) 0.22 (1) 0.38 (3) 0.17 (7)
Licinio (292 km) 0.31 (0) 0.19 (0) 0.42 (1) 0.09 (5)
Raul Soares (499 km) 0.32 (0) 0.17 (1) 0.41 (3) 0.14 (7)
The day of the strongest coefficient of correlation is shown within parenthesis. Distance downstream to the ichthyoplankton sampling site is presented for each gauging station. All gauging station in the mainstem except those marked with asterisk which were in the first biggest tributary upstream of the ichthyoplankton sampling site.
Table IV. The volume of water released from Treˆs Marias Reservoir during supplemental water released (SWR) of various durations
SWR duration (days) Volume of water released (km3)
2 0.380 3 0.682 4 0.984 5 1.286 6 1.588 7 1.890 8 2.192
long-term SWR (6–8 days). In the other months, mean percentage was<21% for most SWR except for 7- and 8-day release in January and 8-day release in February.
What is the lost revenue to the power plant associated with SWR?
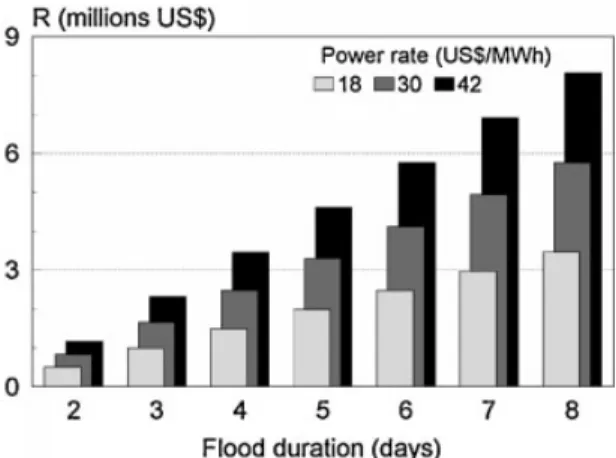
The mean hydraulic head (h) increased gradually from 48.7 m in November to 54.9 m in March during 1976–2003. Thus, lost revenue (R) was 13% greater for a SWR in March compared to a SWR in November. That difference did not depend on SWR duration or power rate ($).
Forh¼52.3 m, which was the meanhfor January to March 1976–2003,Rfor a 2-day SWR ranged from R$ 0.493 million ($¼US$ 18.00) to US$ 1.151 ($¼US$ 42.00; Figure 10). For every extra day,Rincreased in US$ 0.493 million ($¼US$ 18.00), US$ 0.822 million ($¼US$ 30.00) or US$ 1.151 million ($¼US$ 42.00). Thus,R
for an 8-day SWR varied from US$ 3.452 ($¼US$ 18.00) to US$ 8.056 million ($¼US$ 42.00).
What is the relationship between SWR and fisheries value?
The commercial fishery annual income in the SFR downstream TMR was estimated to be US$ 6.078 million in 1987 (prior to the fishery collapse) and US$ 1.610 million in 1997 (after the collapse). Thus, the annual income decrease following the fishery collapse was US$ 4.468 million.
Figure 8. Monthly volume of water (mean and range) impounded by Treˆs Marias Reservoir, 1976–2003
Figure 9. Percentage of the flood volume (mean and range) in the daily live storage of Treˆs Marias Reservoir for flood duration of 2–8 days in November to March. Live storage data covers 1976–2003
DISCUSSION
SWRs are of growing importance in many countries (Lubinskiet al., 1991; Peterken and Hughes, 1995; Waalet al., 1995; Acreman and Hollis, 1996). Restoration of the river–floodplain connectivity to enhance fisheries is frequently one of the goals of SWR (Galatet al., 1998; Lusket al., 2003). In Brazil, riverine fisheries are an important economic activity (Petrere, 1989), but the fisheries are threatened in many rivers due to hydropower development. Hydropower generation accounts for 90% of all electric power produced in Brazil and many more dams will be built to support a steady growing demand for power, which was 5.2% per year during the 1980’s and 1990’s (ANEEL, 2002). To mitigate the negative effects of hydropower development on Brazilian riverine fisheries, restocking and, more recently, fish passage have been used to enhance fisheries. To date, these mitigation methods have produced few significant results to restore fisheries. SWRs have not been used for fisheries restoration in Brazil although many studies have shown this technique can restore floodplains in Africa, North American and Europe (Acreman and Hollis, 1996; Michener and Haeuber, 1998; Buijseet al., 2002).
What is the best release date?
WL and physical–chemical variables were significantly correlated in both rivers. The lower correlations in the SFR may have occurred because most of the water came from the TMR hypolimnion where water quality differed from the metalimnion and tributaries downstream (Esteveset al., 1985; Sampaio and Lo´pez, 2003). Conductivity and temperature decreased and turbidity increased as WL increased during rains. Because WL was responsible for the changes in the three other variables, the influence of abiotic variables on ichthyoplankton density could be limited to only WL.
Eggs drifting in the SFR and VR showed that spawning occurred near the sampling sites because hatching within 16–22 h is common among the fishes spawning in both rivers (Satoet al., 2003). In fact, spawning grounds of two important fisheries species have been located near upstream from the egg sampling site in the SFR, i.e., 1 km for
Prochilodus argenteusand 23 km forPseudoplatystoma corruscans(Godinho and Kynard, unpublished work). A greater density of eggs drifting in the morning indicated that spawning was most intense during the afternoon, night and early morning.
Low density of preflexion and flexion stages in the SFR were due to a trapping effect of TMR, which stopped the downstream drift of the ichthyoplankton. Rivers upstream of TMR must carry eggs and larvae into the reservoir because the fish communities in those rivers are similar to the communities found downstream (Satoet al., 1987, Alves and Vono, 1998). However, the ichthyoplankton that drifts into TMR does not reach the SFR because ichthyoplankton density just downstream from TMR is virtually null (Godinho & Kynard, 2006). Consequently, most of the preflexion and flexion collected in the SFR come from the Abaete´ River, the longest tributary upstream from the ichthyoplank-ton sampling station. The trapping effect of TMR may also be responsible for the smaller total ichthyoplankichthyoplank-ton density in the SFR compared to the VR. The greater density of preflexion and flexion in the VR indicated that distant spawning grounds produced more offspring than the spawning sites just upstream from the sample site. Possibly, spawning sites
far upstream are more numerous or have a greater abundance of spawning adults. We captured very few postflexion larvae (0.4% in both rivers). This result may be due to fish developing into the postflexion stage only after they moved downstream past our sample sites or because postflexion larvae can avoid the net.
All data support the hypothesis that floods trigger spawning of SFR fishes. Thus, egg density had the highest correlation with WL, peaks of egg density were associated with peaks in WL, egg density increased after a positive WL change and density of initial early life stages had the strongest cross-correlation with nearby gauging station levels while density of older life stages were most correlated with distant, upstream gauging stations. Spawning during floods is also supported by observations that P. argenteus produce mating calls during floods, and pre-spawning P. corruscansvisit spawning grounds mostly during floods (Godinho and Kynard, 2006; Godinho
et al., in press). Fish spawning during floods was also noticed in a watershed near SFR where most spawning occurred when WLs were increasing (Schubart, 1949, 1954).
The positive correlation between increasing egg density and increasing WL also suggests a positive relationship between flood intensity and number of adults that spawn. In rivers where floodplain lakes are the most important nursery grounds for broadcast spawning fish, eggs and larvae have an increased probability of reaching the best nurseries if parents spawn during a major flood. Thus, fish that spawn only during large floods may have a selective advantage. However, a small fraction of the spawning adults spawned during small increases in WL (small floods), conditions where offspring clearly cannot reach floodplain lakes. Survival of offspring is also likely possible in the river, but survival is probably lower because ichthyoplankton density was lower during small floods. Finally, WL fluctuation explains only a fraction of the variation in egg density; therefore, other unknown factors likely influence the number of spawned eggs. There is a great need to examine the relationship between survival of young fish and rearing habitat (river vs. floodplain) in the SFR.
The biological data in the present study suggests the best time for a SWR is when a natural flood is occurring downstream of TMR. Spilling water simultaneously with a natural flood will increase the probability that the combined WL will be high enough to carry the ichthyoplankton produced during natural flood from the river into floodplain lakes. SWRs at TMR should only be done when a natural flood is happening downstream because normal water releases from TMR do not trigger spawning of SFR fishes.
Spawning by SFR and VR fishes produced a slightly increasing number of drifting eggs from November to early January. Interestingly, the historical frequency of natural flooding gradually increased until early January. Spawning at the beginning of the spawning season reduces the time fish spend waiting for a flood near the spawning ground so they can resume other activities (see Godinho and Kynard, 2006, and Godinhoet al.,in press, for details on pre-spawning movements of two SFR migratory fishes). Spawning early in the rainy season may also allow juveniles rearing in floodplain lakes to return to the river in the same rainy season they were born. Juveniles must leave many floodplain lakes to escape desiccation during the 6-month dry season.
Our egg and larva data indicated that SWR might be done any time during late November to early February. Other data, however, show that a SWR might be done after early February and even in March. For instance, three important fisheries species spawn in February and one spawned in March (Bazzoli, 2003). Also, pre-spawning
P. corruscansvisited spawning grounds in March (Godinhoet al., in press). Natural floods also occur in February and March, although they are not as frequent as in December and January.
How much water will be released?
The SRW volume was mostly determined by maximum discharge and SRW duration. We set the maximum discharge equal to the maximum allowed discharge because TMR discharge plus discharge from tributaries cannot surpass 4000 m3s1at Pirapora (ONS, 2002a) to avoid flooding two harbour patios (ONS, 2002b). This means that a SWR with maximum allowed discharge might not be enough to reach the floodplain lakes. In this case, SWR must be used to intensify a natural flood that is occurring downstream of Pirapora, particularly those floods coming from the Paracatu and Velhas rivers, the two biggest tributaries located, respectively, 28 and 114 km from Pirapora.
The larger the SWR the greater should be the increase in fish productivity and harvest. Studies by Welcomme (1976), Welcomme and Hagborg (1977) and Petrere (1983) indicate that fisheries yield in floodplain rivers is directly related to the area of the floodplain. Thus, flooding a large floodplain area would result in greater recruitment than flooding a smaller floodplain area. This justifies the use of maximum allowed discharge (or even
larger, if possible) during SWR, even if discharges of that intensity were historically rare events at Pirapora. The use of maximum allowed discharge does not guarantee yield increase because there is no available data that would enable us to determine the relationship between discharge and area of the floodplain actually flooded. Therefore, determining this relationship is vital for planning and evaluating any SWR strategy.
The SWR should last enough time to increase fisheries yield. Short-term SWR will cause less lost revenue, but may also result in limited fisheries benefits because of flooding a small area. The two last large natural floods in the SFR, which happened in 1979 and 1992, were famous significant increased catch afterwards and they each lasted a few weeks. The best scenario is that a natural flood plus a SWR would reach the great floodplains of the SFR in Bahia located upstream of the Sobradinho Reservoir. These floodplains are up to tens of kilometres wide (Sato and Godinho, 2003). The presence of young fish in floodplain lakes is known for several regions of the basin (e.g. Braga, 1964; Satoet al., 1987; Pompeu and Godinho, 2003), but the reports described in Menezes (1956) on fish abundance in the Bahia floodplains lakes are unique for the basin. All information indicates these are the most extensive and important nursery grounds in the whole basin. Flooding these lakes will likely multiply the benefits of a SWR. In our study, we did not consider the dampening of the SWR wave as it moves downstream. There is a need for a hydraulic model of the SFR that would enable managers to predict the SWR needed to flood the Bahia floodplains.
What is the pattern of impoundment and how much impounded water will be released?
Although TMR inflow usually increases in October with the onset of the rainy season, the reservoir showed mean positive water accumulation only after November. That happens because TMR is used to avoid a downstream flood greater than the maximum allowed discharge. Therefore, its operating rule foresees the onset of reservoir filling in the second half of December (ONS, 2002a).
The volume of water impounded by TMR during the fish spawning season had great year-to-year variation. For a long-term SWR, the released volume can be greater than the impounded volume until January. Moreover, it can be a large percentage of the live storage, especially in November and December. Because TMR impounds water during the entire spawning season, SWR is more feasible during the second half of the spawning season.
Two consecutive SWRs may be necessary to allow fish reared in floodplain lakes to return to the river and recruit into the riverine population. Biological data are needed to determine when a second SWR is appropriate and a hydraulic model is needed to determine the magnitude of SWR that is needed. During most years, TMR impounds enough water for two short-term SWRs in the same spawning season, but not for two long-term SWRs. For long-term SWRs, it will likely only be possible to have one per spawning season.
Change in the TMR operating rule should be evaluated in order to guarantee enough water for SWR. Such a change would mean filling the reservoir earlier or at a faster pace than predicted by the operating rule. If that is possible, a SWR might bring a secondary benefit to the local fishery. Godinho (1994) suggested that one reason for the low fish yield in TMR is the low offspring survival because of a mismatch between fish spawning and WL. Filling up TMR early might increase offspring survival as occurred in Cajuru Reservoir located upstream of TMR (Alves, 1995).
What is the lost revenue to the power plant associated with SWR?
Lost revenue due to a SWR, which we estimated ranged from US$ 0.493 million to US$ 8.056 million, is important to any decision regarding use of SWR as a fisheries management mitigation. Lost revenue did not show remarkable differences among months because mean hydraulic head did not vary greatly (range, 48.7–54.9 m). Lost revenue for a SWR in March, the month with the highest hydraulic head, would be 13% greater than in November, the month with the lowest hydraulic head. This means that lost revenue would be mostly determined by power rate, maximum discharge and SWR duration.
What is the relationship between SWR and fisheries value?
Even thoughRmight be large at first glance, particularly for the combination of a long-term SWR and greater power rate, the economic benefits of SWR may surpassR. We estimate that commercial fishery annual income had declined from US$ 6.078 million to US$ 1.610 million because of fisheries collapse.
The US$ 4.468 million decrease in the annual fishers’ income is, at the present time, the best possible forecast of the income increase that might result from a SWR. In this case, our premise is that SWR will be able to increase fishery yield back to the levels of late 1980’s. Compared toR, the forecast is greater than all except for that of the 7-and 8-day SWR at $¼US$ 30.00, and for SWR5 days at $¼US$ 42.00.
Previous estimates of fishery income do not accurately reflect the actual income because they do not incorporate the entire value of the fisheries. For instance, they do not include the income of the commercial fishery in Bahia or the income of the recreational fishing and fisheries tourism industries. The calculations also did not consider the non-monetary benefits of the subsistence fishery that occurs along the whole river. What the estimates really show is that SWR must be seen as an investment in the river’s fisheries resource and the people who earn a living from the river and that a SWR is not just lost revenue of an electricity generating plant. This investment can improve the quality of life for the families of thousands of commercial fishers that have suffered impoverishment and social exclusion after the fishery collapse in the 1990’s (Valencioet al., 2003).
ACKNOWLEDGEMENTS
This study was made possible thanks to Banco do Nordeste do Brasil; CEMIG; CNPq; PADCT-Ciamb (agreement number 62.0088/98-2); FAPEMIG; Po´s-Graduac¸a˜o em Ecologia, Conservac¸a˜o e Manejo de Vida Silvestre da UFMG; Pro´-Reitoria de Pesquisa da UFMG; S. O. Conte Anadromous Fish Research Center (USGS); and US Fish and Wildlife Service. We also thank William Bemis, Gilberto Cintron, Brenda R. Faria, Luiz A. Delage Filho, Marcelo F. Fonseca, Hugo P. Godinho, Alex Haro, Luz F. Jime´nez, Francis Juanes, Regina S. Lopes, Carlos A. K. Miranda, Luiz Fernando B. M. Silva and Bill Whitmore. This study was part of a Ph.D. dissertation of A. Godinho at the University of Massachusetts, Amherst, with a Brazilian government scholarship—CAPES —Brazil.
REFERENCES
Acreman MC, Hollis GE (eds). 1996.Water Management and Wetlands in sub-Saharan Africa. IUCN: Gland.
Alves CBM. 1995. Influeˆncia da manipulac¸a˜o artificial da e´poca de enchimento na produtividade ictiofaunı´stica em um reservato´rio de me´dio porte-UHE-Cajuru, Rio Para (MG). MSc thesis, Universidade Federal de Minas Gerais, Belo Horizonte.
Alves CBM, Pompeu PS. 2001.Peixes do rio das Velhas. Segrac: Belo Horizonte.
Alves CBM, Vono V. 1998. A ictiofauna do rio Paraopeba, bacia do rio Sa˜o Francisco, anterior a` construc¸a˜o da escada experimental para peixes.
Anais do Semina´rio Regional de Ecologia8: 1523–1537.
ANEEL. 2002.Atlas de energia ele´trica do Brasil. ANEEL: Brası´lia.
ANEEL. 2004. Resoluc¸a˜o homologato´ria no87, de 7 de abril de 2004.Dia´rio Oficial141(68): 128.
Bayley PB. 1981. Fish yield from the Amazon in Brazil: comparison with African river yields and management possibilities.Transactions of the
American Fisheries Society110: 351–359.
Bazzoli N. 2003. Paraˆmetros reprodutivos de peixes de interesse comercial. InA´ guas, peixes e pescadores do Sa˜o Francisco das Minas Gerais,
Godinho HP, Godinho AL. (eds). PUC Minas: Belo Horizonte; 291–306.
Braga RA. 1964. Disponibilidade de peixes em poc¸os do rio Sa˜o Francisco, Brasil.Boletim da Sociedade Cearense de Agronomia5: 77–86.
Britski HA, Sato Y, Rosa ABS. 1988. Manual de identificac¸a˜o de peixes da regia˜o de Treˆs Marias(3rd edn). Caˆmara dos Deputados/
CODEVASF: Brası´lia.
Buijse AD, Coops H, Staras M, Jans LH, Grift RE, Ibelings BW, Oosterberg W, Roozen FCJM. 2002. Restoration strategies for river floodplains
along large lowland rivers in Europe.Freshwater Biology47: 889–907. DOI: 10.1046/j.1365-2427.2003.01022.x.
Carneiro OB. 1921. De Pirapora a Joazeiro pelo rio Sa˜o Francisco. Belo Horizonte: Imprensa Oficial; 7-37 apud Menezes RS. 1956. Pesca e
piscicultura no Vale do Sa˜o Francisco.Boletim da Secretaria da Agricultura, Indu´stria e Come´rcio do Estado de Pernambuco23: 43–105.
Cowx IG. 1994. Strategic approach to fishery rehabilitation. InRehabilition of Freshwater Fisheries, Cowx IG. (ed.). Fishing News Books:
Oxford; 3–10.
Craig JF, Halls AS, Barr JJF, Bean CW. 2004. The Bangladesh floodplain fisheries. Fisheries Research 66: 271–286. DOI: 10.1016/
S0165-7836(03)00196-6.
ELETROBRA´ S. 2001. Tarifas me´dias do mercado de energia ele´trica. ELETROBRA´S Report IT 08/01. ELETROBRA´S: Rio de Janeiro.
Esteves FA, Amorim JC, Cardoso EL, Barbosa FAR. 1985. Caracterizac¸a˜o limnolo´gica preliminar da represa de Treˆs Marias (MG) com base em
alguns paraˆmetros ambientais ba´sicos.Cieˆncia e Cultura37: 608–617.
Franco de Camargo SAF, Petrere M Jr. 2001. Social and financial aspects of the artisanal fisheries of Middle SFR, Minas Gerais, Brazil.Fisheries
Galat DL, Fredrickson LH, Humburg DD, Bataille KJ, Bodie JR, Dohrenwend J, Gelwicks GT, Havel JE, Helmers DL, Hooker JB, Jones JR, Knowlton MF, Kubisiak J, Mazourek J, McColpin AC, Renken RB, Semlitsch RD. 1998. Flooding to restore connectivity of regulated,
large-river wetlands natural and controlled flooding as complementary processes along the lower Missouri River.Bio Science48: 721–733.
Godinho AL. 1994. Biologia reprodutiva da piaba-faca˜o,Triportheus guentheri(Characiformes, Characidae) e o manejo hidrolo´gico da represa
de Treˆs Marias.Revista Brasileira de Biologia54: 515–524.
Godinho AL, Godinho HP. 2003. Breve visa˜o do Sa˜o Francisco. InA´ guas, peixes e pescadores do Sa˜o Francisco das Minas Gerais, Godinho HP,
Godinho AL. (eds). PUC Minas: Belo Horizonte; 15–24.
Godinho AL, Kynard B. 2006. Migration and spawning of radio-tagged zulega (Prochilodus argenteus,Prochilodontidae) in a dammed Brazilian
river.Transactions of the American Fisheries Society135: 811–824. DOI: 10.1577/T04-176.1
Godinho AL, Kynard B, Godinho HP (in press). Migration and spawning of female surubim (Pseudoplatystoma corruscans, Pimelodidae) in the
Sa˜o Francisco River, Brazil.Environmental Biology of Fishes.DOI: 10.1007/s10641-006-9141-1.
Godinho HP, Godinho AL, Miranda MTO, Santos JE. 1997. Pesca e biologia do surubimPseudoplatystoma coruscansno rio Sa˜o Francisco, em
Pirapora, MG. InSurubim, Miranda MTO (ed.). IBAMA: Brası´lia; 27–42.
Godinho HP, Santos JE, Sato Y. 2003. Ontogeˆnese larval de cinco espe´cies de peixes do rio Sa˜o Francisco. InA´ guas, peixes e pescadores do Sa˜o
Francisco das Minas Gerais, Godinho HP, Godinho AL (eds). PUC Minas: Belo Horizonte; 133–148.
Junk WJ, Bayley PB, Sparks RE. 1989. The flood pulse concept in river-floodplain system.Canadian Special Publication of Fisheries and
Aquatic Sciences106: 110–127.
Kendall AW Jr, Ahlstrom EH, Moser HG. 1984. Early life history stages of fishes and their characters. InInternational Symposium Dedicated to
the Memory of Elbert Halvor Ahlstom, American Society of Ichthyologists and Herpetologists: Lawrence; 11–22.
Koel TM, Sparks RE. 2002. Historical patterns of river stage and fish communities as criteria for operations of dams on the Illinois River.River
Research and Applications18: 3–19. DOI: 10.1002/rra.630.
Lubinski KS, Carmody G, Wilcox D, Drazkowski B. 1991. Development of water level regulation strategies for fish and wildlife, Upper
Mississippi River System.Regulated Rivers: Research & Management6: 117–124.
Lusk S, Halacka K, Luskova V. 2003. Rehabilitating the floodplain of the lower River Dyje for fish.River Research and Applications19:
281–288. DOI: 10.1002/rra.740.
Magalha˜es E. 1942. A pesca do xare´u, a criac¸a˜o de um entreposto na Baı´a e a situac¸a˜o da pesca e aproveitamento do surubim no rio Sa˜o
Francisco.Boletim do Ministe´rio da Agricultura31: 1–23.
Menezes RS. 1956. Pesca e piscicultura no Vale do Sa˜o Francisco.Boletim da Secretaria da Agricultura, Indu´stria e Come´rcio do Estado de
Pernambuco23: 43–105.
Michener WK, Haeuber RA. 1998. Flooding: natural and managed disturbances.Bioscience48: 677–681.
Miranda MOT, Ribeiro LP, Arantes FS, Siqueira FS, Diniz MG. 1988.Diagno´stico do setor pesqueiro no estado de Minas Gerais. Research
report. SUDEPE: Belo Horizonte.
Moses BS. 1987. The influence of flood regime on fish catch and fish communities of the cross river floodplain ecosystem, Nigeria.
Environmental Biology of Fishes18: 51–65.
ONS. 2002a.Diretrizes para as regras de operac¸a˜o de controle de cheias—bacia do rio Sa˜o Francisco; ciclo 2002-2003, ONS Report RE 3/299/
2002. ONS: Rio de Janeiro.
ONS. 2002b.Inventa´rio das restric¸o˜es operativas hidra´ulicas dos aproveitamentos hidrele´tricos, ONS Report RE 3/331/2002. ONS: Rio de
Janeiro.
Peterken GF, Hughes FMR. 1995. Restoration of floodplain forests in Britain.Forestry68: 187–202.
Petrere M Jr. 1983. Relationships among catches, fishing effort and river morphology for eight rivers in Amazonas State (Brazil), during
1976–1978.Amazoniana8: 281–296.
Petrere M Jr. 1989. River fisheries in Brazil: a review.Regulated Rivers: Research and Management4: 1–16.
Pompeu PS, Godinho HP. 2003. Ictiofauna de treˆs lagoas marginais do me´dio Sa˜o Francisco. InA´ guas, peixes e pescadores do Sa˜o Francisco das
Minas Gerais, Godinho HP, Godinho AL (eds). PUC Minas: Belo Horizonte; 167–181.
Sampaio EV, Lo´pez CM. 2003. Limnologias fı´sica, quı´mica e biolo´gica da represa de Treˆs Marias e do Sa˜o Francisco. InA´ guas, peixes e
pescadores do Sa˜o Francisco das Minas Gerais, Godinho HP, Godinho AL (eds). PUC Minas: Belo Horizonte; 71–92.
SAS Institute. 1999.SAS OnlineDoc, 8th version. SAS Institute: Cary.
Sato Y, Cardoso EL, Amorim JCC. 1987.Peixes das lagoas marginais do rio Sa˜o Francisco a montante da represa de Treˆs Marias (Minas
Gerais). CODEVASF: Brası´lia.
Sato Y, Fenerich-Verani N, Godinho HP. 2003. Reproduc¸a˜o induzida de peixes da bacia do Sa˜o Francisco. InA´ guas, peixes e pescadores do Sa˜o
Francisco das Minas Gerais, Godinho HP, Godinho AL (eds). PUC Minas: Belo Horizonte; 275–289.
Sato Y, Godinho HP. 1999. Peixes da bacia do rio Sa˜o Francisco. InEstudos ecolo´gicos de comunidades de peixes tropicais, Lowe-McConnell
RH (ed.). Edusp: Sa˜o Paulo; 401–413.
Sato Y, Godinho HP. 2003. Migratory fishes of the Sa˜o Francisco River.Migratory fishes of South America, Carolsfeld J, Harvey B, Ross C, Baer
A (eds). World Fisheries Trust: Victoria; 195–232.
Schubart O. 1949. A pesca no Mogı´-Guassu´.Revista do Arquivo Municipal122: 121–166.
Schubart O. 1954. A piracema no rio Mogi Guassu´ (Estado de Sa˜o Paulo).Dusenia5: 49–59.
Smolders AJP, Velde G, Roelofs JGM, Guerrero-Hiza MA. 2000. El Nin˜o caused collapse of the sa´balo fishery (Prochilodus lineatus, Pisces:
Prochilodontidae) in a South American River.Naturwissenschaften87: 30–32.
Stanford JA, Ward JV, Liss WJ, Frissell CA, Williams RN, Lichatowich JA, Coutant CC. 1996. A general protocol for restoration of regulated
Thuok N. 1998. Inland fishery management and enhancement in Cambodia.FAO Fisheries Technical Paper374: 79–89.
Valencio NF, Leme AA, Martins RC, Mendonc¸a SAT, Gonc¸alves JC, Mancuso MI, Mendonc¸a I, Fe´lix SA. 2003. A precarizac¸a˜o do trabalho no
territo´rio das a´guas: limitac¸o˜es atuais ao exercı´cio da pesca profissional no alto-me´dio Sa˜o Francisco. InA´ guas, peixes e pescadores do Sa˜o
Francisco das Minas Gerais, Godinho HP, Godinho AL (eds). PUC Minas: Belo Horizonte; 423–446.
Waal LC, Large ARG, Gippel CJ, Wade PM. 1995. River and floodplain rehabilitation in Western Europe: opportunities and constraints.Archiv
fuer Hydrobiologie Supplement101: 679–693.
Welcomme RL. 1976. Some general and theoretical considerations on the fish yield of African rivers.Journal of Fish Biology8: 351–364.
Welcomme RL. 1989. Floodplain fisheries management. InAlternatives in regulated river management, Gore JA, Petts GE (eds). CRC: Boca
Raton; 210–233.
Welcomme RL. 1990. Status of fisheries in South American Rivers.Interciencia15: 337–345.