Structural Factors and Sexual Orientation Disparities in Adolescent Substance Use: A
Multi-Level Model
Melanie Somjen Frazer
Submitted in partial fulfillment of the
requirements for the degree of
Doctor of Philosophy
under the Executive Committee
of the Graduate School of Arts and Sciences
COLUMBIA UNIVERSITY
© 2019
Melanie Somjen Frazer
All Rights Reserved
Abstract
Structural Factors and Sexual Orientation Disparities in Adolescent Substance Use: A Multi-Level Model
Melanie Somjen Frazer
Studies consistently find sexual orientation disparities in tobacco, alcohol and marijuana use among adolescents in the United States (Goldbach, Tanner-Smith, Bagwell, & Dunlap, 2014;
Hatzenbuehler, Jun, Corliss, & Austin, 2015; Kann et al., 2018; Marshal et al., 2008; Mustanski, Van Wagenen, Birkett, Eyster, & Corliss, 2014). Having documented this elevated risk, the field has turned to identifying mediators that may explain the sexual orientation disparity in substance use behaviors. There is growing evidence that one of the mediators of sexual orientation-based health disparities is structural stigma—defined as “societal-level conditions, cultural norms, and institutional policies that constrain the opportunities, resources, and well-being of the stigmatized” (Hatzenbuehler & Link, 2014, p.2). Structural stigma can in turn lead to greater stress and subsequent negative coping behaviors among sexual
minorities (Hatzenbuehler et al., 2015; Hatzenbuehler & Link, 2014; Hatzenbuehler & McLaughlin, 2014; Pachankis, Hatzenbuehler, & Starks, 2014). However, most of this work has been conducted among adults and has focused on mental health outcomes (e.g., suicide attempts, psychiatric morbidity, mental distress) as opposed to specific substance use behaviors; further, if structural factors are found to affect sexual orientation health disparities and these can be altered, the gap between sexual minority and
heterosexual substance use can be narrowed through policy change. State-level substance use policy (e.g., levels of taxation of cigarettes and alcohol, policies that remove adolescent access to driving upon
substance use infractions) may also explain the gap in substance use prevalence between sexual minority and heterosexual youth because tobacco, alcohol and marijuana are also stigmatized substances and restrictive substance use environments may enhance the stigma attached to sexual minority youth.
This project aims to address these gaps in the literature. It uses multi-level modeling to test the association between (1) state-level sexual minority structural stigma (SMSS) and (2) state-level substance use policy environments (SUPEs) and sexual orientation disparities in recent substance use as measured in the Youth Risk Behavior Surveillance Survey (YRBSS). Analyses were also conducted to assess the size and direction of the association between SMSS and SUPE and state-level prevalence of substance use within heterosexual and sexual minority youth subpopulations. Analyses were conducted in
subpopulations of female and male youth.
Support was found for the structural stigma hypothesis among girls but not boys. Higher overall measures of sexual minority structural stigma were associated with larger disparities in tobacco use, alcohol use, and marijuana use among girls. Higher scores on the SMSS scale were associated with tobacco use among sexual minority girls but not heterosexual girls. Individual indicators of structural stigma (e.g., specific state-level policies) were also associated with disparities in these outcomes, as well as with the other outcomes tested (binge drinking and drunk driving). No such associations were found among male youth.
Very little support was found for the hypotheses that restrictive substance use policy
environments would be associated with larger sexual orientation disparities in substance use and that heterosexual but not sexual minority youth would demonstrate lower prevalence of substance use in restrictive states. Among girls, no associations were found between scales measuring the restrictiveness of substance use and sexual orientation disparities in substance use. A smaller sexual orientation disparity in recent cigarette smoking was associated with one indicator of restrictiveness: state enforcement of underage tobacco sale laws. Among boys, no associations were found between scales measuring the restrictiveness of substance use and sexual orientation disparities in substance use; two indicators of
heterosexual but not sexual minority boys, higher tobacco taxes were associated with lower prevalence of smoking.
This study raises several questions for future research on structural factors that may explain sexual orientation disparities in substance use behaviors among youth. For instance, future work is needed to understand the gender differences in response to structural stigma among sexual minorities. Sexual minority girls may have greater rejection sensitivity than sexual minority boys and thus may be more likely to use substances in response to structural stigma; however, further research is needed to test this hypothesis. In addition, the current study lacked data on the implementation of substance use policy environments, which may have masked important effects. A study of SUPE that includes measures of implementation of restrictive substance use policies is therefore needed to expand the work reported herein. Finally, a better understanding of gender identity and expression is needed; while the YRBSS measures “sex” and not gender or gender expression in these datasets, more information about these topics will help to understand how these factors may play into experiences of structural stigma and substance use policy environments.
List of Tables ... iii
Acknowledgements ... v
Chapter 1: Introduction ... 1
1.1 Substance Use as a Public Health Problem Among Adolescents ... 2
1.2 Sexual Orientation Substance Use Disparities Among Adolescents ... 3
1.3 Stigma as A Fundamental Cause of Health Inequalities ... 4
1.4 Stigma, Stress, and Substance Use ... 7
1.5 Substance Use Policy Environments ... 8
1.5.1 Taxation ... 9
1.5.2 General Restrictions ... 10
1.6 Specific Aims ... 11
Chapter 2: Methods ... 15
2.1 Data Sources ... 15
2.1.1 Individual-level Data Source ... 15
2.2.1 Group-Level Data Sources ... 17
2.2 Statistical Analysis ... 22
Chapter 3: Findings ... 25
3.1 Descriptive Findings ... 25
3.2 Findings Among Girls ... 32
3.2.1 Sexual Minority Structural Stigma and Substance Use Disparities ... 34
3.2.2 Sexual Minority Structural Stigma Within-Group Analyses ... 40
3.2.3 Substance Use Policy Environment and Substance Use Disparities ... 41
3.2.4 Substance Use Policy Environments Within-Group Analyses ... 46
3.3 Findings Among Boys ... 54
3.3.1 Sexual Minority Structural Stigma and Substance Use Disparities ... 57
3.3.2 Sexual Minority Structural Stigma Within-Group Analyses ... 61
3.3.3 Substance Use Policy Environment and Substance Use Disparities ... 62
3.3.4 Substance Use Policy Environments Within-Group Analyses ... 68
Chapter 4: Conclusions ... 77
4.1 Summary of Findings and Relation to Extant Literature ... 77
4.2 Limitations ... 83
4.3.3 Implementation and Substance Use Policy Environments ... 89
4.3.4 Peer Effects and Sexual Orientation Substance Use Disparities ... 89
4.4 Conclusions ... 90
Works Cited ... 91
Table 1: Sexual Minority Structural Stigma Indicators ... 19
Table 2: Tobacco and Alcohol Policy Environment Indicators ... 21
Table 3: Sample Distribution by State ... 25
Table 4: Age and Race among Girls and Boys by Sexual Orientation ... 26
Table 5: Sexual Minority Structural Stigma (SMSS) Indicators ... 28
Table 6: Tobacco Policy Environment Indicators ... 29
Table 7: Alcohol Policy Environment Indicators ... 30
Table 8: Sample Living in States with No Legal Status of Marijuana ... 32
Table 9: Prevalence of Sexual Minority Girls by State ... 32
Table 10: Recent Substance Use Among All Girls by State ... 33
Table 11: Sexual Orientation Disparities in Recent Substance Use Among Girls by State (AOR) ... 34
Table 12: Sexual Minority Structural Stigma and Sexual Orientation Disparities in Recent Cigarette Smoking Among Girls ... 35
Table 13: Sexual Minority Structural Stigma and Sexual Orientation Disparities in Recent Alcohol Drinking Among Girls ... 36
Table 14: Sexual Minority Structural Stigma and Sexual Orientation Disparities in Recent Binge Drinking Among Girls ... 37
Table 15: Sexual Minority Structural Stigma and Sexual Orientation Disparities in Recent Drunk Driving Among Girls ... 38
Table 16: Sexual Minority Structural Stigma and Sexual Orientation Disparities in Recent Marijuana Use Among Girls ... 39
Table 17: Sexual Minority Structural Stigma and Recent Substance Use Among Girls by Sexual Orientation ... 40
Table 18: Smoking Policy and Sexual Orientation Disparities in Recent Cigarette Use Among Girls ... 41
Table 19: Alcohol Policy and Sexual Orientation Disparities in Recent Alcohol Use Among Girls ... 42
Table 20: Alcohol Policy and Sexual Orientation Disparities in Recent Binge Drinking Among Girls .... 43
Table 21: Alcohol Policy and Sexual Orientation Disparities in Recent Drunk Driving Among Girls ... 44
Table 22: Legal Status of Marijuana and Sexual Orientation Disparities in Recent Marijuana Use Among Girls ... 45
Table 23: Smoking Policy and Recent Cigarette Use Among Girls by Sexual Orientation ... 46
Table 24: Alcohol Policy and Recent Alcohol Use Among Girls by Sexual Orientation ... 48
Table 25: Alcohol Policy and Recent Binge Drinking Among Girls by Sexual Orientation ... 50
Table 26: Alcohol Policy and Recent Drunk Driving Among Girls by Sexual Orientation ... 52
Table 27: Legal Status of Marijuana and Recent Marijuana Use Among Girls by Sexual Orientation ... 54
Table 28: Prevalence of Sexual Minority Boys by State ... 54
Table 29: Recent Substance Use Among All Boys by State ... 55
Table 30: Sexual Orientation Disparities in Recent Substance Use Among Boys by State (AOR) ... 56
Table 31: Sexual Minority Structural Stigma and Sexual Orientation Disparities in Recent Cigarette Smoking Among Boys ... 57
Table 32: Sexual Minority Structural Stigma and Sexual Orientation Disparities in Recent Alcohol Drinking Among Boys ... 58
Table 33: Sexual Minority Structural Stigma and Sexual Orientation Disparities in Recent Binge Drinking Among Boys ... 59
Table 34: Sexual Minority Structural Stigma and Sexual Orientation Disparities in Recent Drunk Driving Among Boys ... 60
Orientation ... 62
Table 37: Smoking Policy and Sexual Orientation Disparities in Recent Cigarette Use Among Boys ... 63
Table 38: Alcohol Policy and Sexual Orientation Disparities in Recent Alcohol Use Among Boys ... 64
Table 39: Alcohol Policy and Sexual Orientation Disparities in Recent Binge Drinking Among Boys .... 65
Table 40: Alcohol Policy and Sexual Orientation Disparities in Recent Drunk Driving Among Boys ... 66
Table 41: Marijuana and Sexual Orientation Disparities in Recent Marijuana Use Among Boys ... 67
Table 42: Smoking Policy and Recent Cigarette Use Among Boys by Sexual Orientation ... 68
Table 43: Alcohol Policy and Recent Alcohol Use Among Boys by Sexual Orientation ... 70
Table 44: Alcohol Policy and Recent Binge Drinking Among Boys by Sexual Orientation ... 72
Table 45: Alcohol Policy and Recent Drunk Driving Among Boys by Sexual Orientation ... 74
Table 46: Marijuana Policy and Recent Marijuana Use Among Boys by Sexual Orientation ... 76
Table 47: Summary of Findings Regarding Associations Between Sexual Minority Structural Stigma and Sexual Orientation Disparities in Substance Use and Prevalence within Sexual Orientation Groups ... 77
Table 48: Summary of Findings Regarding Associations Between Substance Use Policies and Sexual Orientation Disparities in Substance Use and Prevalence within Sexual Orientation Groups ... 80
First and foremost, I want to thank Dr. Shelly Campo, who told me when I was 17 that I would be a social scientist and who has seen to it that I became a good one, not only through her excellent teaching and mentorship but also by encouraging me and making me accountable to myself and to my academic projects. Without her and her partner, Esther Baker, who helped me learn to write and edit as well as being one of my dearest friends, I would not be the person I am today.
I want to thank my famil(ies): of origin (my parents, Dr. Thomas Frazer and Dr. Georgette Somjen, my stepmother, Dr. Carter Shelly and my brother Dr. Laszlo Frazer, for supporting me and being patient as I was the last to get a “Dr.” in front of my name and/or a “PhD” at the end); of choice: my wife Andrea Bowen, my son Carter Matthew Bowen-Frazer, Erin Howe and the staff, past and present, of Strength in Numbers Consulting Group, where we work together every day to use the techniques of social science to understand and reduce stigma for marginalized groups. Our clients, especially those who work with LGBTQ young people at risk for or struggling with substance use, have inspired my work daily.
Thanks to my committee, Drs. Mark Hatzenbuehler, Peter Messeri, Connie Nathanson, Katherine Keyes and John Pachankis and my professors at Columbia University, especially Theo Sandfort, Peter Bearman, Kim Hopper and Jennifer Hirsch. My colleagues in Sociomedical Sciences also deserve a huge thanks, especially those in the First Drafts Club where I worked out many of the ideas here and learned to better express them.
I also want to thank the staff of the Movement Advancement Project, who collect and update state-level information on policies related to LGBTQ people and were very generous in sharing not only data but also the background information on their work that is so vital to understanding structural stigma. Lisa Whittle at the CDC and all of the YRBSS coordinators who worked with me to obtain data are also much appreciated.
Chapter 1: Introduction
Substance use among adolescents is a widespread concern for public health in the United States. In the 2017 Youth Risk Behavior Survey, 8.8% of students reported smoking one or more cigarettes in the past 30 days, 29.8% had drunk at least one alcoholic beverage on at least one of the past 30 days, 13.5% had four or more drinks (female) or five or more drinks (male)1, 5.5% had driven while drinking alcohol, and 19.8% had used marijuana one or more times in the 30 days before the survey (Kann et al., 2018).
Recent research suggests that sexual minorities are much more likely to use tobacco, alcohol, and marijuana than their heterosexual counterparts, and these disparities are observed in adolescents as well as adults (Balsam, Beadnell, & Riggs, 2012; Blosnich, Lee, & Horn, 2013; Corliss et al., 2014;
Hatzenbuehler, Wieringa, & Keyes, 2011; Institute of Medicine, 2011; Jun et al., 2010; Lowry, Johns, Robin, & Kann, 2017; Mustanski et al., 2014; Phillips et al., 2017; Rosario, Corliss, Everett, Reisner, et al., 2014). For example, recent YRBSS data show that sexual minority youth, compared to heterosexual youth, are more likely to have smoked cigarettes on at least one day in the past 30 (15.4% of LGB youth vs. 6.6% of heterosexual youth) (Kann et al., 2018), to have had at least one drink of alcohol in the past 30 days (39.9% vs. 32.2%), to have recently engaged in binge drinking (18.3% vs. 13.9%), to have driven when drinking alcohol (7.1% vs. 3.5%) and to have recently smoked marijuana (74.0% vs. 63.8%). A meta-analysis found that sexual minority youth were 2.76 times as likely to use cigarettes as heterosexual youth, 2.55 times as likely to use any alcohol, 1.34 times as likely to use heavy alcohol, and 1.56 times as likely to use marijuana (Marshal et al., 2008).
Understanding the causes of these sexual orientation substance use disparities is important, not only because one cannot improve population health without improvements in the most affected
communities, but also because there is a lack of understanding of how current polices that affect the lives
1 Consuming of 4 or more drinks for females and five or more drinks for males (in one sitting) will be referred to as
of adolescents may be affecting these disparities, including policies that may increase stigma against sexual minorities (referred to below as “structural stigma”) and those that restrict substance use among adolescents (referred to below as “substance use policy environments”).
This project is intended to contribute to the growing literature examining the policies associated with sexual orientation substance use disparities. The remainder of this chapter will provide a review of the literature and theory suggesting the importance of understanding the size and direction of the associations between structural stigma and substance use policy environments and sexual orientation-based substance use disparities among youth. Specifically, it will begin by describing substance use as a public health problem among adolescents, what is known about disparities in substance use prevalence between heterosexual and sexual minority youth (including the role that stigma plays in these disparities), how policies can reinforce or combat stigma, and how substance use policy environments affect
adolescent substance use. The chapter will conclude by offering hypotheses about each specific aim.
1.1 Substance Use as a Public Health Problem Among Adolescents
Research suggests that tobacco and alcohol are harmful to developing adolescent bodies and brains (Ammerman, Ryan, Adelman, & The committee on substance use, the committee on adolescence, 2015; Tenenbaum & Merrick, 2014; US Department of Health and Human Services, 2014; U.S.
Department of Health and Human Services (HHS), Office of the Surgeon General, 2016; Zeigler et al., 2005). According to a recent Surgeon General’s report (2016), substance misuse and substance use disorders cost $442 billion per year in the United States alone in costs to the health care system (although the specific costs of alcohol, tobacco and marijuana were not disaggregated in this study).
Young people who use tobacco are more likely to develop respiratory problems, oral and lung cancers, heart disease and other health problems, than those who do not use tobacco (Tenenbaum & Merrick, 2014). Young people who use alcohol are more likely to engage in other risky behaviors while
they are under the influence of alcohol, and heavy use of alcohol by adolescents is associated with neurocognitive problems, which may persist into adulthood (Zeigler et al., 2005).
The research on marijuana use among adolescents and its effects on adolescent brains, bodies and future health outcomes is less conclusive than that conducted on tobacco and alcohol. Some studies have found that young people who use marijuana can be affected by cognitive and memory problems that often do not remit upon diminished use in adulthood (Ammerman et al., 2015; Gonzalez & Swanson, 2012). A recent review of studies examining the effects of marijuana on adolescent brain structure found that there was an association between anxiety and marijuana use, but that the quality of the evidence linking marijuana use and negative outcomes is poor and that there is further research necessary to establish harmful effects of marijuana on adolescent brains (Cancilliere, Yusufov, & Weyandt, 2018). While research is being conducted on possible positive effects of cannabis use (for example, in treating pain or psychiatric disorders) among adults, some recent studies show that there are adverse effects and little positive benefit of cannabis for treatment of mental disorders (Black et al., 2019) and that better research is needed to evaluate the effects of cannabis on pain (Hill, Palastro, Johnson, & Ditre, 2017).
While many adolescents experiment with substances and experience few psychosocial or health issues associated with this experimentation, a smaller number use substances through later life and experience profound, lasting effects of use (Brook, Lee, Rubenstone, Brook, & Finch, 2014; Flory, Lynam, Milich, Leukefeld, & Clayton, 2004; Lee, Humphreys, Flory, Liu, & Glass, 2011; Rose, Winter, Viken, & Kaprio, 2014; Zeigler et al., 2005). For example, nine out of ten current cigarette smokers began smoking before age 18 and 98% started smoking before age 26 (US Department of Health and Human Services, 2014).
1.2 Sexual Orientation Substance Use Disparities Among Adolescents
Sexual orientation is an enduring pattern of sexual and/or romantic attraction to others, often defined by the relationship between one’s own gender and the gender(s) to which one is attracted (Institute of Medicine, 2011). Sexual minority youth are those who identify as gay, lesbian and bisexual;
some researchers also include those who may not identify as gay, lesbian or bisexual but who have had same-sex sexual contact (Kann et al., 2018). Sexual minority youth and adults experience a range of disparities in physical, mental and behavioral health as well as in access to health care (e.g. Balsam et al., 2012; Blosnich et al., 2013; Bränström, Hatzenbuehler, & Pachankis, 2016; Charlton et al., 2018; Corliss et al., 2014; Institute of Medicine, 2011; Li, Turner, Mustanski, & Phillips, 2018; Lowry et al., 2017; Mustanski et al., 2014; Phillips et al., 2017; Rosario, Corliss, Everett, Reisner, et al., 2014).
Dozens of studies have demonstrated the association between sexual minority status and elevated substance use. In addition to the data described above regarding the elevated prevalence of substance use among sexual minority youth (SMY) compared with heterosexual adolescents, studies have found that SMY are more likely to start drinking earlier (Garofalo, Wolf, Kessel, Palfrey, & DuRant, 1998) and to use alcohol more frequently (Faulkner & Cranston, 1998) and heavily (Corliss, Rosario, Wypij, Fisher, & Austin, 2008) than heterosexual youth. In addition to being more likely to smoke, SMY also initiate smoking at younger ages than heterosexuals (Marshal, Friedman, Stall, & Thompson, 2009). Research consistently shows that sexual minority youth are more likely to use marijuana than heterosexual youth (Hatzenbuehler et al., 2015; Marshal et al., 2008, 2009; Parnes, Prince, & Conner, 2018).
1.3 Stigma as A Fundamental Cause of Health Inequalities
Having documented this elevated risk in substance use among SMY relative to their heterosexual peers, the field has turned its attention to identifying risk factors and mechanisms that can explain this disparity. Scholars posit that one reason SMY are more likely to use illicit substances than heterosexual youth is because they experience harassment and victimization from non-SMY who hold prejudicial attitudes towards SMY (Blosnich & Horn, 2011; Haas et al., 2011; Marshal et al., 2008; Rosario, Corliss, Everett, Russell, et al., 2014). Minority populations that experience prejudice have poorer health even when controlling for differences in economic status because they experience stigma.
Stigma was defined by sociologist Erving Goffman as the condition of being “disqualified from full social acceptance” due to having a “discrediting” attribute of the body, of character or of membership in a group
(1974, p. 9). Stigma is socially constructed, and the subpopulations that experience stigma vary across time and space. Experiences of stigma are disempowering, as members of the dominant group can exert their power to deny stigmatized groups access to resources (Herek, 2009). A more recent definition of stigma applied in public health is the “co-occurrence of labeling, stereotyping, separation, status loss, and discrimination in a context in which power is exercised” (Hatzenbuehler, Phelan, & Link, 2013, p. 813).
Recent public health scholarship has pointed out that stigma is a fundamental cause of health disparities (Hatzenbuehler, Phelan, & Link, 2013). Fundamental causes of health conditions and
outcomes are those that inhere in social structures (including laws and policies) and affect multiple health conditions through multiple pathways (Link & Phelan, 1995). Stigma denies minority groups access to multiple forms of capital—financial, social, human, educational and others—making it difficult for them to access the prerequisites of good health.
There are a variety of theories about why sexual minorities are stigmatized by non-SMY. One emphasizes an origin of anti-gay attitudes in misogyny, suggesting that those who hold attitudes that denigrate women and femininity may associate same-sex desire among men to be feminizing of those men, and thus subject to stigma (R. Connell, 1987; R. W. Connell, 2005). Other theories emphasize the centrality of disgust; sexual minorities, in identifying as such, bring behavior considered “private” (sexual behavior) into public spaces, violating important social norms about the division between public and private space (Warner, 2000).
Drug users are also a stigmatized group (Becker, 1973). Recent work suggests that nearly half of smokers in New York City, for example, experience stigma and feel devalued as people because of their smoking (Evans-Polce, Castaldelli-Maia, Schomerus, & Evans-Lacko, 2015; Kulesza, Larimer, & Rao, 2013). One ethnographic study has suggested that for black women who smoke, the additional stigma associated with their use of cigarettes to cope with stress related to being dually marginalized—as black and as female—worsens their experiences of inequality (Antin, Annechino, Hunt, Lipperman-Kreda, & Young, 2017). This suggests that groups that already experience inequality due to prejudice may be particularly harmed by the addition of another form of stigma such as smoking or drug use. As will be
described below, public health has sometimes ignored the potential negative consequences of stigmatizing policies designed to decrease behaviors detrimental to health.
Stigma can manifest within an individual, during interpersonal interactions, or at the structural level (as in the case here, where policies are stigmatizing structures). Internalized stigma occurs when individuals believe the negative attitudes projected onto them by others and take them in, incorporating them into their own self-concept and their own judgment of their membership in the group that is targeted for stigma. For example, when gay people direct negative social attitudes towards themselves, they are experiencing internalized homophobia (Meyer & Dean, 1998; Plummer, 2002). For some sexual minority youth, the coming out process may resolve feelings of internalized homophobia and replace them with a sense of pride and belonging; for others, internalized homophobia may remain present (Frost & Meyer, 2009). Internalized homophobia (alternatively called “internalized homonegativity”) is associated with several adverse outcomes, including concealment of sexual identity; mental health symptoms (including depression (Heiden-Rootes, Wiegand, Thomas, Moore, & Ross, 2018); poor body image, low self-esteem, bulimia (Reilly & Rudd, 2006)); HIV/AIDS and associated risk behaviors (Amola & Grimmett, 2015; Williamson, 2000); substance use disorders (Weber, 2008); and drug use (Moody, Starks, Grov, & Parsons, 2018).
Interpersonal experiences of stigma occur when one person enacts prejudicial attitudes towards another who is a member of a stigmatized group through direct contact with that person (Allport, 1979; Dovidio, Glick, & Rudman, 2008; B. Link & Hatzenbuehler, 2016). Interpersonal experiences of stigma range from subtle microaggressions to serious physical violence. Among youth, peer victimization and bullying related to sexual orientation have been found to be associated with depression (Williams,
Connolly, Pepler, & Craig, 2005), alcohol use (Phillips et al., 2017), prescription drug use (Li et al., 2018) and a range of negative mental health outcomes (Poteat, Scheer, DiGiovanni, & Mereish, 2014; Poteat, Scheer, & Mereish, 2014; Williams et al., 2005). In addition to interpersonal experiences of stigma perpetuated by peers, much attention has been paid to the negative effects of family rejection of sexual
minority youth on adolescent and adult mental health (Ryan, Huebner, Diaz, & Sanchez, 2009; Ryan, Russell, Huebner, Diaz, & Sanchez, 2010; Ryan et al., 2010).
Attention to structural stigma and its effects on public health, including sexual minority structural stigma, has emerged more recently as a focus of public health scholarship. Structure has long been a focus of public health—as early as Engels’ writing about the effects of class structure on the health and life chances of the English working class (Engels, 1892). One structure of particular interest to public health researchers is policy, because there is evidence that certain policies can influence health outcomes, but unlike immutable factors such as genetic predisposition, they can be changed. Stigma is a structure when it inheres in policies and repeated practices that normalize or reinforce the idea that the stigmatized are inferior to others; it is also a structure in that it determines life chances through multiple pathways of influence (Hatzenbuehler, 2017; B. Link & Hatzenbuehler, 2016).
Stigmatizing policies can be overtly prejudiced, as when bans on same-sex marriage make clear that there are structures in place that denigrate gay and lesbian relationships, and they can be indirectly stigmatizing, as when people of color are disproportionately incarcerated under sentencing guidelines for crimes involving crack and cocaine compared to white people who are not jailed (Alexander, 2010). So are school policies that prohibit comprehensive, medically accurate sex education and exclude sexual minority youth, as well as curricula that fail to recognize the important contributions that sexual minority people have made to historical events (Kosciw, Greytalk, Giga, Villenas, & Danischewski, 2016;
Schwartz et al., 2017; Snapp, Burdge, Licona, Moody, & Russell, 2015). Structural changes, such as altering policies, can facilitate a move towards a climate of lower structural stigma. Examples of such affirmative policies include mandating coverage of issues related to sexual minorities in curricula or state recognition of same-sex relationships (Hatzenbuehler & Pachankis, 2016).
1.4 Stigma, Stress, and Substance Use
There is a growing body of literature to suggest that one mechanism that connects experiences of stigma to experiences of ill health is stress. Minority stress theory, most associated with the work of Ilan
Meyer (2003), suggests that experiences of stigma and prejudice lead to greater stress and lack of social support. He further suggests three sub-parts to this mechanism: “a) external, objective stressful events and conditions (chronic and acute), (b) expectations of such events and the vigilance this expectation requires, and (c) the internalization of negative societal attitudes” (p. 676). This hypothesis is well supported both in that there is a biomedical relationship between stress and harm to health and in that the existence of the stress disparity and the pathway to internalization has been well-specified and supported by data (Hatzenbuehler, 2009).
When stigma disempowers individuals through attributing discreditable attributes to them, it also causes physiological changes in the body. For example, it causes over-production of cortisol which has negative effects on memory, mental health and physical health. This connection has been shown specifically in sexual minorities by at least one study, in which sexual minorities who were exposed to high levels of structural stigma as adolescents had blunted cortisol reactions to stressors measured in later life (Hatzenbuehler & McLaughlin, 2014).
Adolescents (and adults) also sometimes try to manage feelings of stress by using substances such as tobacco, alcohol and marijuana, which then have subsequent negative health effects of their own (Charles, Mathias, Acheson, & Dougherty, 2017; Chassin, Pillow, Curran, Molina, & Barrera Jr., 1993; Copeland-Linder, Lambert, Chen, & Ialongo, 2011; Hoffmann & Su, 1998; Wills, Sandy, & Yaeger, 2002).
1.5 Substance Use Policy Environments
In this previous section, I considered policy environments that either promulgate or alleviate stigma and how these in turn may influence substance use behaviors among SMY and sexual orientation disparities in these outcomes. This section describes a different set of policy environments that may also affect substance use among SMY as well as sexual orientation disparities in substance use. Specifically, I review three groups of policies that states use to discourage substance use by adolescents. While the first two types, taxation and general regulation, are not exclusively for adolescents, they have been shown to
affect adolescent behavior. The third, prohibitions of substance use that are age-specific, are intended specifically to regulate adolescent behavior. This is an important distinction, as adolescent brains are more vulnerable to the effects of substance use, and thus attention to adolescent use is important to improving both current and future population health.
1.5.1 Taxation
Economic theory suggests that taxes influence the purchase and use of items because by raising the price of the item, taxes lower demand for it. In the case of potentially unhealthy items such as tobacco and alcohol, taxation should decrease use of those items, especially among people with fewer assets and others who tend to be price sensitive; in addition, research has shown that youth specifically are more affected by taxes than adults (Hingson & White, 2014). For example, in states with higher tobacco taxes, there are lower odds of smoking initiation and lower smoking among youth compared with states with lower taxes (van Hasselt et al., 2015). In states with higher alcohol taxes, there is similarly lower alcohol-related morbidity and mortality (Wagenaar, Tobler, & Komro, 2010) and lower binge drinking overall (Xuan, Blanchette, et al., 2015) compared with states with lower taxes.
Some scholars suggest that “sin taxes”—those imposed on activities such as smoking, alcohol use, gambling or pollution emissions—are stigmatizing and thus morally problematic: “ . . . as symbolic expressions of disapproval, excise taxes can be highly precise, differentiating sharply between good and bad commodities and even between the components of a commodity (e.g., glass, corn, wheat, rye, malted barley), and the commodity itself (e.g., bottled bourbon whiskey) (Carruthers, 2016, p. 2570).”
Associating taxation with assignment of moral judgment (e.g. corn is good, corn-derived alcohol is bad) assigns blame to those who use those substances in addition to dissuading their use through raising of prices. Whether or not that stigma is more salient or more harmful for groups that are already stigmatized, like sexual minorities, remains under-theorized.
Taxes also have effects on population health disparities. One study found, for example, that “ . . . real cigarette prices are strong determinants of youth smoking. Blacks, females, Hispanics, and low-SES
subpopulations are found to have a larger price response with respect to smoking prevalence . . .” (Tauras, Huang, & Chaloupka, 2013, p. 2). However, studies of this kind have not been done that determine the extent to which taxation influences sexual orientation disparities in substance use among youth.
1.5.2 General Restrictions
General restrictions are those not specifically targeted at adolescents. These range from complete prohibition (as of alcohol in “dry counties” or marijuana in many states) to restrictions on where and when substances can be consumed (e.g., clean air laws for tobacco-free workplaces and public accommodations or limits on the hours bars can operate and serve alcohol).
Restrictions on the location and time where adults can access tobacco and alcohol have been shown to be associated with lower prevalence of youth smoking (Farkas, 2000, Seigel et. al., 2005). Requiring registration of beer kegs, which makes provision of large quantities of alcohol at parties more difficult, has been shown to decrease youth drunk driving fatalities (Fell, Fisher, Voas, Blackman, & Tippetts, 2009). These types of restrictions have some impact on youth substance use behavior; however, as with studies of taxes, these effects of restrictions on youth have not been differentiated by sexual orientation.
Among adults, one study found that sexual orientation disparities (LGB vs. heterosexual) were smaller in states with more restrictive (compared to less restrictive) tobacco environments
(Hatzenbuehler, Keyes, Hamilton, & Hasin, 2014). One mechanism suggested for these findings is that LGB adults may move to states with more favorable policies regarding sexual orientation, and that because these favorable policies are associated with restrictive tobacco policies, LGB adults may be more exposed to restrictive tobacco environments than they are to nonrestrictive environments. However, unlike LGB adults, LGB youth live where their parents live and thus do not choose to live in states with positive environments; consequently, it is unclear whether these same findings would pertain to LGB youth.
Underage Restrictions. There are a number of regulations of tobacco and alcohol that apply only to minors (typically those under age 18 for smoking and under 21 for alcohol use in the United States).
For example, prohibitions on possession and purchase of alcohol, so-called “use/lose” policies (those that require revoking the driver’s license of any young person caught breaking alcohol-related laws or
policies), and zero tolerance for blood alcohol level (as opposed to allowing BAC levels up to .02) have all been shown to lower alcohol-related fatalities among youth drivers (Fell et al., 2009; Fell, Scherer, Thomas, & Voas, 2016; Hingson & White, 2014).
1.6 Specific Aims
This project proposes to use Youth Risk Behavior Survey (YRBS) data to test the associations between two state-level predictors--sexual minority structural stigma and substance use policy
environment--and sexual orientation disparities in recent substance use among adolescents. In doing so, it
not only contributes to a growing body of literature on SMY substance use but also provides preliminary data on the potential for structural interventions to reduce sexual orientation disparities in substance use. Specifically, the project proposes to:
Aim 1: Use multi-level modeling to assess the size and direction of the association between state-level indices of sexual orientation structural stigma and sexual orientation disparities in recent tobacco use, alcohol use, binge drinking, drunk driving and marijuana use in a population-based sample of adolescent girls and boys (i.e., between-group analyses).
Hypothesis #1: The growing literature on sexual minority structural stigma suggests that the
relationship between stigmatizing environments and sexual orientation disparities will be positive (that is,
there will be larger disparities in states with higher levels of sexual minority structural stigma, or if a causal argument is made, higher levels of structural stigma will cause sexual minority use to go up while non-SMY use will remain the same). This hypothesis is consistent with prior literature suggesting that sexual minority structural stigma is associated with sexual orientation disparaties in marijuana and other illegal drug use (Hatzenbuehler et al., 2015) and in tobacco use among adolescents (Hatzenbuehler, Keyes, et al., 2014) and tobacco and alcohol use among sexual minority men (Pachankis et al., 2014).
Aim 2: Use multi-level modeling to assess the size and direction of the association between state-level indices of sexual orientation structural stigma and prevalence of recent tobacco use, alcohol use, binge drinking, drunk driving and marijuana use among sexual minority and heterosexual boys and girls (i.e., within-group analyses).
Hypothesis #2: Following the literature suggesting that higher levels of structural stigma is associated with larger sexual orientation substance use disparities, the hypothesis corresponding to Aim 2 is that among sexual minority youth but not heterosexual youth, structural stigma will be associated with higher prevalence of substance use.
Aim 3: Use multi-level modeling to assess the size and direction of the association between state-level indices of restrictive substance use policies and sexual orientation disparities in recent tobacco use, alcohol use, binge drinking, drunk driving and marijuana use and in a population-based sample of adolescent girls and boys (i.e., between-group analyses).
Hypothesis #3: There is less evidence to guide hypotheses about the relationship between restrictive substance use policy environments and sexual orientation disparities in substance use among youth. While research on sexual orientation disparities in tobacco use has suggested that restrictive tobacco policy environments may narrow sexual orientation health disparities (Hatzenbuehler, Keyes, et al., 2014), the mechanisms suggested for this association are not applicable to adolescents and to some other substances. The article suggests that sexual mionrity adults may be attracted to living in liberal environments, which have restrictive smoking policies as well as pro-sexual minority policies. However, sexual minority youth do not often select the states in which they live. Further, some substance use policies (such as those regarding access to marijuana), are associated positively with liberal attitudes. This project hypothesizes that restrictive substance use policy environments will widen, rather than narrow,
sexual orientation disparities in substance use across all substances because adolescents are quite
sensitive to stigma, including stigma that inheres in drug use, and sexual minority youth, who are already subject to stigma, may find that it compounds, adds to stress and increases their use of negative coping mechanisms (such as drug use itself). In other words, more restrictive policies compound stigma
associated with substance use, which inheres in sexual minority youth because they are already stigmatized, and increase stress further, thus creating a perverse effect of increased substance use.
Aim 4: Use multi-level modeling to assess the size and direction of the association between state-level indices of restrictive substance use policies and prevalence of recent tobacco use, alcohol use, binge drinking, drunk driving and marijuana use among sexual minority and heterosexual boys and girls (i.e., within-group analyses).
Hypothesis #4: Among heterosexual youth, but not sexual minority youth, more restrictive substance use policies will be associated with lower prevalence of substance use. This is because the benefits of restrictive substance use for sexual minority youth are expected to be canceled out by the potential stigmatizing effect of these restrictive substance use policies.
Examining Gender Differences. One important methodological decision in this study was to approach each research question by examining sexual orientation-based substance use disparities among youth who indicate they are female separately from those who indicate they are male. While the gender gap in substance use and related disorders may be narrowing, there is persistent evidence to show that young women and young men differ in their biological and psychosocial responses to substance use (Keyes, Grant, & Hasin, 2008; McHugh, Votaw, Sugarman, & Greenfield, 2018). Further, substance use patterns differ between sexual minority men/boys and women/girls, and the size of the sexual orientation disparity in substance use is often larger for girls/women than boys/men (Hughes, Wilsnack, & Kantor, 2016; Rosario, Corliss, Everett, Reisner, et al., 2014; Talley, Hughes, Aranda, Birkett, & Marshal, 2014). For example, in one study of YRBS data from 2005 and 2007, separate analyses of female and male sexual minorities (compared with heterosexuals) found that the adjusted odds ratios (AORs) for smoking were 4.0 for females compared with 2.4 for males, 2.2 compared to 1.6 for recent alcohol use, and 2.2 vs. 1.5 for binge drinking; while statistical tests were not performed, in no cases did these confidence intervals overlap (Rosario et. al, 2014). Finally, there is some suggestive evidence that boys and girls may respond differently to restrictive substance use environments. For example, one examination of state-level taxes found that women are more responsive to these taxes than men are (i.e., smoke less in states
with higher tobacco policies), although the direction of these differences varies across studies, with some studies finding that women are more responsive to tax increases on cigarettes (Stehr, 2007), while others finding that men are more responsive)(see review in Azagba & Sharaf, 2011). While there are no specific hypotheses posited about the differences between sexual minority boys and girls in this study, the
analyses are stratified by sex because the research suggests that this is important to understanding data on sexual minority youth.
Chapter 2: Methods
This chapter describes the sources of data at the individual level (students in school sampled by the YRBSS in 2011 and 2013 in states where sexual orientation identity was measured) and the group level (policy indicators of structural stigma and substance use policy environments). It describes how the indices of sexual minority structural stigma were created, and how the subscales and scales for substance use policy environments were created. It shows the general and specific forms of the multi-level modeling equations used to estimate the parameters shown to test the hypotheses discussed in the introduction as well as the tests conducted for confounder variables and covariates.
As discussed in the introduction, there are four hypotheses tested in this manuscript.
2.1 Data Sources
2.1.1 Individual-level Data Source
The Youth Risk Behavior Survey (YRBSS) collects data biannually from high school students grades 9-12 across the nation about their health and well-being, including their use of tobacco, alcohol and marijuana. It uses a multi-stage cluster design in which schools are first selected in proportion to enrollment size and then intact classes of a specific subject or period are randomly selected (Brener et al., 2013; Mustanski et al., 2014). State response rates vary from 60% to 90%, and sample sizes for states vary (see “confounder analysis” below for tests of response rate confounding). As of 2013, 17 states also collected sexual orientation information, allowing for an analysis of the sexual orientation health
disparities in these states (Mustanski et al., 2014). The YRBSS has been used to assess individual-level risk factors for sexual orientation health disparities, but not for structural- and policy-related correlates of those disparities (Corliss et al., 2014; Mustanski et al., 2014; Newcomb, Birkett, Corliss, & Mustanski, 2014).
The 17-state YRBSS surveys that measure sexual identity most often do so using the question: “Which of the following best describes you?” and the response options 1) “heterosexual (straight),” 2) “gay or lesbian,” 3) “bisexual,” and 4) “not sure. For this analysis, students who were “not sure” were
excluded, those who selected “gay or lesbian” or “bisexual” were coded as 1 and those who selected heterosexual were coded 0. Gay/lesbian and bisexual youth were combined to increase the sample size and thus statistical power. The survey asks: “What is your sex?” with the response options “male” and “female” (the core, required survey module does not ask about gender, gender identity, or transgender identity).
The YRBSS asks about a variety of behaviors related to substance use; states may ask additional questions, but all YRBSS surveys share some measures of tobacco use, four measures of alcohol use and three measures of marijuana use. This analysis will confine itself to recent use. The strength of this approach is that it increases the likelihood that YRBSS respondents began to identify with their sexual orientation category prior to the substance use behavior taking place; however, it is a weakness in that recent substance use is not an indicator of substance abuse or a long-term habit of using substances. Recent substance use is measured by the following indicators:
1. “During the past 30 days, on how many days did you smoke cigarettes?”
2. “During the past 30 days, on how many days did you have at least one drink of alcohol?” 3. “During the past 30 days, on how many days did you have 5 or more drinks of alcohol in a row, that is, within a couple of hours?”
4. “During the past 30 days, how many times did you drive a car or other vehicle when you had been drinking alcohol?”
5. “During the past 30 days, how many times did you use marijuana?”
All youth who answered one or more days were coded as 1 for that substance, while those who reported using zero times were coded as 0.
The YRBSS also asks about demographic covariates of substance use, including age and race/ethnicity of the respondent. To measure race and ethnicity, the survey asks two separate questions. First, it asks, “Are you Hispanic or Latino?” with answer choices “yes” and “no” and then “What is your race? (select one or more responses)” with answer choices including “American Indian or Alaska Native”, “Asian”, “Black” “White” and “Other”. The multiracial category excludes Hispanic and Latino(a)
selected other races (this category is referred to as “Hispanic” in tables and text for the remainder of the manuscript). Some YRBSS sites use slightly different race and ethnicity categories, so all were recoded into a multicategorical race/ethnicity variable, with the following categories: American Indian/Alaska Native (only), Asian and Pacific Islander (only), Black or African American (only), White (only), Hispanic/Latino(a) (including those who also selected one or more other races) and all multiracial who did not select Hispanic/Latino(a). Tables refer to this category as “Hispanic” for brevity. Age was recoded into a multicategorical variable: 12 and under, 13 and 14, 15, 16, 17, and 18 years or older (12 and under and 13 year- and 14 year-olds were combined into one category because 13 years and 12 and under were very small categories).
Race and age were selected as covariates because they are associated with substance use among youth in many studies (Balbach, Hartman, & Barbeau, n.d.; Chaloupka & Pacula, 1999; Corliss et al., 2014), including those using YRBSS data (e.g. Ravello, Jones, Tulloch, Taylor, & Doshi, 2014). Further, previous studies examining the association between tobacco policies and sexual orientation disparities in tobacco use controlled for these factors (in addition to other data that are not available, such as income: see “limitations” section below) (Hatzenbuehler, Keyes, et al., 2014).
2.2.1 Group-Level Data Sources
Sexual minority structural stigma and related concepts have been operationalized in a variety of ways. “Institutionalized discrimination” has been measured using constitutional amendments banning same-sex marriage (Hatzenbuehler, McLaughlin, Keyes, & Hasin, 2010) in one study, while another used lack of state policies protecting lesbian, gay and bisexual people from employment discrimination and lack of inclusion of sexual orientation as a protected category in hate crime legislation (Hatzenbuehler, Keyes, & Hasin, 2009). Another study used state-aggregated mean attitude scores from surveys measuring public opinion on several topics (e.g., gay adoption, hate crimes, health benefits,
same-sex marriage, hate crime protections, adoption restrictions for same-sex couples, non-discrimination or anti-bullying laws enumerating sexual orientation) (Pachankis et al., 2014). Density of same-sex couples is used as an indicator of social context for LGB people by several other articles (Hatzenbuehler, Birkett, Van Wagenen, & Meyer, 2013; Hatzenbuehler, Keyes, & McLaughlin, 2011).
In order to capture the complex construct of sexual minority structural stigma (SMSS), this project used two domains that have been used in prior work (e.g., Hatzenbuehler et al., 2009; 2010; 2011): policies that disproportionately affect sexual minorities (including same-sex marriage bans, presence or absence of hate crime, employment, housing and public accommodation protects, etc.) and the density of same-sex couples at the state level (Table 1). In 2011, many states had bans on recognizing domestic partnership or marriage for same sex couples. In this index, those states were scored with a 1 for relationship recognition, while those that had no ban but also had no domestic partnership or marriage option for same-sex couples were scored with a 2. Finally, those with domestic partnership, marriage or both options for same-sex couples were scored with a 3. Similarly, for each type of protection (school non-discrimination, school anti-bullying, ability to adopt jointly as a same-sex couple, presence of hate crimes legislation, employment public accommodation and housing protection), the state was assigned a one; if the state lacked the protections for sexual orientation it was assigned a zero. Density of same-sex couples was divided into three categories, with the lowest density assigned a score of 1 (0.29-0.66), medium density a 2 (0.67-0.95), and high density a 3 (0.96-1.75).
The maximum scale score was 13. For the purposes of description (see, e.g., Table 3 in the Findings chapter), the population experiencing each policy is shown; however, for the purposes of analysis in the multilevel model, the SMSS index was reverse coded and standardized so that rather than showing the amount of protection for sexual minorities, the scale indicates the amount of stigma, as per the construct of interest in this study.
Table 1: Sexual Minority Structural Stigma Indicators Coding (1 = present, 0 = absent) Data Source Policy Same-Sex Relationship Recognition Ban 1 Movement Advancement
Project historical data and Human Rights Campaign No Recognition, No Ban 2 Same-Sex Relationship Recognition 3 School Non-Discrimination 1 School Anti-Bullying 1 Joint Adoption 1 Hate Crimes Legislation 1 Employment Protection 1 Public Accommodation Protection 1 Housing Discrimination Protection 1 Density of Same-sex Couples (Numbers per 1000 Households) 0.29-0.66 1 2010 Census data 0.67-0.95 2 0.96-1.75 3
Tobacco, alcohol and marijuana, the three substances of interest to this project, are regulated differently from one another. While there is currently a great deal of variation in the level of access to marijuana, in 2011 the states included in this study did not have wide variation, and thus the marijuana policy index was coded simply as having any legal status=1 (e.g., for research or medical use) or no legal status=0 (National Conference of State Legislators, 2016).
Tobacco and alcohol are regulated through restrictions and punishments specific to those who are under the legal age to purchase and use those substances, restrictions on use that apply to adult users, and restrictions on businesses. Both tobacco and alcohol are also taxed, with a per-pack tax that varies across states and beer, wine, and liquor taxes on alcohol that differ from one another due to the differing amount of alcohol in each type of beverage.
For the tobacco policy index, which is shown in Table 2, underage restrictions included were smoke-free campus laws, smoke-free school bus regulations, prohibitions on underage purchase, possession and use penalizing buyers who purchase cigarettes on behalf of someone underage (while tobacco is regulated in all states, the mechanism of underage regulation varies; thus, there is variation in the prohibitions on purchase, possession and use, even though it might appear that all three should be equally illegal in all states) (State Tobacco Activities Tracking and Evaluation, 2016). Restrictions on public use included those prohibiting smoking in vehicles, public and private workplaces and restaurants. Finally, the domain of business restrictions included the states’ ability to enforce tobacco sale laws against businesses (as opposed to only enforcing this on the minors themselves), requiring signs stating that selling to youth under the state limit is illegal, and the ability to revoke a business’ license to operate if they sell to underage users. Each of these indicators is coded with a 1 for present or a 0 for absent. All indicators were taken from the State Tobacco Activities Tracking and Evaluation database.
Table 2 also shows the domains for the alcohol policy index. Because so-called “use/lose” laws have been shown to be some of the most effective at decreasing alcohol-related mortality, these are the first domain tested. “Use/Lose” laws are those which suspend or revoke a driver’s license if he or she is under age and attempts to use or purchase alcohol (Alcohol Policy Information System (APIS), 2016). States can apply these laws using one or more of the following restrictions: suspending the license for purchasing alcohol, for possessing alcohol, or for consuming alcohol. Other underage policies,
specifically prohibitions on consumption, using blood alcohol level as evidence of consumption (called by policy makers “internal consumption”), prohibitions on alcohol purchases and a zero-tolerance level for underage blood alcohol content, were also included. Each of these indicators is coded with a 1 for
present or a 0 for absent. Finally, prohibitions on unregistered kegs, which has been shown to be an effective deterrent for teenagers, was also included. Three forms of taxation, on beer, wine and liquor, were also included.
Table 2: Tobacco and Alcohol Policy Environment Indicators
Tobacco Policy Domain Policy Alcohol Policy Domain Policy Underage Restrictions Range (0-6)
Smoke-Free Campus Use/Lose
Policies
Range (0-3)
Suspend or Revoke Drivers License for Underage Alcohol Purchase
Smoke-Free Bus Suspend or Revoke Drivers
License for Underage Alcohol Possession
Prohibit Underage Buying Tobacco
Suspend or Revoke Drivers
License for Underage Alcohol Consumption
Prohibit Underage Tobacco Possession
Underage Policies
Range (0-4)
Underage Alcohol Consumption Prohibited
Prohibit Underage Use of Tobacco
Underage Alcohol Consumption Blood Alcohol Level Prohibited Penalize Underage Buyer for
Cigarette Purchase
Underage Alcohol Purchase Prohibited
Public Restrictions
Range (0-4)
Smoking Banned in Vehicles Zero Underage Blood Alcohol Content
Smoking Banned in Private Workplaces
Unregistered Keg Policy (present=1, absent=0)
Unregistered Keg Prohibited
Smoking Banned in Government Workplaces Taxes Beer Smoking Banned in Restaurants Wine Business Restrictions Range (0-3)
Can Enforce Underage Tobacco Sale Laws Against Businesses
Liquor
Require Sign About Underage Tobacco Sale Ban
Revoke Business License for Underage Tobacco Sale
Tobacco Policy Domain Policy Alcohol Policy Domain Policy
Taxes Tax Per Pack of Cigarettes
Total Scale Range (0-11) Total Scale Range (0-8)
Additional indicators that were considered for inclusion but were homogenous or had only one or two states that differed from other states in this dataset included adult blood alcohol level and restrictions on the age of servers in bars and restaurants. Exceptions to policies (such as those that exempt parents from rules prohibiting furnishing alcohol to minors) were also excluded from the index for two reasons: first, they are nonstandard across sites and thus difficult to include in a scale, and second, they are very detailed and difficult to code as to their impact on the overall strictness of the policy environment.
In addition to the individual-level covariates described above, public opinion polling on sexual orientation and average income data were collected at the state level and tested for confounding,
consistent with prior studies (e.g., Pachankis et al., 2014). Neither was shown to be a confounder and thus were not included in the analyses.
2.2 Statistical Analysis
Analyses were conducted in Stata. In order to obtain estimates of the associations between state-level variables (i.e., structural stigma and state policy environments) and the sexual orientation substance use disparity, the multilevel model was specified in two steps. The procedure was followed in much the same manner for hypotheses relating to sexual minority structural stigma and those relating to substance use policy environments and so will be described only once below. The procedure was also repeated for each substance use behavior and within each sex category (female and male).
The procedure was as follows: Estimates of the sexual orientation substance use disparity were obtained within each of the 17 states in the dataset by predicting prevalence of substance use from sexual orientation (and two covariates, race and age). For summary purposes, estimates were also obtained for the entire sample; full-sample estimates are derived from equations predicting prevalence, not from
averages of state-level estimates. Because of the YRBSS’s sampling structure, these equations were specified using the “svy” family of commands in Stata, which allow for adjustment for nesting, clustering and stratified sampling. Weights provided in the datasets were used in all analyses. Weights were halved for states that were included in both years, as per instructions to analysts of the YRBSS dataset (Centers for Disease Control and Prevention, 2014). The estimated covariate representing the sexual orientation disparity was then predicted from the state-level policy variable. The covariate measuring the effect of the state policy was the focal statistic testing the hypotheses of interest to this project.
The full model for testing the association between sexual orientation substance use disparities is composed of the following equations, where the subscripts i and j refer to individuals and states (respectively);
Equation 1: Substij = boj+b1jLGB + b2Race + b3Age Equation 2: boj = boo+ s j1
Equation 3: b1j = bo1+ s j2
Equation 1 describes the individual level (i) equation for a state (j), in which an individual’s substance use is predicted from LGB status (1=LGB, 0=heterosexual), with the state level average substance use (boj ) and the state coefficient on LGB (B1j). The state level average substance use (boj ) is predicted from the constant average (boo) and the state variation (s j1) in substance use, while the state coefficient on LGB (b1j) predicted from the average coefficient (bo1) and the state-level variation in the coefficient (s j2)
Substituting the equations gives the full equation 4:
The final equation also includes the variation in policy restrictions. Because policies vary only at the state level, not at the individual level, the equation is given by:
Substij = (boo+ s j1)+( bo1+ s j2)LGB + b2Race + b3Age +b4Policy +b5Policy*LGB
The coefficient of interest for testing the hypothesis is b5.
Here substance use is predicted from the state-level constant average and the state-level variation. The procedure to estimate the association between state-level variables and substance use prevalence among sexual minority and heterosexual youth was as follows: state-specific estimates were calculated within sexual minority youth and then a second level regression was created estimating the association between these state-specific betas and the policy score for the state. The procedure was repeated for heterosexual youth.
The equations estimating the association between state-level policy variables and prevalence of substance use within sexual minority and heterosexual youth were specified by estimating the prevalence and predicting it from the state-level policy variable.
In addition to the main analytic method described above, supplementary analyses were conducted to evaluate the robustness of the approach using a logistic regression without multi-level modeling and a multi-level model without adjustment for complex sample design. These results are shown in Appendix I.
Chapter 3: Findings
This chapter describes the distribution of students in the 17 states that contributed to the dataset, including the percent of the dataset from each state (Table 3), demographic information among SMY and heterosexual girls and boys (Table 4) and the distribution of the sample who lived in states with each of the sexual minority structural stigma (SMSS) and substance use policy environment indicators (Tables 5 through 8). The subsequent two sections in this chapter describe first the female subsample and then the male subsample, with each section including the following: the distribution of sexual minority youth, the estimates of adjusted odds ratios that describe the substance use disparities between sexual minority and heterosexual youth, and the tests of hypotheses that address Aims 1-4.
3.1 Descriptive Findings
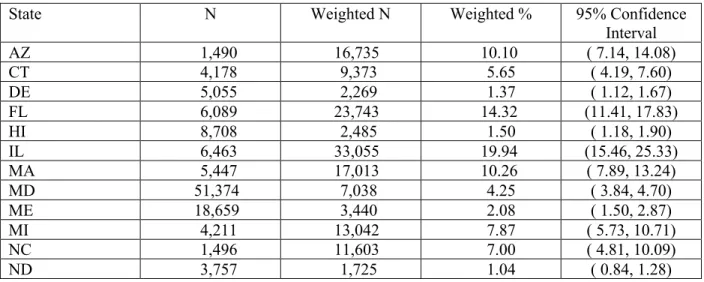
When examining the 17 states that contributed data to the analytic dataset as shown in Table 3, the weighted data show the largest percentage of respondents from Illinois (19.94%) and Florida
(14.32%) and the smallest from Vermont (1.00%), North Dakota and New Hampshire (1.04% each). The remainder of the states vary in the number of respondents they contribute, from 1.37% (Delaware) to 10.26% (Massachusetts).
Table 3: Sample Distribution by State
State N Weighted N Weighted % 95% Confidence
Interval AZ 1,490 16,735 10.10 ( 7.14, 14.08) CT 4,178 9,373 5.65 ( 4.19, 7.60) DE 5,055 2,269 1.37 ( 1.12, 1.67) FL 6,089 23,743 14.32 (11.41, 17.83) HI 8,708 2,485 1.50 ( 1.18, 1.90) IL 6,463 33,055 19.94 (15.46, 25.33) MA 5,447 17,013 10.26 ( 7.89, 13.24) MD 51,374 7,038 4.25 ( 3.84, 4.70) ME 18,659 3,440 2.08 ( 1.50, 2.87) MI 4,211 13,042 7.87 ( 5.73, 10.71) NC 1,496 11,603 7.00 ( 4.81, 10.09) ND 3,757 1,725 1.04 ( 0.84, 1.28)
NH 1,616 1,730 1.04 ( 0.84, 1.29) NM 5,280 2,792 1.68 ( 1.10, 2.56) RI 6,303 2,531 1.53 ( 0.99, 2.35) VT 30,306 1,653 1.00 ( 0.33, 3.01) WI 5,329 15,534 9.37 ( 7.21, 12.10) Total 165,761 165,761 100.00 ---
The 2011-2013 YRBSS weighted sample is 49.16% female. Of the girls in the sample, 9.59% are lesbian, gay or bisexual (sexual minority) and the remainder (90.41%) are heterosexual. Of the boys in the sample, 4.38% are gay or bisexual and 95.62% are heterosexual. As Table 4 illustrates, the range of age categories was from 14 years or younger to 18 years or older, with the majority of the sample
concentrated in the 15-17 range (as would be expected for a sample of high school students).
Among boys, sexual minorities were statistically significantly more likely to be 18 years old or older (27.70% vs. 15.33%, p<.001) compared to heterosexual boys. The largest racial/ethnic group among both sexual minorities and heterosexual boys and girls was white; however, the racial and ethnic
composition varied across gender and sexual orientation. Among both girls and boys, sexual minorities were underrepresented among white respondents when compared to heterosexuals, 49.36% vs 60.67% among girls and 48.10 % vs 59.12% for boys (p-value for both<.001). In contrast, sexual minorities were over-represented among Hispanic respondents (21.96 vs 17.46 girls, p<.001 and 24.99 vs 18.58, p<.01 for boys) and among multiracial respondents (4.96 vs. 2.80 p<.05 for girls, 3.65 vs. 2.76p<.001 for boys) when compared to their heterosexual counterparts.
Table 4: Age and Race among Girls and Boys by Sexual Orientation Demographics SMY Girls
Weighted Percent Heterosexual Girls Weighted Percent SMY Boys Weighted Percent Heterosexual Boys Weighted Percent Age 14 years or younger 10.92 11.83 8.69 10.05 15 years old 24.79 25.07 21.40 25.06 16 years old 27.20 25.22 23.68 25.59 17 years old 23.23 24.63 24.53 23.97
Demographics SMY Girls Weighted Percent Heterosexual Girls Weighted Percent SMY Boys Weighted Percent Heterosexual Boys Weighted Percent 18 years old or older 13.85 13.26 21.70 15.33 Race/Ethnicity American Indian/Alaska Native 1.13 0.92 3.56 1.23
Asian and Pacific Islander 2.54 3.95 4.31 3.93 Black or African American 20.05 14.20 15.39 14.37 White 49.36 60.67 48.10 59.12 Hispanic/Latinx (inc. multi) 21.96 17.46 24.99 18.58 Multiracial, non Hisp/Lat 4.96 2.80 3.65 2.76
This section describes the distribution of independent variables, including the structural stigma (SMSS) indicators (Table 5), tobacco policy indicators (Table 6), alcohol policy indicators (Table 7) and percent living in states with no legal status for marijuana (Table 8). The tables present the number (or percent) of young people in the dataset who live in states with the regulation presented (not the number of states with this regulation).
As shown in Table 5, indicators of sexual minority structural stigma varied in prevalence in this dataset, with the most common type of protection being hate crimes legislation (82.41%) and the least common being public accommodation protection (16.02%). On a scale ranging from 1 to 12, with 1 being the least restrictive (or most friendly) to sexual minorities and 12 being the most restrictive (or unfriendly) to sexual minorities, the weighted scale mean for the population was 5.25.
Table 5: Sexual Minority Structural Stigma (SMSS) Indicators
N Weighted N Weighted % Weighted 95% Confidence Interval SMSS Indicator Same-Sex Relationship Recognition Ban 100,030 61,129 36.88 (32.56, 41.42) No Recognition, No Ban 17,721 41,808 25.22 (21.53, 29.31) Same-Sex Relationship Recognition 48,010 62,824 37.9 (33.08, 42.97) School Non-Discrimination 135,744 92,383 55.73 (50.93, 60.43) School Anti-Bullying 133,527 90,182 54.4 (49.59, 59.14) Joint Adoption 60,206 33,209 20.03 (16.91, 23.57) Hate Crimes Legislation 151,017 136,599 82.41 (78.65, 85.62) Employment Protection 144,934 107,725 64.99 (60.25, 69.44) Public Accommodation Protection 39,813 26,559 16.02 (13.18, 19.34) Housing Discrimination Protection 111,805 86,151 51.97 (47.19, 56.72) Density of Same-sex Couples 0.29-0.66 3,757 1,725 1.04 ( 0.84, 1.28) 0.67-0.95 70,489 82,002 49.47 (44.64, 54.31) 0.96-1.75 91,515 82,034 49.49 (44.68, 54.31) SMSS Scale Mean 5.25 ( 4.99, 5.51)
As Table 6 illustrates, among tobacco regulations specific to underage smokers, the highest weighted prevalence among the sample was buying tobacco while underage (85.49 %). The most common public restrictions applying to both adults and youth were bans on smoking in government workplaces and in restaurants (both 93.30%). Business restrictions were overall somewhat less common, with about two-thirds (64.68%) of the weighted sample living in states that require signs about the ban on underage tobacco sales. The population weighted mean of the business restrictions scale, which ranged