Appeon Performance Tuning Guide
Appeon® for PowerBuilder® 2015
LAST REVISED: February 06, 2015
Copyright © 2000-2015 by Appeon Corporation. All rights reserved.
This publication pertains to Appeon software and to any subsequent release until otherwise indicated in new editions or technical notes. Information in this document is subject to change without notice. The software described herein is furnished under a license agreement, and it may be used or copied only in accordance with the terms of that agreement.
No part of this publication may be reproduced, transmitted, or translated in any form or by any means, electronic, mechanical, manual, optical, or otherwise, without the prior written permission of Appeon Corporation.
Appeon, the Appeon logo, Appeon Developer, Appeon Enterprise Manager, AEM, Appeon Server and Appeon Server Web Component are registered trademarks of Appeon Corporation.
Sybase, Adaptive Server Anywhere (Sybase SQL Anywhere), Adaptive Server Enterprise, iAnywhere, PowerBuilder, Sybase Central, and Sybase jConnect for JDBC are trademarks or registered trademarks of Sybase, Inc.
Java and JDBC are trademarks or registered trademarks of Sun Microsystems, Inc. All other company and product names used herein may be trademarks or registered trademarks of their respective companies.
Use, duplication, or disclosure by the government is subject to the restrictions set forth in subparagraph (c)(1)(ii) of DFARS 52.227-7013 for the DOD and as set forth in FAR 52.227-19(a)-(d) for civilian agencies.
Appeon Corporation, 1/F, Shell Industrial Building, 12 Lee Chung Street, Chai Wan District, Hong Kong.
Contents
1 About This Book ... 1
1.1 Audience ... 1
1.2 How to use this book ... 1
1.3 Related documents ... 1
1.4 If you need help ... 3
2 Appeon Performance ... 4
2.1 Impacts to Appeon performance ... 6
2.1.1 Impact of the Internet and slow networks ... 6
2.1.2 Impact of #heavy# client-side logic ... 7
2.1.3 Impact of large data transmission ... 8
2.2 Expected performance level ... 9
2.3 Automatic performance boosting ... 9
3 Performance-Related Settings ... 11
3.1 Overview ... 11
3.2 Appeon Developer performance settings ... 11
3.3 Appeon Enterprise Manager performance settings ... 12
3.3.1 Timeout settings ... 12
3.3.2 DataWindow data caching ... 13
3.3.3 Multi-thread download settings ... 13
3.3.4 Custom Libraries download settings ... 13
3.3.5 Log file settings ... 14
3.4 Internet Explorer performance settings ... 14
3.5 Web and application server performance settings ... 14
3.5.1 SAP Sybase EAServer ... 14
3.5.1.1 JVM startup option ... 14
3.5.1.2 Configuring data sources ... 14
3.5.1.3 HTTP properties ... 15
3.5.2 Microsoft IIS server ... 15
3.5.2.1 Recommendations for avoiding common errors on IIS ... 15
3.5.2.2 Advanced thread settings ... 16
3.6 Database performance settings ... 19
3.6.1 Recommended database driver ... 19
3.6.2 Recommended database setting ... 19
4 Identifying Performance Bottlenecks ... 21
4.1 Overview ... 21
4.2 Appeon Performance Analyzer ... 21
4.2.1 Getting Started ... 21
4.2.1.1 Enabling Appeon Performance Analyzer ... 21
4.2.1.2 Starting Appeon Performance Analyzer ... 22
4.2.1.3 Getting to know Appeon Performance Analyzer ... 24
4.2.1.4 Removing Appeon Performance Analyzer ... 25
4.2.2 Working with Appeon Performance Analyzer ... 26
4.2.2.1 System Configuration ... 26
4.2.2.2 Calls Analysis ... 28
4.2.2.3 Download Analysis ... 32
4.3 Analyzing log files ... 50
4.3.1 Analyzing Windows application log files ... 50
4.3.2 Analyzing Appeon Server log files ... 51
4.3.3 Analyzing active transaction log ... 52
4.4 Identifying Performance Bottlenecks of Web Server and Application Server ... 53
4.5 Identifying Performance Bottlenecks of DB Server ... 53
4.5.1 Deadlock analysis ... 53
4.6 Identifying Performance Bottlenecks of PB application ... 53
4.6.1 Analyzing performance bottlenecks of PB application ... 53
5 Tuning: DB Server ... 55
5.1 Database ... 55
6 Tuning: Excessive Server Calls ... 56
6.1 Overview ... 56
6.2 Technique #1: partitioning transactions via stored procedures ... 56
6.3 Technique #2: partitioning non-visual logic via NVOs ... 58
6.4 Technique #3: eliminating recursive Embedded SQL ... 60
6.5 Technique #4: grouping multiple server calls with Appeon Labels ... 61
7 Tuning: Heavy Client ... 67
7.1 Overview ... 67
7.2 Technique #1: thin-out #heavy# Windows ... 67
7.3 Technique #2: thin-out #heavy# UI logic ... 67
7.3.1 Manipulating the UI in loops ... 67
7.3.2 Triggering events repeatedly ... 68
7.3.3 Performing single repetitive tasks ... 68
7.3.4 Initializing #heavy# tabs ... 69
7.3.5 Using ShareData or RowsCopy/RowsMove for data synchronization ... 69
7.3.6 Using computed fields ... 69
7.3.7 Using DataWindow expressions ... 69
7.3.8 Using complex filters ... 70
7.3.9 Using RowsFocusChanging/RowsFocusChanged events ... 70
7.4 Technique #3: offload #heavy# non-visual logic ... 70
8 Tuning: Large Data Transmissions ... 71
8.1 Overview ... 71
8.2 Technique #1: retrieving data incrementally ... 71
8.2.1 For Oracle database server ... 71
8.2.2 For all other database servers ... 72
8.3 Technique #2: minimizing excessive number of columns ... 72
9 Conclusion ... 73
About This Book Appeon® for PowerBuilder® 2015
1 About This Book
1.1 Audience
This book is intended to help PowerBuilder developers plan what steps they will take, and how much time they will invest in improving the performance of a PowerBuilder application deployed to the Web/Mobile with Appeon for PowerBuiler. It is also intended to guide PowerBuilder architects and developers on how to build new PowerBuilder applications that perform well when deployed to the Web, a WAN or the Mobile.
1.2 How to use this book
There are eight chapters in this book. Chapter 1: About This BookA general description of this book. Chapter 2: Appeon Performance
Describes current runtime performance levels of Appeon for PowerBuilder and primary reasons for performance issues (if any).
Chapter 3: Identifying Performance Bottlenecks
Describes approach for identifying areas in the Web application that may suffer from runtime performance issues. Also, describes the Appeon Developer performance reporting tool - the Appeon Performance Analyzer tool.
Chapter 4: Performance-Related Settings
Documents key Appeon, Web browser, application server, and database settings that should be configured from default values to ensure optimal performance of your Web/Mobile system.
Chapter 5: Tuning: Excessive Server Calls
Introduces the performance tuning concept "Excessive Server Calls" with several techniques to optimize your PowerBuilder code to achieve good performance.
Chapter 6: Tuning: Heavy Client
Introduces the performance tuning concept "Heavy Client" with several techniques to optimize your PowerBuilder code to achieve good performance.
Chapter 7: Tuning: Large Data Transmissions
Introduces the performance tuning concept "Large Data Transmissions" with several techniques to optimize your PowerBuilder code to achieve good performance. Chapter 8: Conclusion
Final thoughts and recommendations on performance tuning of your PowerBuilder applications for the Web/Mobile.
1.3 Related documents
Appeon provides the following user documents to assist you in understanding Appeon for PowerBuilder and its capabilities:
• Introduction to Appeon:
Gives general introduction to Appeon for PowerBuilder and its editions. • Getting Started (for Appeon Mobile):
Guides you though installing PowerBuilder and Appeon for PowerBuilder, and developing and deploying a mobile application.
• New Features Guide:
Introduces new features and changes in Appeon for PowerBuilder. • Appeon Mobile Tutorials:
Gives instructions on deploying, running, and debugging the mobile application, distributing native mobile apps, and configuring the Appeon Server cluster. • Appeon Mobile (Offline) Tutorials:
Gives instructions on setting up the Appeon Mobile (Offline) environment, and configuring, deploying, running, updating, and debugging the offline application. • Appeon Installation Guide:
Provides instructions on how to install Appeon for PowerBuilder successfully. • Installation Guide on Cloud Platform:
Provides instructions on how to install Appeon for PowerBuilder on the cloud-based platform such as Windows Azure and AWS EC2 and S3.
• Mobile UI Design & Development Guide:
Introduces general guidelines on designing and developing the mobile app and UI. • Migration Guidelines for Appeon Web:
A process-oriented guide that illustrates the complete diagram of the Appeon Web migration procedure and various topics related to steps in the procedure, and includes a tutorial that walks you through the entire process of deploying a small PowerBuilder application to the Web.
• Supported PB Features:
Provides a detailed list of supported PowerBuilder features which can be converted to the Web/Mobile with Appeon as well as which features are unsupported.
• Appeon Developer User Guide:
Provides instructions on how to use the Appeon Developer toolbar in Appeon for PowerBuilder.
• Workarounds & API Guide:
Provides resolutions for unsupported features and various APIs to facilitate you to implement the features (including Web and mobile) that are not easy or impossible to implement in the PowerBuilder IDE.
About This Book Appeon® for PowerBuilder® 2015
• Appeon Workspace User Guide:
Gives a general introduction on Appeon Workspace and provides detailed instructions on how to use it.
• Appeon Server Configuration Guide:
Provides instructions on how to configure Appeon Server Monitor, establish connections between Appeon Servers and database servers, and configure AEM for maintaining Appeon Server and the deployed applications.
• Web Server Configuration Guide:
Describes configuration instructions for different types of Web servers to work with the Appeon Server.
• Troubleshooting Guide:
Provides information on troubleshooting issues; covering topics, such as product installation, application deployment, AEM, and Appeon application runtime issues.
• Appeon Performance Tuning Guide:
Provides instructions on how to modify a PowerBuilder application to achieve better performance from its corresponding Web/mobile application.
• Testing Appeon Web Applications with QTP:
Provides instructions on how to test Appeon Web applications with QTP.
1.4 If you need help
If you have any questions about this product or need assistance during the installation process, access the Technical Support Web site at http://www.appeon.com/support.
2 Appeon Performance
Before we officially introduce the methods to analyze and optimize the performance, we spare a few minutes to look at the possible impacts that cause performance problems to Appeon-converted applications. This helps to learn optimization solutions better, or even helps to work out individual optimization solutions for each application.
Traditional PowerBuilder application architecture
The traditional PowerBuilder application is based on the client/server architecture, in which applications run on the client side and interact with the database with native drivers. The connection between the client and the database (marked as "A" in the following figure) is usually the local area network or high-speed enterprise network, therefore the connection can hardly impact the performance. In this architecture, the main performance impacts are the application and the database.
Figure 2.1: Traditional PB application architecture
Thus, the performance of C/S PB applications = PB client performance + A + database processing performance.
Since the connection impact can be negligible, the performance of C/S PB applications = PB client performance + database processing performance.
Appeon (Web/Mobile) application architecture
Compared with the traditional C/S architecture, the Appeon application architecture has a server (that holds the core business logic and the data service) between the client and the database. The client does not directly interact with the database anymore, but sends all the requests and data to the server, and interacts with the database through the server.
Figure 2.2: Appeon application architecture
In the architecture, the Appeon application performance = Web/Mobile client performance + A1 + server performance + A2 + database processing performance.
Appeon Performance Appeon® for PowerBuilder® 2015
A1 is the network connection between the client and the server, and is usually the wide area networks/internet. Therefore, this is a very large performance expense, especially when the client frequently interacts with the server.
A2 is the network connection between the server and the database, and is usually the local area networks or high-speed enterprise networks. The same as that in the C/S architecture, it can hardly impact the performance.
Therefore, the Appeon application performance = Web/Mobile client performance + A1 + server performance + database processing performance.
PowerBuilder application impacts vs. Appeon application impacts
According to the PowerBuilder application architecture and the Appeon Web/Mobile application architecture described above, we know that:
• PB application performance = PB client performance + database processing performance • Appeon application performance = Web/Mobile client performance + A1 + server
performance + database processing performance
Appeon applications are converted from PB applications and are consisted of two parts after migration: the Web/Mobile client and the server. Therefore, the Appeon application performance is dependant on the PB application performance.
Two hypotheses as follows:
1. The PB application does not have performance problems; but the converted Appeon application has.
In this case, the PB client and the database performance expense are negligible. Since the performance of Appeon Web/Mobile client and the server are dependent on the PB client performance, the performance problem may be caused by A1, the connection network. And the possible reasons are:
• The networks connection is slow or unstable;
• The data package is too large or the SQL syntaxes are not efficient that result in long communication time in a single communication;
• The same functionality frequently communicates with the server that results in repeated connection performance (A1) expense, etc.
In the case, developers should: 1) first consider to reduce the communication times between the client and the server so to reduce the connection performance expense; 2) secondly, consider to optimize the efficiency of each communication, for example, by retrieving only the necessary data and using the optimal relational calculus in the SQL syntaxes, etc.
Usually, if the PB application does not have performance problems, the Appeon application converted from it will not have problems either. But under certain circumstances, there still can be performance problems in the converted Appeon
application. This is because the PB application will finally run using the machine code or the quasi machine code, which is very efficient at code levels; but the converted Appeon
application executes the JavaScript, an interpreted code, and will interpret at runtime. Therefore, the efficiency is lower compared with the machine code, especially when there is
• Functionalities that use multiple character string manipulation; • Lots of loops;
• Frequently-distributing memories or large memories, for example, large objects, lots of tabpages in the tab control, etc.
2. Both the PB application and the converted Appeon application have performance problems:
If the PB application has performance problems, the converted Appeon applications will definitely have performance problems as well.
In this case, developers should:
1) first consider to optimize the performance of the PB application and the database by using all kinds of available system tools. For example, developers can use the transaction track analyser provided by the database provider to analyze and optimize the database performance. Usually, popular database providers provide performance analysis and optimization tools with their databases, developers can use these provided tools to optimize the databases.
2) secondly, after you make sure that the PB application does not have performance problems, use the hypothesis 1 to analyze and the converted Appeon application. In details, the impacts to the converted Appeon application are as follows:
• Impact of the Internet and slow networks; • Impact of "heavy" client-side logic;
• Impact of large data transmission.
Refer to the Impacts to Appeon performance for more information.
2.1 Impacts to Appeon performance
2.1.1 Impact of the Internet and slow networks
Although Appeon pushes the envelope to deliver unparalleled performance from standard Web technologies (e.g. XML, JavaScript, HTML, Java or C#), which are typically
significantly slower than PowerBuilder, slow and latent network connections rob performance from even the best applications!
Network chatter and network-intensive code really highlight the weakness of a poor network connection. Any code that results in a HTTP request (i.e. server call) when executed multiple times sequentially has potential to create network chatter. There are mainly two categories of code that result in server calls - data access related and remote method invocations. Here are several common examples so you can familiarize yourself:
Appeon Performance Appeon® for PowerBuilder® 2015
• Embedded SQL (Select, Insert, Delete, Update, Cursor) including Dynamic SQL; • Invoking stored procedures or database functions;
• DataWindow/DataStore Functions (Retrieve, Update, ReselectRow, GetFullState, SetFullState, GetChanges, SetChanges);
• DataWindow/DataStore Events (SQLPreview);
• Invoking a method of a server-side object, such as a PowerBuilder NVO, Java EJB, or .NET Component; or
• Invoking a Web Service.
Each of the above statements will generate one call to the server utilizing HTTP, with exception of SQLPreview event that will generate one call for each line of code handled by the event. If any of the above statements are contained in a loop or recursive function, well depending on the number of loops, even though its just one statement it would be executed multiple times generating multiple server calls. Needless to say, loops and recursive functions are some of the most dangerous from a performance perspective.
The reason it is important to minimize server calls is because it can take 100 or even 1,000 times longer to transmit one packet of data over the Internet compared to a LAN. Imagine an event handler is triggered, for example handling an "onClick" event, whose execution will result in 80 synchronous server calls over a LAN with latency of 2 milliseconds (ms). In such scenario the slow-down attributed to network latency would be 0.16 seconds (80 x 2 ms). Now imagine this same event handler running over a WAN with latency of 300 ms. The slow-down attributed to the network latency would be a whopping 24 seconds (80 x 300 ms)! And depending on the amount of data transmitted there could be additional slow-down due the bandwidth bottlenecks.
It is imperative for the developer to be conscious that PowerBuilder applications deployed to the Web may not be running in a LAN environment, and as such there will be some degree of performance degradation. How much depends on how the code is written, but in most cases the performance degradation still falls within acceptable limits without much performance optimization.
Should you find that certain operations in your application are unacceptably slow, the good news is there are numerous things that you can do as PowerBuilder developers to ensure your PowerBuilder applications perform well in a WAN environment (e.g. Internet) or on slower networks. At a high-level, your code needs to be written such that the server calls and other performance intensive code is minimized or relocated to the middle-tier or back-end. This will be covered in more detail in the following chapters. Some changes are actually quite simple while others may require increased effort. Nonetheless, in all cases optimizing the performance of your applications in PowerBuilder is just a fraction of the effort to work with typical low-productivity Web tools such as VisualStudio.NET and Eclipse.
2.1.2 Impact of #heavy# client-side logic
Most PowerBuilder applications are developed utilizing a 2-tier architecture. In other words, all the PowerScript and embedded SQLs are coded in the Visual objects, for example
non-visual logic in PowerBuilder NVOs (Non-Visual Objects). The reality is even if your application utilizes NVOs, chances are it is not a pure 3-tier application if PowerBuilder NVOs are not exclusively utilized to encapsulate all non-visual logic. But don't rush to partition your application just yet!
Most applications developed as a 2-tier architecture perform great in Appeon. In fact, there are many situations that a 2-tier application when deployed by Appeon will actually perform faster than a 3-tier application. The reason is if a PowerBuilder NVO is deployed to the middle-tier or application server, time must be spent to call the server and get the results back to the client. Of course, your non-visual logic running on an application server will run faster than at the Web browser. The key question is how much performance do you gain by running a particular block of code on the application server vs. how much performance do you lose due to the server calls.
As a rule of thumb, it is recommended to partition your non-visual logic to the middle-tier only when the particular block of code runs unacceptably slow at the Web browser. In such cases, it is likely that the application performance will benefit, and as such, it is worthwhile to invest the time to partition such logic. However, if the non-visual logic is only slightly sluggish, it may be possible to optimize the code without having to partition it to the application server.
2.1.3 Impact of large data transmission
When you first open a Window there are two types of files downloaded. The first type is the HTML and JavaScript files ("Web files") that contain the UI and UI logic of the application Window. The second type is data files that contain the result set, for example for a DataWindow retrieve. The time to download these files is affected by two factors: 1) the network connection and 2) the size of the files to be downloaded.
The Web files do not impact performance because of their small size and the enhanced ability of the browser to "cache" them. The Web files for a given PowerBuilder Window are typically between 25-75 KB. Because these Web files are static in nature, once a given application Window has been opened, the Web files will be cached on the Client computer. As such, once these Web files are cached, their impact on performance is essentially non-existent.
Under most circumstances, these Web files are not re-downloaded when the Window is reopened. The only exceptions are if 1) the temporary Internet files folder has been emptied or 2) the application has been updated and redeployed to the server. If the latter has happened, Web files for only those Windows that have been modified will be automatically downloaded from the Web server.
Only the data files containing the result sets may or may not be cached (depending on whether you have enabled DataWindow caching). A result set of 50 records would typically result in a 12 KB data file. Every 5 records would typically add another 1.2 KB to the data file size. So, for example, a 500-record result set would typically correspond to a 120 KB data file. If DataWindow caching is not enabled, the data files corresponding with such DataWindows will be downloaded from the server each time a DataWindow retrieve is invoked.
The good news is that Appeon has built-in 10X data compression for DataWindow result set to essentially eliminate the time spent downloading these data files. The same 500-record
Appeon Performance Appeon® for PowerBuilder® 2015
result set that would normally correspond to a 120 KB data file would only result in the download of a 12 KB data file from the server. This compression feature makes even the largest of result sets quick to transfer.
In conclusion, due to Web file caching feature of the Web browser, Appeon's built-in
DataWindow caching technology and 10X data compression technology, generally speaking neither the Web files nor data files should have any noticeable impact on the performance of your Web application.
2.2 Expected performance level
When comparing a PowerBuilder application to the performance of a Web application deployed by Appeon to a LAN environment, generally speaking the performance of the two will be quite similar. In some cases (for certain operations) Appeon may actually be even faster than PowerBuilder.
The reason is that Appeon has been tuned for nearly a decade to offer the best performance possible for real-life PowerBuilder applications:
• Large PowerBuilder applications up to 600MB (of PBLs) including several thousand DataWindows and thousands of Windows.
• Complex screens containing as much as 80 DataWindows in a single Window • Complex tabs (including nested tabs and dynamically created tabs)
• Dynamically created objects (DataWindows, UserObjects, etc.) • PFC and other high-overhead frameworks similar to PFC.
2.3 Automatic performance boosting
Appeon has a number of features built into its infrastructure/framework to instantly or automatically boost the performance of PowerBuilder applications when deployed to the Web. Many of these features are always on and transparently working in the background to boost performance. Other features are user-selectable and must be configured. The following table is a list of these features and the configuration of these features is covered in Chapter 3,
Performance-Related Settings.
Table 2.1: Appeon Performance Boosting Features
Performance Feature
Description Location
Just-in-Time Downloading
As the application is run and various windows are opened, only the Web files required for that particular window are downloaded at that point in time. Once the Web files are downloaded, they are cached in the Internet Explorer temporary files folder and are not downloaded again.
Appeon Infrastructure
10X Web File Compression
All JavaScript files are compressed by as much as 10X, then the compressed version of the file is downloaded over HTTP to the Web browser.
Appeon Developer
Performance Feature
Description Location
10X Data File Compression
For each DataWindow or DataStore retrieval, the result set is first retrieved by the application server, automatically compressed by 10 times in most cases, and then downloaded over HTTP to the Web browser. Utilizing AJAX technology, only the DataWindow or DataStore is refreshed and the rest of the screen remains intact.
Appeon Infrastructure
DataWindow Data Caching
For each DataWindow or DataStore, the developer has the option of enabling caching of the result set. Appeon enables caching at the application server, Web server, and Web browser so every tier of the Web architecture is benefiting from the best performance and scalability possible.
Appeon Enterprise Manager
Merge files Merges multiple JavaScript files into a single file to reduce the number of HTTP requests and corresponding overhead.
Appeon Developer
Multi-thread Downloading
Downloads are multi-threaded to boost the application runtime performance. Appeon Enterprise Manager Custom Libraries Downloading
Any custom libraries can be automatically downloaded and installed with your Web application, or if the libraries are very large in size, you can disable this feature and distribute the libraries some other fashion.
Appeon Enterprise Manager Database Connection Pooling
By deploying to a true n-tier Web environment with Appeon, you can take advantage of Database Connection Pooling, a feature of most application servers. Connection Pooling does exactly that, it establishes a pool of connections to your database, which is shared among your clients. So rather than each client having its own dedicated connection to the database, a fewer number of connections can be rotated among all the users. For large deployments with thousands of clients this can boost database scalability noticeably.
Appeon Infrastructure
Performance-Related Settings Appeon® for PowerBuilder® 2015
3 Performance-Related Settings
3.1 Overview
Performance settings need to be configured in Appeon Developer, Appeon Enterprise Manager, Web browser and your application server to ensure good performance in a production environment. If you identify any performance bottlenecks, it is strongly
recommended that you first ensure all performance-related settings are correctly configured. Only if the performance issues still persist after the performance settings are configured correctly, then it is recommended to consider optimizing your PowerBuilder code.
3.2 Appeon Developer performance settings
The following table lists the Appeon performance settings that the developer can configure (in the application profile) of Appeon Developer to boost performance. To make a
performance setting effective for an application, enable the option in the application profile and then perform a "Full Deployment" of the application.
Table 3.1: Performance settings in Appeon Developer
Performance Feature
Description User-Selectable
10X Web File Compression
Compresses files when they are transferred over the network.
User must enable this feature for it to become effective. Merge files Merges the small files during the application
deployment. The small files will be downloaded to the client in one file package at one call, instead of being downloaded one by one at separate calls.
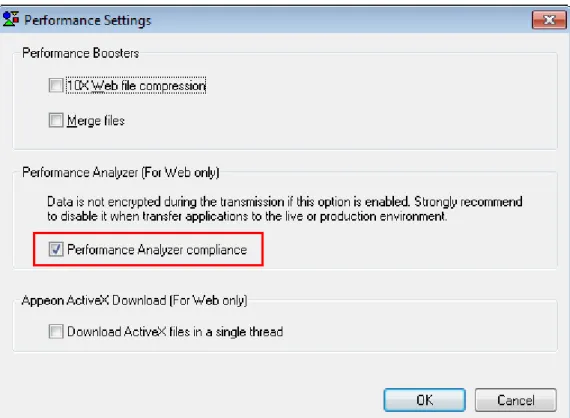
User must enable this feature for it to become effective. Performance
Analyzer compliance
Enables the application to be deployed in a method compliant with the Performance Analyzer tool. The application deployed with this option can run with the Performance Analyzer tool at runtime to diagnose the performance issues. For more about the Performance Analyzer tool, see Appeon Performance Analyzer.
Note: as the data is not encrypted during transmission at runtime, therefore, this option is recommended to use only at the test or development stage.
User must enable this feature for it to become effective.
Download ActiveX files in a single thread
Downloads the two ActiveX files in the same thread at runtime.
Using the same thread to download the two ActiveX files can speed up the download under particular network conditions.
User must enable this feature for it to become effective.
3.3 Appeon Enterprise Manager performance settings
3.3.1 Timeout settings
By setting proper values for Timeout Detection Interval and Timeout Settings in AEM, Appeon Server can release the timeout and invalid database connections in time, thus can avoid database deadlock or malfunctions, so that the concurrent processing ability and the running stability of Appeon Server for .NET can be greatly enhanced.
3.3.1.1 Session Timeout Detection Interval
The Session Timeout Detection Interval setting is to specify the interval (in seconds) to check whether sessions have timed out.
It is recommended that the value is smaller than the Session Timeout value. The default value is 30 seconds. The value recommended by the system is based on your Session Timeout values, if the Session Timeout values are different from applications, the system will multiply the smallest value with 0.15 to get the recommended value.
3.3.1.2 Transaction Timeout Detection Interval
The Transaction Timeout Detection Interval setting is to specify the interval (in seconds) to check whether transactions have timed out.
It is recommended that the value is smaller than the Transaction Timeout value. The default value is 30 seconds. The value recommended by the system is based on your Transaction Timeout values, if the Transaction Timeout values are different from applications, the system will multiply the smallest value with 0.15 to get the recommended value.
3.3.1.3 Session timeout
Session timeout ends the user session and rolls back all database updates since the last commit for a user session. The default value is 3600 seconds. Session Timeout should be larger than the Transaction Timeout setting. Generally speaking, Session Timeout should not be smaller than 3600 seconds.
3.3.1.4 Transaction timeout
Transaction timeout rolls back all database updates since the last commit in a transaction. The default value is 120 seconds. Transaction Timeout should be less than Session Timeout. If transaction timeout in the application database is set to 1800 seconds, then Transaction Timeout in AEM should be set to 1810 or larger.
If transaction timeout in the application database is not set, then Transaction Timeout in AEM should be set to a number greater than the maximum time needed to execute regular database operations for the Web application, suppose the most time-consuming table query operation takes 3600 seconds to complete, then Transaction Timeout should be set to 3610 or larger.
Performance-Related Settings Appeon® for PowerBuilder® 2015
3.3.1.5 Rollback Completion time
Specifies the maximum time (in seconds) to complete a rollback of a transaction. If the time to roll back transaction exceeds the specified value, the transaction rollback will be terminated. The default value is 3 seconds.
It is recommended that it is set to a number between 3 seconds and Transaction Timeout *0.1.
3.3.1.6 Maximum Rollback Retries
The maximum times to retry a rollback of a transaction. Appeon Server executes a rollback if a transaction times out. If the rollback fails, Appeon Server will keep retrying until this maximum value is reached. Setting this value to 0 will disable this feature. The default value is 3.
It is recommended that it is set to a number smaller than 10.
3.3.2 DataWindow data caching
Appeon Enterprise Manager (AEM) provides a DataWindow data cache mechanism for caching the frequently used DataWindow data. It is recommended that you enable the cache for the DataWindow objects whose data is relatively static. Any DataWindow objects whose data is fairly dynamic should remain unchecked, otherwise you will experience overhead from the caching mechanism without the true benefits of the caching.
NOTE: DataWindow Data Cache will not be effective until you fulfill all the configuration requirements that are detailed in Section 5.4.8.3, “DataWindow Data Cache” in Appeon
Server Configuration Guide for .NET or in Appeon Server Configuration Guide for J2EE.
Also, this feature is only supported on Windows servers.
3.3.3 Multi-thread download settings
Multi-thread downloads boost the application runtime performance. However, if there are many threads competing for the processing power of Web server, it may slow down the performance of Web server. Therefore, you should not specify an unnecessarily large number of threads in AEM. It may take some trial and error to fine-tune the performance.
3.3.4 Custom Libraries download settings
If your application utilizes a customer library (e.g. DLL, OCX, etc.), you can specify in AEM how the custom library should be downloaded to the client:
• In most situations you should set the install mode to "Install automatically without asking user" or "Confirm with user, then install automatically". With these options, the custom libraries will be automatically downloaded and seamlessly installed to the Web browser. • However, if the file size of the custom libraries is extremely large (e.g. tens of megabytes),
you should set the install mode to "Install manually (no automatic installation)".With this option, Appeon does not automatically download and install the custom libraries. As such, you must distribute the custom libraries to users and your users need to install it manually. For more details about the custom libraries download settings, refer to Section 5.4.4.3, “DLL/OCX Files” in Appeon Server Configuration Guide for .NET or in Appeon Server Configuration Guide for J2EE.
3.3.5 Log file settings
Once your application is fully tested and ready to move to a production environment, it is recommended to disable the AEM log functionality. Writing log files incurs disk activity, which can impact performance. Generally, the impact is small but nonetheless it will not hurt to disable this.
3.4 Internet Explorer performance settings
For optimal performance, it is recommended that the Web file caching functionality of
Internet Explorer be fully utilized. This will significantly reduce the time required to load and start an application following the initial load. The configuration outlined below will ensure that you realize the best performance while safeguarding your application from becoming "stale".
Step 1: Open Internet Explorer and select Tools > Internet Options. Verify that the Empty
Temporary Internet Files folder when browser is closed option is not checked under the Security section of the Advanced tab of Internet Options.
Step 2: Click the Settings button under the General tab to configure the Temporary Internet Files settings.
Step 3: Select the Automatically radio button and verify that the Amount of disk space to use scroll box is set to a reasonable number, such as 200 MB or more.
Now the browser is set to automatically check for newer versions of the Web application.
3.5 Web and application server performance settings
3.5.1 SAP Sybase EAServer
The core processing of your Web application happens on the application server. As such, the better EAServer performs the better your Web application will perform. This section highlights several key performance settings you should definitely consider. You may refer to the EAServer Performance and Tuning Guide for details on how to extensively tune EAServer.
3.5.1.1 JVM startup option
When starting EAServer, the -jvmtype switch specifies whether the client, server, or classic Java VM be used. It is recommended that you set the switch to the J2EE server VM.
3.5.1.2 Configuring data sources
3.5.1.2.1 JDBC driver used by EAServer data source
You should avoid using any JDBC-ODBC driver. Instead, use the Native-protocol/all-Java driver. The only exception is SAP Sybase SQL Anywhere, which provides the
iAnywhere JDBC driver that actually performs remarkably well. For detailed information on configuring JDBC drivers refer to Section 4.2.4, “JDBC driver preparation” in Appeon Server
Performance-Related Settings Appeon® for PowerBuilder® 2015
3.5.1.2.2 Configuring the cache size
By default, EAServer is configured to establish 10 database connections. For applications with many several hundred or several thousands of users, this number is often too small. If not increased, it will hurt the performance of your application since your users will be waiting in a queue for an available database connection. On the other hand, if your Web deployment is few hundred users or less, you should not specify an unnecessarily large number as it will consume more server resources and possibly negatively affect performance.
The maximum pool size property, "com.sybase.jaguar.conncache.poolsize.max", defines the maximum number of connections to be held in the connection pool. The size property is generally set to 10%-20% of the maximum number of concurrent users. However, it is possible to use the FORCE option when connecting to obtain additional connections outside of the pool if none are available. Refer to the EAServer Performance and Tuning Guide for details on tuning the cache size.
3.5.1.3 HTTP properties
You should configure the EAServer http.maxthreads and server.maxconnections properties such that it can handle the expected concurrent user load for the Web Server. If these
properties are improperly configured, it may result in poor performance and possibly result in failed HTTP requests. The httpstat.dat file keeps track of cumulative hits on http objects. Set the http.maxthreads property to the estimated average number of concurrent HTTP requests (including Servlets and any other server pages). For example, if it is expected that there will be 100 concurrent requests, set the http.maxthreads slightly higher (for example, 120). This will give you a margin of safety. Similarly, set the server.maxconnections to accommodate the average number of concurrent IIOP requests that are expected.
Another property you should pay attention to is server.maxthreads. Set this property to equal the combined value of http.maxthreads and server.maxconnections, and add 50 as a margin of safety (http.maxthreads + server.maxthreads + 50). However, if you are using an older version of PowerBuilder components with a bind thread set, you should increase this number as outlined in the EAServer Performance Tuning Techniques document.
Since each application and environment is unique, these are starting points that need to be monitored and adjusted for optimal results. Load and stress testing your application will help you to identify any issues prior to moving your Web application to a production environment.
3.5.2 Microsoft IIS server
Tune the IIS server will help you to avoid some common errors and gain a better performance of Web applications. This section highlights the key performance settings of IIS. You can refer to the IIS Operation Guide for details on how to extensively tune IIS server.
3.5.2.1 Recommendations for avoiding common errors on IIS
IIS should be tuned to avoid the contention, poor performance, and deadlocks for the Web applications. Following are some samples of commons error that you may find in Application log, System log or even log in the Web browser.
• Event Type: Error Event Source: ASP.NET
Event ID: 1003
Description: aspnet_wp.exe (PID: <xxx>) was recycled because it was suspected to be in a deadlocked state. It did not send any responses for pending requests in the last 180 seconds.
• Event Type: Warning Event Source: W3SVC-WP Event ID: 2262
Description: ISAPI 'C:\Windows\Microsoft.net\Framework\v.2.0.50727\aspnet_isapi.dll' reported itself as unhealthy for the following reason: 'Deadlock detected'.
• Event Type: Warning Event Source: W3SVC Event ID: 1013
Description: A process serving application pool 'DefaultAppPool' exceeded time limits during shut down. The process id was '<xxxx>'.
• You may receive the exception error message: "System.InvalidOperationException: There were not enough free threads in the ThreadPool object to complete the operation."
• In the browser, you may also receive the exception error message: "Request timed out".
To avoid such problems, you can configure ASP.NET according to the suggestions below so to best fit your situation and make the Web application perform better. Details on how to configure the ASP.NET can be found at Advanced thread settings.
1. Limit the number of .NET requests that can execute at the same time to approximately 12 per CPU.
2. Permit Web service callbacks to freely use threads in the ThreadPool.
3. Select an appropriate value for the maxconnections parameter. Base your selection on the number of IP addresses and AppDomains that are used.
3.5.2.2 Advanced thread settings
The following settings are the most-Appeon-related settings in ASP.NET.
When you call an Appeon web application from IIS, you may experience contention, poor performance, and deadlocks. Clients may report that requests stop responding (or "hang") or take a very long time to execute.
This problem might occur because ASP.NET limits the number of worker threads and completion port threads that a call can use to execute requests. If there are not sufficient threads available, the request is queued until sufficient threads are free to make the request. Therefore, .Net will not execute more than following number of requests at the same time: (maxWorkerThreads*number of CPUs)-minFreeThreads
Performance-Related Settings Appeon® for PowerBuilder® 2015
Note: The minFreeThreads parameter and the minLocalRequestFreeThreads parameter are not implicitly multiplied by the number of CPUs.
3.5.2.2.1 maxWorkerThreads and maxIoThreads
.NET uses the following two configuration settings to limit the maximum number of worker threads and completion threads that are used:
<processModel maxWorkerThreads="20" maxIoThreads="20" />
The maxWorkerThreads parameter and the maxIoThreads parameter are implicitly multiplied by the number of CPUs, the default value of these two parameters are both 20. If for some reason your application is slow, perhaps waiting for external resources, you could try to increase the number of threads to a value less than 100. For example, if you have two processors, the maximum number of worker threads is the following: 2*maxWorkerThreads
3.5.2.2.2 minWorkerThreads
The setting determines how many worker threads may be made available immediately to service a remote request. By default, the minWorkerThreads parameter is not present in either the Web.config file or the Machine.config file at C:\WINDOWS\Microsoft.NET\Framework \v2.0.50727\CONFIG. You need to manually add the following line to make the setting work.
<processModel minWorkerThreads="1" />
Threads that are controlled by this setting can be created at a much faster rate than worker threads that are created in other ways. The default value for the minWorkerThreads parameter is 1. The setting is recommended to set in the following way.
minWorkerThreads = maxWorkerThreads / 2
Note: This setting is implicitly multiplied by the number of CPUs.
3.5.2.2.3 minFreeThreads and minLocalRequestFreeThreads
The two settings determine how many worker threads and completion port threads must be available to start a remote request or a local request:
<httpRuntime minFreeThreads="8" minLocalRequestFreeThreads="8" />
The default value is 8. If there are not sufficient threads available, the request is queued until sufficient threads are free to make the request. Therefore, .NET will not execute more than the following number of requests at the same time:
(maxWorkerThreads*number of CPUs)-minFreeThreads
Note: The minFreeThreads parameter and the minLocalRequestFreeThreads parameter are not implicitly multiplied by the number of CPUs.
3.5.2.2.4 maxconnection
The maxconnection parameter determines how many connections can be made to a specific IP address. The parameter appears as follows:
<connectionManagement>
<add address="*" maxconnection="2" />
</connectionManagement>
The maxconnection parameter setting applies to the AppDomain level. By default, because this setting applies to the AppDomain level, you can create a maximum of two connections to a specific IP address from each AppDomain in your process.
3.5.2.2.5 execution Timeout
The setting limits the request execution time:
<httpRuntime executionTimeout="90" />
The default is 110 seconds.
Note: If you increase the value of the executionTimeout parameter, you may also have to modify the processModel responseDeadlockInterval parameter setting.
3.5.2.2.6 Recommended thread settings
For most applications, you can use and apply the recommended changes in the Machine.config file as below, which can be found at C:\WINDOWS\Microsoft.NET \Framework\v2.0.********\CONFIG:
1. Set the values of the maxWorkerThreads parameter and the maxIoThreads parameter to 100.
2. Set the value of the maxconnection parameter to 12*N (N is the number of CPUs that you have).
3. Set the values of the minFreeThreads parameter to 22*N and the minLocalRequestFreeThreads parameter to 19*N.
4. Set the value of minWorkerThreads to 50. Remember, minWorkerThreads is not in the configuration file by default. You must add it.
If you have hyperthreading enabled, you must use the number of logical CPUs instead of the number of physical CPUs.
Note: If you have a server with one processor, when you use this configuration, you can execute a maximum of 78 .NET requests at the same time because 100-22=78. Therefore, at least 22*N worker threads and 22*N completion port threads are available for other uses (such as for the Web service callbacks).
For example, if you have a server with four processors and hyperthreading enabled, then n=8 (=2*4). Based on these formulas, you would use the following values for the configuration settings that are mentioned in this section.
<system.web> ...
<processModel maxWorkerThreads="100" maxIoThreads="100" minWorkerThreads="50" /> <httpRuntime minFreeThreads="176" minLocalRequestFreeThreads="152" />
...
</system.web> ...
<system.net> ...
Performance-Related Settings Appeon® for PowerBuilder® 2015
<connectionManagement>
<add address="[ProvideIPHere]" maxconnection="96" /> </connectionManagement>
...
</system.net>
Also, if you use this configuration, 12 connections are available per CPU per IP address for each AppDomain, and you can execute a maximum of 624 .NET requests at the same time because 8* 100 - 176= 624.
3.6 Database performance settings
3.6.1 Recommended database driver
The following database drivers are recommended for Appeon for PowerBuilder .NET: Table 3.2: Recommended database drivers
Database Type Recommended Driver
Sybase ASA/SQL Anywhere Native Driver
ASE ODBC Driver
SQL Server Native Driver
Oracle Native Driver
Informix Native Driver
Teradata Native Driver
3.6.2 Recommended database setting
Setting appropriate values for the database parameters based on the actual needs can reduce the occurrence of database deadlock and block hence can improve the concurrency and stability of the Web application.
3.6.2.1 Command Timeout
Specify the timeout period for the commands. In the following table, it shows how to set Command Timeout to 120 seconds in different databases.
Table 3.3: Command timeout settings in different databases
Database Type Parameter Remark
Sybase ASA/SQL Anywhere
BLOCKING_TIMEOUT Execute the following command: SET OPTION
Public.BLOCKING_TIMEOUT = 120000
ASE lock wait period Execute the following command:
sp_configure "lock wait period", 120
SQL Server - Modify the Command Timeout
parameter in Edit Data Source page of AEM.
Database Type Parameter Remark
Command Timeout = 120
Oracle IDLE_TIME Execute the following command:
ALTER PROFILE default LIMIT IDLE_TIME 2;
Informix DEADLOCK_TIMEOUT Modify the DEADLOCK_TIMEOUT
parameter in ONCONFIG.std file. DEADLOCK_TIMEOUT = 120
Teradata - Modify the Command Timeout
parameter in Edit Data Source page of AEM.
Identifying Performance Bottlenecks Appeon® for PowerBuilder® 2015
4 Identifying Performance Bottlenecks
4.1 Overview
There are several methods to identify performance bottlenecks in your application. You can manually test your application or utilize Appeon's built-in performance reporting tool. Manually testing is the most time-consuming but also the most comprehensive and accurate. Nonetheless, the performance reporting tool, can help to identify most problematic Windows without a lot of work.
4.2 Appeon Performance Analyzer
Appeon Performance Analyzer is a tool in Appeon Server Web Component to help diagnose application performance by analyzing script calls, application RPC calls, application errors and application downloads, and thereby calculate the time used by function calls or object calls.
4.2.1 Getting Started
Before we start to work with Appeon Performance Analyzer, let's learn how to start it and what it looks like first.
• Enabling Appeon Performance Analyzer
• Starting Appeon Performance Analyzer
• Getting to Know Appeon Performance Analyzer
• Removing Appeon Performance Analyzer
4.2.1.1 Enabling Appeon Performance Analyzer
Appeon Performance Analyzer is turned on or off at application level. If you want to analyze an application by using Appeon Performance Analyzer, you need to deploy the application in a mode compliant with Performance Analyzer. To do this:
Step 1: Select the Performance Analyze compliance option in the Application Profile Configuration tool in Appeon Developer. It is not selected by default.
Step 2: Deploy the application using the Appeon Deployment Wizard in Appeon Developer. The application files are deployed and generated in a mode compliant with the Performance Analyzer tool.
Note: as the data is not encrypted during transmission at runtime, therefore, the Performance
Analyze compliance option is recommended to use only at the test or development stage.
When the application is ready to go live in a production environment, turn off this option and then re-deploy the application, to ensure data is encrypted during transmission.
Figure 4.1: Performance Analyze compliance option
4.2.1.2 Starting Appeon Performance Analyzer
Performance Analyzer is a Web tool that can only be launched side by side with the Web application you want to analyze.
Notes:
1. Appeon Performance Analyzer can only run on a 32-bit operating system.
2. Appeon Performance Analyzer can only run in Internet Explorer, and cannot run in the other Web browser such as FireFox, Chrome, Opera, etc.
3. For the first time to run it, users should log into Windows as an administrator and turn off UAC (if using Windows Vista, Windows 7 etc.). To turn off UAC, go to Windows
Control Panel > User Accounts, click Turn User Account Control on or off, then
uncheck the check box of Use User Account Control (UAC) to help protect your
computer.
You can start Appeon Performance Analyzer by the following steps:
Step 1: In Internet Explorer, run the Web application you want to analyze. The URL of the Web application should look like this: http://hostname:port/applicationname/x32_index.htm.
Note: Hostname indicates the IP address or machine name of the Web Server, and port
indicates the HTTP port number of the Web Server. Port is optional and specifies the port number that your Web Server accepts for HTTP connections. If it is not specified, the default port is 80. If several Web Servers are running on the same machine, make sure that the port specified is a port of the Appeon Web Server.
Step 2: When the application has started up, append "?performance=1" to the application URL in the IE address bar and press Enter to refresh the application.
Identifying Performance Bottlenecks Appeon® for PowerBuilder® 2015
So the complete URL should look like http://hostname:port/applicationname/x32_index.htm?
performance=1 or http://hostname:port/applicationname/x32_application.htm? performance=1.
If the Performance Analyzer is run for the first time, you will be prompted to install the Appeon Performance Analyzer add-on. Click Install.
Figure 4.2: Performance analyze installation prompt
Figure 4.3: Performance analyze installation prompt
Appeon Performance Analyzer will start up side by side with the Web application. The main window of Appeon Performance Analyzer looks like this.
Figure 4.4: Performance analyzer main window
Appeon Performance Analyzer will automatically open when the Web application runs by URL http://hostname:port/applicationname/x32_index.htm?performance=1, unless you deselect the Show window when started option in the Appeon Performance Analyzer
Configuration dialog (from menu System > Config). See System Configuration for details.
4.2.1.3 Getting to know Appeon Performance Analyzer
Appeon Performance Analyzer window includes three parts: 1 - The menu bar
The menu bar includes all the settings for Performance Analyzer. You can get detailed information from the sections below.
Identifying Performance Bottlenecks Appeon® for PowerBuilder® 2015
Figure 4.5: Menu bar
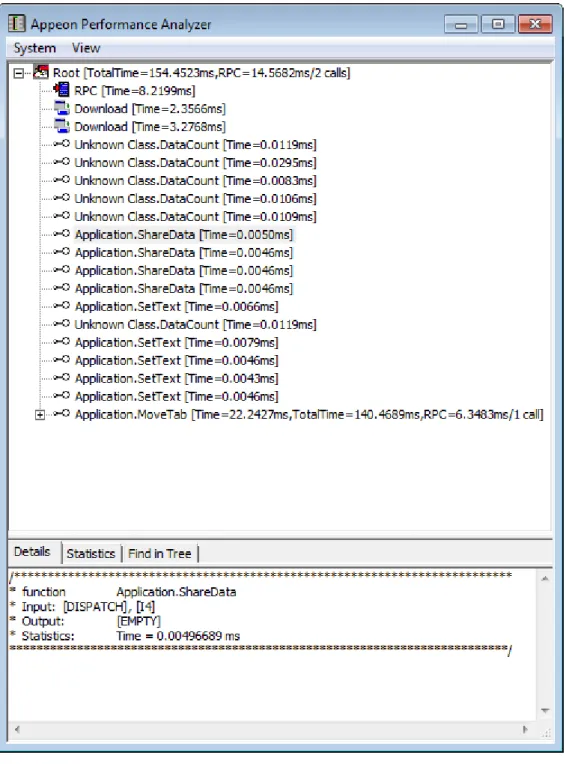
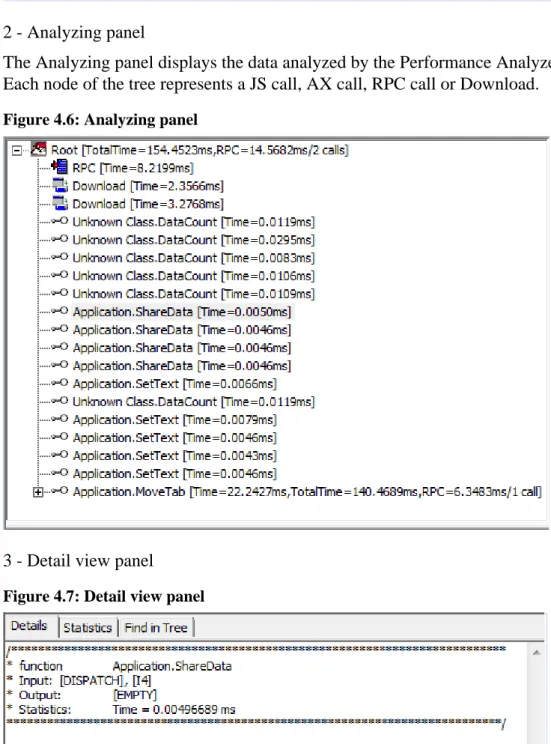
2 - Analyzing panel
The Analyzing panel displays the data analyzed by the Performance Analyzer in a treeview. Each node of the tree represents a JS call, AX call, RPC call or Download.
Figure 4.6: Analyzing panel
3 - Detail view panel
Figure 4.7: Detail view panel
The Detail view panel shows the detailed information of the selected tree node, and also shows the statistics and search results.
4.2.1.4 Removing Appeon Performance Analyzer
In order to remove Appeon Performance Analyzer completely, you can follow the steps below:
Step 1: Make sure that the user has administrator permission, and then turn off UAC and IE. Step 2: Open the command window and enter the following commands one by one:
regsvr32 -u "%systemroot%\downloaded program files\APBPanalysis.dll" del "%systemroot%\downloaded program files\APBPanalysis.dll"
del "%systemroot%\downloaded program files\APBPanalysis.inf" del "c:\performance\EonTracer.ini"
del "c:\performance\EonTracer.log" rd "c:\performance"
After all the commands above are run, the Appeon Performance Analyzer is removed completely.
4.2.2 Working with Appeon Performance Analyzer
This section will talk about the following topics:
• System Configuration • Calls Analysis • Download Analysis • View Detail • Additional functions 4.2.2.1 System Configuration
In order to make Appeon Performance Analyzer more convenient for future use, you can make some configurations in the System menu.
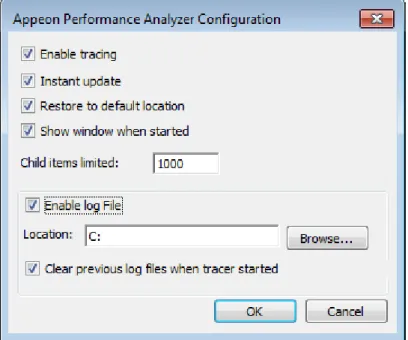
Click menu System | Config. The Appeon Performance Analyzer Configuration dialog opens:
Identifying Performance Bottlenecks Appeon® for PowerBuilder® 2015
Enable Tracing
This option controls if Appeon Performance Analyzer works or not. If you want to work with Appeon Performance Analyzer to analyze an application program, the option must be selected. By default it is selected.
Instant update
By selecting Instant update, the analysis data in the analyzing panel can be updated instantly when operation changes. When Instant update is not selected, Performance Analyzer will work faster; but users will need to manually click menu View | Update to see the latest data.
Restore to default location
By selecting this option, the main window of Appeon Performance Analyzer always opens at the default position. By unselecting this option, Appeon Performance Analyzer will
remember its last position on the screen when it exits, and will open at the last location on the screen when it starts next time. By default, this option is selected.
Show window when started
By selecting this option, Appeon Performance Analyzer will automatically start when the Web application runs. You can deselect this option to disable the automatic starting of Appeon Performance Analyzer, and manually start Appeon Performance Analyzer by pressing Ctrl + Shift + F12. By default it is selected.
Child items limited
This option controls the maximum number of child items displayed in the treeview.
Enable log file
If you want to save the analyzing log in the local machine, select Enable log file. And the log file will be created after the Web application is closed.
Figure 4.9: Enable log file option
As shown above, the default destination is in C:\ disk. You can specify a different location by clicking Browse to select an existing folder on your computer.
Clear previous log files when tracer started
This option becomes selectable when Enable log file is selected. If you want to clear the analyzing log files saved in the last starting of Appeon Performance Analyzer, select this option.
After you finish the configuration, click OK to close the dialog.
4.2.2.2 Calls Analysis
Appeon Performance Analyzer enables you to perform the following analysis easily:
• JavaScript Calls Analysis
• ActiveX Calls Analysis
• Remote Procedure Calls Analysis
No matter what operation you execute on the Web application, e.g. a click on a button to open a dialog in the Web application, a root item Root will show in the first line of the analyzing panel to show the total executing time consumed by the operation.
By expanding Root, you can view the time consumed by different callings.
By default, the JS Calls, Ax Calls, RPC, Download, Detail View buttons are selected, which means, information related with them will be automatically displayed in the analyzing panel and the detail view panel.
Identifying Performance Bottlenecks Appeon® for PowerBuilder® 2015
Figure 4.10: View menu
4.2.2.2.1 JavaScript Calls Analysis
By default, the View | View JS Calls menu item is selected, so the JavaScript calls are automatically listed in the analyzing panel. If you do not want to view the JavaScript calls in the analyzing panel, you can click View JS Calls menu item to deselect it. If you want to view the JavaScript calls only, you can click the other menu items in the View menu to deselect them, as shown in the figure below.
You can expand the sub-nodes in the JavaScript calls list to further find out the time consumed by each JavaScript function calls.
Figure 4.11: View JS Calls menu
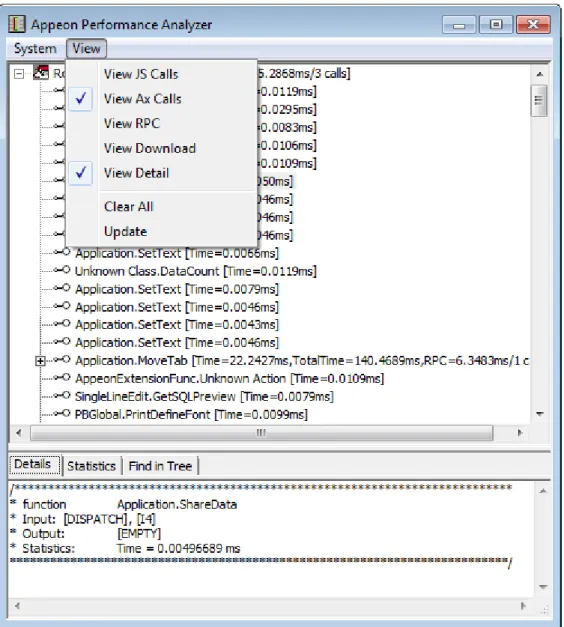
4.2.2.2.2 ActiveX Calls Analysis
By default, View AX Calls menu item in the View menu is selected, so the ActiveX calls are automatically listed in the analyzing panel. If you do not want to view the ActiveX calls in the analyzing panel, you can click View AX Calls menu item to deselect it. If you want to view the ActiveX calls only, you can click the other optional menu items in the View menu to deselect them, as shown in the figure below.
Identifying Performance Bottlenecks Appeon® for PowerBuilder® 2015
Figure 4.12: View AX Calls menu
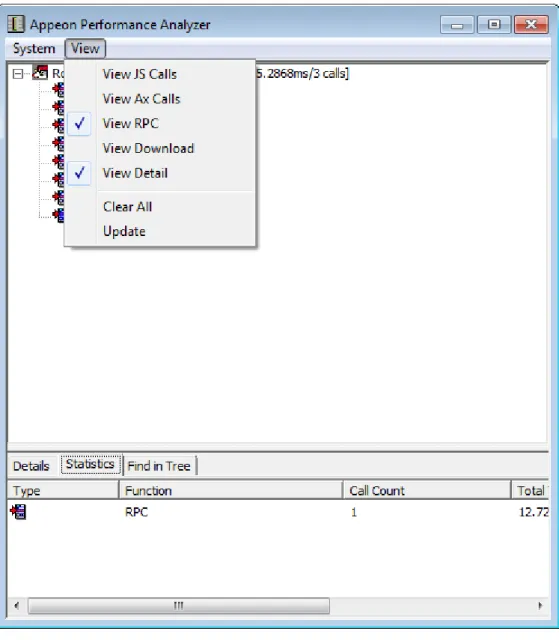
4.2.2.2.3 Remote Procedure Calls Analysis
By default, View RPC in the View menu is selected, so the RPC calls are automatically listed in the analyzing panel. If you do not want to view the RPC calls in the analyzing panel, you can click View RPC menu item to deselect it. If you want to view the RPC calls only, you can click the other optional menu items in the View menu to deselect them, as shown in the figure below.
Figure 4.13: View RPC menu
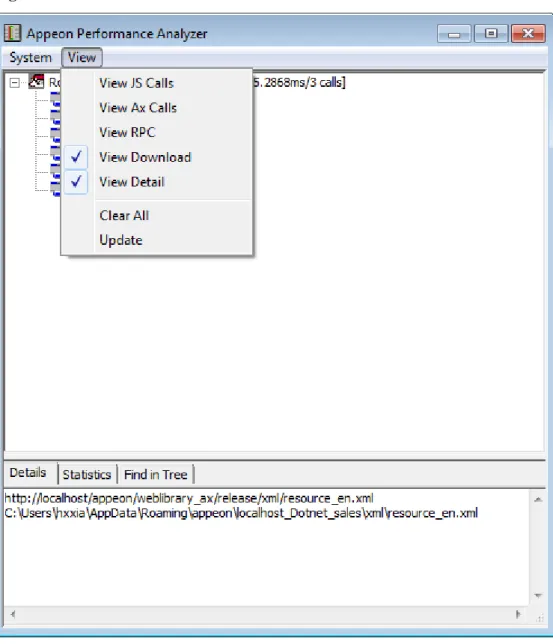
4.2.2.3 Download Analysis
By default, View Download in the View menu is selected, so the downloads are
automatically listed in the analyzing panel. If you do not want to view the downloads in the analyzing panel, you can click the View Download menu item to deselect it. If you want to view the downloads only, you can click the other optional menu items in the View menu to deselect them, as shown in the figure below.
Identifying Performance Bottlenecks Appeon® for PowerBuilder® 2015
Figure 4.14: View Download menu
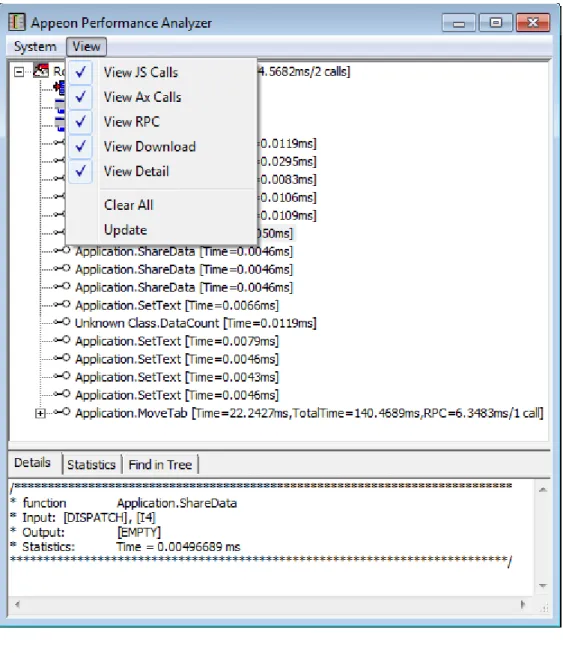
4.2.2.4 View Detail
By default, the View | View Detail menu item is selected, so the detail view panel is
automatically displayed beneath the analyzing panel. If you do not want to see the detail view panel, you can click the View Detail menu item to deselect it.
The detail view panel enables you to view the details and statistics of calls.
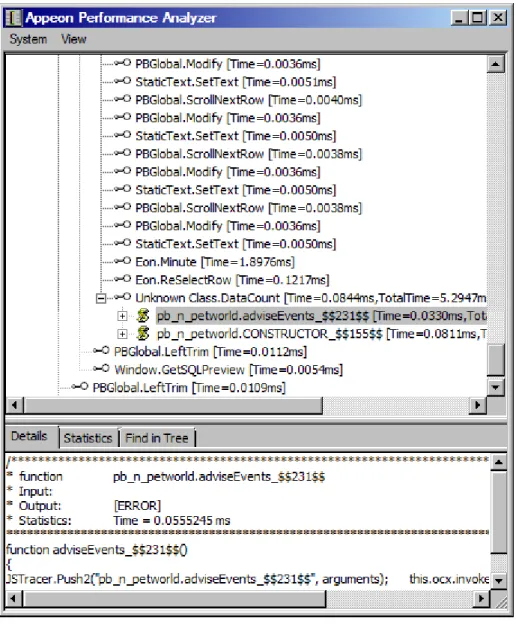
View details of JavaScript calls in the detail view panel:
Display the detail view panel by clicking the View Detail menu item in the View menu. Click the View JS Calls menu item in the View menu to display the JavaScript calls in the analyzing panel, then select a JavaScript call, the details of the selected call are displayed in the Details tab of the detail view panel.
Figure 4.15: View details of JavaScript calls
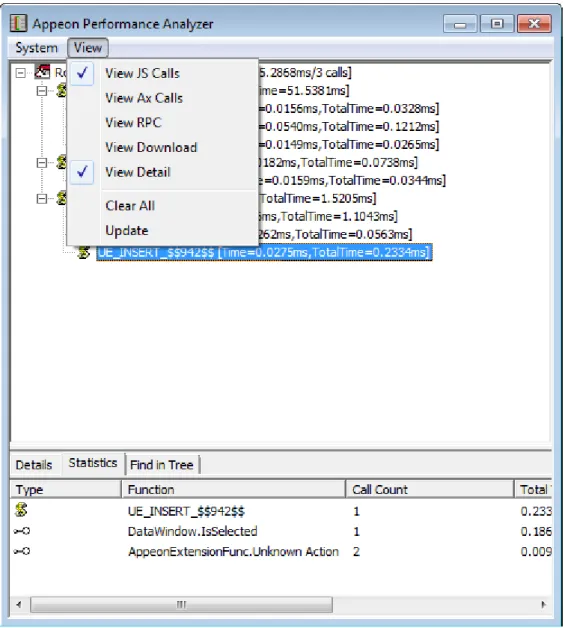
Identifying Performance Bottlenecks Appeon® for PowerBuilder® 2015
Figure 4.16: View statistics of JavaScript calls
View details of ActiveX calls in the detail view panel in a similar way as JavaScript calls:
Figure 4.17: View details of ActiveX calls
Identifying Performance Bottlenecks Appeon® for PowerBuilder® 2015
Figure 4.18: View statistics of ActiveX calls
View details of RPC calls in the detail view panel in a similar way as JavaScript calls:
The sending and receiving procedure is roughly displayed in the Details tab, to help you check the RPC process.
Figure 4.19: View details of RPC calls
View details of downloads in the Detail View panel:
The Details tab shows the download URL on the Web server and the storage location of the downloaded file.
Identifying Performance Bottlenecks Appeon® for PowerBuilder® 2015
Figure 4.20: View details of downloads
View statistics of root items in the detail view panel:
Figure 4.21: View statistics of root items
Apart from the above, the Detail View panel can also show the search results. Refer to the
Find function for details.
4.2.2.5 Additional Functions
Appeon Performance Analyzer also provides the following additional functions: • Filter function
• Find function
• Save As XML function
• New Root Item function
4.2.2.5.1 Filter function
Appeon Performance Analyzer enables you to filter the functions or objects which you do not want to focus on temporarily. Here, in Appeon Performance Analyzer, to filter means to remove.
Identifying Performance Bottlenecks Appeon® for PowerBuilder® 2015
The filter function is only applicable to ActiveX calling analysis.
Click System | Filter menu item and the Filter Configuration dialog opens. Select Enable Filter.
Note: To enable the Filter function, you must make sure Enable Tracing is selected in System Configuration dialog.
If you want to analyze all the functions or objects in the application, make sure that Enable Filter is not selected.
Figure 4.22: Filter Configuration dialog
Filter function for ActiveX calls analysis
Go through the steps below to learn how to filter objects and functions for ActiveX calls analysis.
Step 1: Select View AX Calls under the View menu, all the ActiveX functions and objects called in the operation are listed.
Figure 4.23: View ActiveX calls
Identifying Performance Bottlenecks Appeon® for PowerBuilder® 2015
Figure 4.24: Filter Configuration dialog
Step 3: In Filter, click the button. The Function Picker dialog opens. Figure 4.25: Function Picker dialog
Step 4: Select the functions and/or objects in the Unselected list. Click the arrow button to move the selected items to the Selected list. Click OK to close the dialog.
The double-arrow buttons and are used to move all items from one list to the other.
Figure 4.26: Selected functions and objects
Now, the selected items are in the Filter area.
Note that they are in Group 1. You can have different groups for storing different selected items. The different groups can be all functions, all objects, or mixed with functions and objects.
Figure 4.27: Filter Configuration dialog
Step 5: In Option area, select Filter Unselected. This will display the selected items only, and hide the unselected items. If you select Filter Selected, it will hide the selected items, and display the unselected items.
Identifying Performance Bottlenecks Appeon® for PowerBuilder® 2015
Step 6: Click OK to close the dialog.
If Filter Unselected is selected, the analyzing panel is refreshed to show the selected items only (and hide the unselected items).
Figure 4.28: Result from Filter Unselected
If Filter Selected is selected, the analyzing panel is refreshed to show the unselected items only (and hind the selected items).
Figure 4.29: Result from Filter selected
4.2.2.5.2 Find function
You can find functions or objects by typing part of or complete name of the function or object.
If you click menu System | Find, a dialog box will pop up as below:
Figure 4.30: Find dialog
Identifying Performance Bottlenecks Appeon® for PowerBuilder® 2015
Figure 4.31: Find dialog
The Detail View window shows all the results related to "applica" in the Find in Tree tab.
Figure 4.32: Find results
4.2.2.5.3 Save As XML function
The Performance Analyzer allows you to save the analysis contents in the Analyzing panel as XML files.
Figure 4.33: Save As dialog
Input the file name and select the path, and then click the Save button to save the XML file.
4.2.2.5.4 New Root Item function
To obverse analysis data easily, you can click menu View | Clear All to clear the original analysis data, or create new root items.
If you click menu System | New Root Item, a dialog box will pop up as below:
Figure 4.34: New Root Item dialog
Input a root item name (eg. new) and click the OK button. A new root item named "new" is added in the Analysis panel.