Procedia Computer Science 91 ( 2016 ) 1081 – 1087
1877-0509 © 2016 The Authors. Published by Elsevier B.V. This is an open access article under the CC BY-NC-ND license (http://creativecommons.org/licenses/by-nc-nd/4.0/).
Peer-review under responsibility of the Organizing Committee of ITQM 2016 doi: 10.1016/j.procs.2016.07.157
ScienceDirect
Information Technology and Quantitative Management (ITQM 2016)
Forecasting oil price trends with sentiment of online news
articles
Jian Li, Zhenjing Xu, Lean Yu, Ling Tang*
School of Economics and Management, Beijing University of Chemical Technology, Beijing 100029, China
Abstract
With the rapid development of the Internet and big data technologies, a rich of online data (including news releases) can helpfully facilitate forecasting oil price trends. Accordingly, this study introduces sentiment analysis, a useful big data analysis tool, to understand the relevant information of online news articles and formulate an oil price trend prediction method with sentiment. Three main steps are included in the proposed method, i.e., sentiment analysis, relationship investigation and trend prediction. In sentiment analysis, the sentiment (or tone) is extracted based on a dictionary-based approach to capture the relevant online information concerning oil markets and the driving factors. In relationship investigation, the Granger causality analysis is conducted to explore whether and how the sentiment impacts oil price. In trend prediction, the sentiment is used as an important independent variable, and some popular forecasting models, e.g., logit regression, support vector machine, decision tree and back propagation neural network, are performed. With crude oil futures prices of the West Texas Intermediate (WTI) and news articles of the Thomson Reuters as studying samples, the empirical results statistically support the powerful predictive power of sentiment for oil price trends and hence the effectiveness of the proposed method.
© 2016 The Authors. Published by Elsevier B.V.
Selection and/or peer-review under responsibility of the organizers of ITQM 2016 Keywords: Sentiment analysis; Text mining; Oil price; Trend prediction; Online news; Big data
* Corresponding author. Tel.: 86-158-1023-7921; fax: 86-10-6441-2210. E-mail address: tangling@mail.buct.edu.cn
© 2016 The Authors. Published by Elsevier B.V. This is an open access article under the CC BY-NC-ND license (http://creativecommons.org/licenses/by-nc-nd/4.0/).
1.Introduction
With the rapid development of the Internet and big data technologies, a rich of useful online data, involving textual data such as news articles, can helpfully facilitate capturing these above mentioned factors driving the oil market [1-3]. To understand the information of textual news, sentiment analysis (or opinion mining), a useful dig data analysis instrument, can be introduced. In particular, the sentiment analysis tends to quantify the information of textual data, in terms of sentiment (or subjective tone) which reflects how positive or negative the content is.
Generally speaking, this paper especially introduces the useful instrument, the sentiment of online news articles, to propose an oil price trend prediction method. In particular, three major steps are involved in the proposed method, i.e., sentiment analysis, relationship investigation and trend prediction. First, a dictionary-based approach is used to extract the overall sentiment (or subjective tone) to capture the relevant information of online news release. Second, the Granger causality analysis is conducted to test whether and how the sentiment of online news articles impacts oil price, and to determine the predictive lag order which is the main parameter in time-series forecasting models. Third, with the sentiment as an important independent variable, some popular forecasting models are performed to forecast the oil price trends. In this study, the most popular forecasting models for price trends are especially introduced, including logit regression (LogR) , support vector machine (SVM) , the DT and back propagation neural network (BPNN). For illustration and verification purposes, with crude oil futures prices of the West Texas Intermediate (WTI) and news articles of the Thomson Reuters as studying samples, the empirical study examines the effectiveness of the proposed models with sentiment, by comparing them with their respective benchmarks without sentiment.
2.Methodology formulation
For effectively capturing and employing useful online information, this paper especially introduces the sentiment analysis to propose an oil price trend prediction method with sentiment of online news articles. The general framework of the proposed methodology can be illustrated in Fig. 1.
Generally speaking, there are three main steps involved in the proposed oil price trend prediction methodology, i.e., sentiment analysis, relationship investigation and trend prediction.
2.1.Sentiment analysis
Prior to carrying out our sentiment analysis, we need to pre-process our news dataset by applying several steps, i.e., Tokenization, Negations and Stop word removal [5-6]. In this paper the Henry’s Finance-Specific Dictionary [4], a popular used dictionary for commodity market analysis, is introduced. Based on the dictionary, the sentiment can be calculated by the following equation.
( ) ( ) , ( ) ( ) p t n t t p t n t w A w A s w A w A (1)
Where
A
tis the available news at time t,w A
p( )
t is the total number of positive words inA
t,w A
n( )
t is thedifference between the counts of positive and negative words divided by the sum of positive and negative word counts in the available news articles
A
t[7].News sentimentst
Online newsAt Oil pricext
A dictionary-based approach Step 1:
Sentiment analysis
Granger causality test
p-value to test the existence of relationship
Lag orderlto show the way of relationship Forecasting model Output Step 2: Relationship investigation Trend prediction Step 3: Trend prediction Input 1 1 ˆt h {t n ,..., ,t t n ,..., }t y f s s x x ˆt 0 y yˆt 1
Fig. 1. General framework of the prediction methodology
2.2.Relationship investigation
The questions whether and how the sentiment of online news articles impacts oil price should be carefully investigated in modelling oil price trends with sentiment. To answer this question, the most popular relationship exploration technique, the Granger causality analysis, is introduced to statistically explore whether the information of sentiment helps predict oil prices. In particular, the Granger causality of two stationary time series xt and yt can be defined as follows. Series
y
tdoes not strictly Granger cause seriesx
t, when:1 1
Pr( | ) Pr( | n )), ( 1, 2,..., )
t t t t t n
wherePr(xt|It1)denotes the conditional probability distribution of series xt given the bivariate information
set 1 { , }
m n
t t m t n
I X Y involving a m-length lag vector m { ( ),..., ( 1)}
t m
X x tm x t and a n-length lag vector
{ ( ),..., ( 1)}
n t n
Y t tn y t . However, if the equality in Eq. (2) is statistically rejected, it is otherwise proved
that the past information of yt contributes to the current and future estimation forxt , i.e., yt strictly Granger
causes xt.
2.3.Trend prediction
Without external factors, the prediction
y
ˆ
t h for oil price trend at horizon h is calculated based on the history observationsX
t^
x x
t,
t1,...,
x
t(m1)`
.
1 ( 1)
ˆ
t h(
t)
( ,
t t,...,
t m)
y
f X
f x x
x
(3)where
y
ˆ
tpresents the trend prediction at time t, m is the lag order of autoregression, and h is the prediction horizon. In particular,y
ˆ
t0
indicates that the oil price is predicted to move downward (x
tx
t1), whileˆ
t1
y
suggests an upward trend (x
t!
x
t1 ). With the news sentiments
t and the corresponding predictive lag order l, the novel mothed can be extended from Eq. (3) into Eq. (4).^
`
^
1 1`
ˆ
t h t,
t t l,..., ,
t t m,...,
t.
y
f S X
f s
s x
x
(4)As for the forecasting model f(*), the most popular price trend models are especially introduced, including Logit Regression (LogR) , support vector machine (SVM), decision tree (DT) and back propagation neural network (BPNN). It worth noticing that, not only linear econometric model but also nonlinear AI techniques are employed to investigate the predictive power of news sentiment.
3.Empirical study 3.1.Experimental design
As for sample data, the WTI crude oil futures prices are derived from the U.S. energy information administration (http://www.eia.doe.gov/). The price data are weekly time series data during the period from Jan. 2, 2008 to Dec. 31, 2014, with a total of 365 samples. The online news articles are retrieved from the Thomas Reuters (www.reuters.com).
3.2.Experimental results
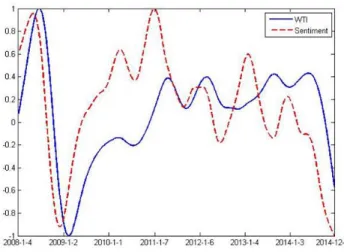
In the first step of the proposed method, sentiment analysis is first conducted to extract the sentiment series of online news articles in the Thomas Reuters. For consistency, the oil price data are pre-processed into a normalized series on the range [0, 1]. Furthermore, the two series are smoothed by the Hodrick-Prescott filter, as the results illustrated in Fig. 2. From Fig. 2, two interesting conclusions can be obviously found. First, the two series appear a synchronous evolution in term of similar trends, which implies a close relationship between the sentiment series and the price series. Second, the sentiment series generally changes the moving direction, in terms of peaks and valleys, generally before the price series, which indicates that the information hidden in the sentiment might help predict the directional movements of oil prices.
In the second step, the impact of sentiment on oil price is statistically tested. First, the augmented Dickey- Fuller (ADF) test, the most popular unit root test, is conducted to test the stationarity of the two series, in which the data generation functions are determined based on the Akaike Information Criteria (AIC). From Table 1, the testing results prove that the two series are both nonstationary at level but stationary at the first difference, under the significant level of 1%. This implies that econometric models, including the cointegration analysis and the Granger causality analysis, are feasible for modeling the two series at the first difference. Second, the cointegration test is performed to investigate whether there exists a cointegration relationship between sentiment and oil price, as the results listed in Table 2. The corresponding results show an obvious cointegration relationship between the two series, at the 1% significant level. Third, the Granger causality analysis is performed, as the results listed in Table 3. According to Table 3, a Granger causality relationship running from news sentiment to oil price can be statistically confirmed with a lag order of 3 weeks. In particular, when the lag ranges from 1 to 3, the p-value is far below the significant level of 1%; when the lag surpasses 3, the p-value otherwise exceeds 1%. Therefore, one important conclusion can be obtained from a series tests that the sentiment series strictly Granger causes price series with the predictive lag order of 3 weeks, i.e., that the information of sentiment may helpfully facilitate forecasting oil price trends.
Fig. 2. WTI weekly futures prices after normalization and sentimental series from 4th Jan 2008 to 26th Dec 2014. Table 1. Results of ADF test
t-Stat. (p-value) At level At the first difference
Sentimental series -2.9364 (0.0422) -3.6584 (0.0051)
Price series -2.2317(0.1955) -3.7247 (0.0041)
Table 2.Results of cointegration test
At level At the first difference
In the third step, the eight forecasting models are individually performed to forecast oil price trends, as the comparison results listed in Table 4. From the results, one important conclusion can be obtained. Through comparing the Type-I models and Type-II models, the powerful predictive power of sentiment for oil price trends can be statistically confirmed. In particular, all Type-II models with sentiment significantly defeat their respective counterparts without sentiment without an exception. For example, the average PPC value of the Type-II models (i.e., LogR-II, DT-II, BRNN-II and SVM-II) is about 64.9625%, far larger than the figure for the benchmarking Type-I models (i.e., LogR-I, DT-I, BRNN-I and SVM-I), i.e., 57.9425%. Furthermore, the binomial test statistically proves the superiority of the proposed models with sentiment over the benchmarking models. In particular, when the Type-II models are tested, all p-values are much smaller than the significant level of 1% without an exception, which shows that all Type-II models (i.e., LogR-II, DT-II, BRNN-II and SVM-II) can be proved to appear a high level of prediction accuracy. However, in the cases of Type-I models (i.e., LogR-I, DT-I, BRNN-I and SVM-I), the p-values are all much smaller than 1% without an exception, which indicating that the 24 effectiveness of these models cannot be statistically proved. The results repeatedly verify that the sentiment of online news articles can effectively guarantee a high level of prediction accuracy.
Table 3.Results of the Granger causality analysis
Lags
1 2 3 4 5 6 7 8 9
2
F -Stat 297.2693 24.7576 56.4907 3.4391 3.2588 3.4608 4.9915 5.8369 9.7300
p-value 0.0000 0.0000 0.0000 0.4872 0.6602 0.7492 0.6610 0.6655 0.3728
Table 4.Comparison results of different forecasting models
BPNN LogR DT SVM
PCC p-value PCC p-value PCC p-value PCC p-value
Type ชช 0.5644 0.1600 0.6301 0.0340 0.5479 0.4830 0.5753 0.2420
Type ซซ 0.5986 0.0020 0.6712 0.0050 0.6575 0.0100 0.6712 0.0050
When comparing different forecasting techniques of LogR, DT, BRNN and SVM, two interesting results can be obtained. First, although the LogR-II and SVM-II models rank the first amongst Type-II models, the superiority seems somewhat insignificant, compared with that of the Type-II models over Type-I models. For
example, the maximal absolute difference in PCC across different techniques (LogR, DT, BRNN and SVM) is
about 8.22% for the Type-I models and about 7.26% for the Type-II models, much smaller than the figures across the Type-I models and Type-II models with a given technique, i.e., about 12.33%. Second, all the techniques of LogR, DT, BRNN and SVM can be consistently improved by considering the sentiment of online articles, which repeatedly confirms the effectiveness and stability of the proposed methodology with sentiment of online news articles.
4.Conclusions
With the rapid development of the Internet and big data technologies, a rich of online data (including text data) can helpfully facilitate forecasting oil price trends. Accordingly, this paper especially introduces the useful instrument, the sentiment of online news articles, to propose an oil price trend prediction method. Generally, the proposed model makes contributions to literature from three main perspectives. First, the useful instrument, the sentiment of online news articles, is especially introduced to capture the relevant online information about oil market and driving factors. Second, the Granger causality analysis is conducted to quantitatively test the impact of sentiment on oil market, and to determine the corresponding predictive lag order, the key parameter in time-series forecasting models. Third, not only a linear econometric model but also some nonlinear AI techniques are employed to investigate the predictive power of sentiment for oil price trends. To verify the effectiveness of the proposed method with sentiment, crude oil futures prices of WTI and news releases from the Thomson Reuters are selected as studying data. Three main important conclusions can be obtained from the empirical results. First, the extracted sentiment series appear a similar trend to oil price data, with directional changes (i.e., peaks and valleys) occurring before those of oil price data. Second, the Granger causality analysis observes the sentiment series strictly Granger causes the price series, with the predictive lag order of 3 weeks. Third, the powerful predictive power of sentiment for oil price trends can be statistically confirmed, which further supports the effectiveness of the proposed method. The proposed method with sentiment can be further improved from the following three perspectives. First, the dictionary, for retrieving and understanding the relevant information of online news articles, might be the most essential factor in the proposed. Therefore an appropriate dictionary, particularly for crude oil market analysis, should be carefully designed. Second, besides trend prediction, the proposed forecasting method can be also extended for points and intervals. Third, other even more powerful forecasting techniques, such as diverse hybrid algorithms, can be introduced to the proposed methodology to further enhance the prediction performance. We will look into these interesting issues in the near future. In the future, we may apply MCDM methods [8, 9, 10] in crude oil price trend prediction model.
5. References
[1] Lo S F, Lu W M. Does size matter? Finding the profitability and marketability benchmark of financial holding companies[J]. Asia-Pacific Journal of Operational Research, 2006, 23(02): 229-246.
[2] Ji C, Li Y, Qiu W, et al. Big data processing: Big challenges and opportunities[J]. Journal of Interconnection Networks, 2012, 13(03n04): 1250009.
[3] Xu J, Huang E, Chen C H, et al. Simulation optimization: a review and exploration in the new era of cloud computing and big data[J]. Asia-Pacific Journal of Operational Research, 2015, 32(03): 1550019.
[4] Feuerriegel S, Lampe M W, Neumann D. News processing during speculative bubbles: evidence from the oil market[C]//System Sciences (HICSS), 2014 47th Hawaii International Conference on. IEEE, 2014: 4103-4112.
[5] Feuerriegel S, Neumann D. News or noise? How news drives commodity prices[J]. 2013.
[6] Manning C D, Schütze H. Foundations of statistical natural language processing[M]. Cambridge: MIT press, 1999.
[7] Uang J Y, Citron D B, Sudarsanam S, et al. Management Goingϋconcern Disclosures: Impact of Corporate Governance and Auditor Reputation[J]. European Financial Management, 2006, 12(5): 789-816.
[8] Kou G, Lin C S, A cosine maximization method for the priority vector derivation in AHP , DOI:
HTTP://DX.DOI.ORG/10.1016/j.ejor.2013.10.019, European Journal of Operational Research, 235 (2014) 225̢232 [9] Kou G, Ergu D, Shang J, Enhancing Data Consistency in Decision Matrix: Adapting Hadamard Model to Mitigate Judgment
Contradiction, DOI: HTTP://DX.DOI.ORG/10.1016/j.ejor.2013.11.035, 236 (1): 261-271, European Journal of Operational Research [10] Kou G, Peng G, Wang G, Evaluation of Clustering Algorithms for Financial Risk Analysis using MCDM Methods , DOI: