University of Huddersfield Repository
Lu, Li, He, Jianhua, Xu, Zhijie, Xu, Yuanping, Zhang, Chaolong, Wang, Jing and Adu, Jianhua
Crowd Behavior Understanding through SIOF Feature Analysis
Original Citation
Lu, Li, He, Jianhua, Xu, Zhijie, Xu, Yuanping, Zhang, Chaolong, Wang, Jing and Adu, Jianhua
(2017) Crowd Behavior Understanding through SIOF Feature Analysis. Proceedings of the 23rd
International Conference on Automation & Computing, (University of Huddersfield, 78 September
2017). ISSN 9780701702618 (In Press)
This version is available at http://eprints.hud.ac.uk/id/eprint/33569/
The University Repository is a digital collection of the research output of the
University, available on Open Access. Copyright and Moral Rights for the items
on this site are retained by the individual author and/or other copyright owners.
Users may access full items free of charge; copies of full text items generally
can be reproduced, displayed or performed and given to third parties in any
format or medium for personal research or study, educational or notforprofit
purposes without prior permission or charge, provided:
•
The authors, title and full bibliographic details is credited in any copy;
•
A hyperlink and/or URL is included for the original metadata page; and
•
The content is not changed in any way.
For more information, including our policy and submission procedure, please
contact the Repository Team at: [email protected].
http://eprints.hud.ac.uk/
Crowd Behavior Understanding through SIOF
Feature Analysis
Li Lu1, Jia He2, Zhijie Xu2,3, Yuanping Xu1, Chaolong Zhang1, Jing, Wang3, Jianhua Adu1 1School of Software Engineering, Chengdu University of Information Technology, Chengdu, China
2School of Computer, Chengdu University of Information Technology, Chengdu, China 3School of Computing & Engineering, University of Huddersfield, Queensgate, Huddersfield, UK
Abstract—Realizing the automated and online detection of crowd anomalies from surveillance CCTVs is a research-intensive and application-demanding task. This research proposes a novel technique for detecting crowd abnormalities through analyzing the spatial and temporal features of the input video signals. This integrated solution defines an image descriptor that reflects the global motion information over time. A non-linear SVM has then been adopted to classify dominant or large-scale crowd abnormal behaviors. The work reported has focused on: 1) online (or near real-time) detection of moving objects through a background subtraction model, namely ViBe; and to identify the saliency information as a spatial feature in addition to the optical flow of the motion foreground as the temporal feature; 2) to combine the extracted spatial and temporal features into a novel SIOF descriptor that encapsulates the global movement characteristic of a crowd; 3) the optimization of a nonlinear support vector machine (SVM) as classifier to detect suspicious crowd behaviors. The test and evaluation of the devised models and techniques have selected the BEHAVE database as the primary experimental data sets. Results against benchmarking models and systems have shown promising advancements in terms of the accuracy and efficiency for detecting crowd anomalies.
Keywords: crowd analysis; SIOF; optical flow; Support Vector Machine; anomaly detection
I. INTRODUCTION
Large and high-density crowds in confined spaces may lead to serious situations, especially when exposed to unwanted disturbances such as panicking and affray. In order to economize on manpower and resources for monitoring, managing, and protecting people’s lives and properties in these situations, an intelligent, efficient and cost-effective technology is of paramount importance for both of its academic and social values. Among current popular approaches to tackle the challenges, computer vision-based models offer the most promising direction (and some maturing solutions) due to its non- (or more likely less-) invasive, (sometimes) fast, and (relative) cheap solutions.
At present, vision-based approaches for crowd behavior analysis can be classified into two general categories, holistic methods and object-based methods [1]. The former treats the crowd as a single entity, which may be suitable to structural scenes with medium or high density [2]. It is based-on the assumption that individual objects in a crowded scene are often too small to be identified or any major values for crowd monitoring purpose. Therefore,
most of the holistic approaches had been designed to process a crowd as an integral whole for behavior pattern analysis. For example, Mehran extracted optical flows calculated based on social force theory, and then K-means clustering was applied on the flow area to obtain several clusters [3]. With a corpus of clusters, Latent Dirichlet Allocation (LDA) was deployed to discover the topics in the normal crowd behaviors, and then the modified Expectation Maximization (EM) algorithm with the Bag of Words (BoW) model were used to maximize the likelihood of a corpus [4]. Both the LDA training and the EM approximation algorithms need a great deal of computation, which is difficult for the process to be used in real-time and automated monitoring. In holistic approaches, crowd dynamics models are often adopted to estimate the behavior patterns as a whole, such that local behaviors in unstructured scenes cannot be handled well [1].
Compared with the holistic cases, object-based approaches can infer both the behaviors and their associated with individuals. The object-based analytical methods are frequently applied to analyze and monitor behaviors of the low to medium density crowds, where a crowd is considered as a collection of multiple individuals. Crowd behaviors can be analyzed through operational processes such as detection, segmentation, tracking and recognition. For example, Zhou et al. proposed a mixture model of dynamics pedestrian-agents (MDA) to learn the collective behavior patterns of pedestrians in crowded scenes [5]. Each pedestrian in the crowd is driven by a dynamic pedestrian-agent model. Once the model is unsupervised learned from the training data sets, MDA can gracefully speculate on the past behaviors and predict the future behaviors of pedestrians. However, this method has some limitations, e.g., the MDA assumes affine transform, such that it has difficulty in representations of some complex shapes. More importantly, monitoring individual behaviors is quite different from studying crowd behaviors. It is inherently difficult to acquire accurate individual information in a crowded scene due to occlusions and shadowing. In many real world applications, considering the crowd as linear aggregation of multiple individuals would fail to identify true crowd anomalies. Another taxonomy for classifying crowd behaviors follows a more classical image processing route through studying the pixel-value-based trajectory and motion features. Motion features in video can be divided into global features and local features. The global features are extracted using background removal and target tracking methods. Local features are interest points of video frames that are
combined to describe crowd information, though the relevant processes often require high volume preprocessing. Local features contribute to the forming of the so-called image descriptors that are the core technique for object recognition, e.g. Dalal used HOG (Histograms of Oriented Gradient) descriptor that is computed by the gradients of the image [6]. Mousavi proposed HOT (Histogram of Oriented Tracklets) descriptor that merges orientation and magnitude of mid-level features. These mid-level features are acquired by Kanade-Lucas-Tomasi Tracking (KLT) algorithm to re-initialize or detect salient points [7]. These methods have been successfully applied in action recognition.
Compared with existing algorithms, the major improvements of the proposed integrated solution in this study are listed in the following:
1) A saliency region extraction technique that combines the human visual sensitivity (HSV) model and the amplitude spectrum of quaternion Fourier transform (QFT) mechanism first proposed by Fang [8] to identify abnormal behavioral patterns.
2) A novel descriptor named as SIOF (saliency information and Optical Flow) has been established, which integrates the saliency information and optical flow features based on a holistic manner to handle complex motions. 3) Histogram features and a SVM classifier have been
integrated to derive a learning algorithm for early detection of crowd abnormality. Comparing to conventional techniques it has higher accuracy and efficiency and requires fewer training samples.
The main benefit of this approach stems from the SIOF feature descriptor that integrates the optical flow feature information and saliency information. It entails two dimensional histograms to reflect information of global nature such as dominant movements before its instances are inputted into SVM model for predictions, especially the crowd anomalies [9]. The rest of the paper is organized as follows: Section 2 introduces the fundamental concepts of Multi-scale Histogram of Optical Flow (MHOF) and the relevant saliency information for representing various crowd motion features. It aids a deeper insight of the feature vectors and the SVM training and prediction mechanisms. Section 3 provides detailed discussions and explanations of the proposed early detection solution. Experimental results on performances on real-world video scenes are analyzed and evaluated in Section 4. Section 5 concludes the proposed method with merits and deficiencies, and points the future direction of the research.
II. PRELIMINARY
A. Saliency Information
Human visual system (HVS) is a mechanism that projects outside world into human brain [8]. Human vision usually is attracted by salient regions that are different from surrounding areas and some low-level features, such as color, intensity and contrast of an image. These saliency regions have richer contents, which are easy to be perceived. In complex scenarios, anomaly events are described as a scene changed in the spatial and temporal domain.
Anomaly rates are high when the saliency regions have significant difference with surroundings. So this study adopted the saliency detection model to detect anomaly events, and it starts with dividing an image into small image blocks, and then it calculates the amplitude spectrum of QFT to get the color, intensity and orientation values in each image block [10]. At last, the saliency values for an image block i can be calculated by using the equation (1) where SIi is not only depending on the amplitude spectrum
differences (wij) between this image block and other image
blocks of the entire image, but also is effected by the human visual sensitivity.
i i j i j
i j
SI w D
z
¦
(1)B. Multi-scale Histogram of Optical Flow(MHOF)
Brox et al. proposed an algorithm based on a theory of “warping” to estimate optical flows with high accuracy [11]. This algorithm contains three assumptions, i.e., grey value constancy, gradient constancy and smoothness. The assumption of grey value constancy with nonlinearity is usually applied in cases of large displacements.
This new approach has some distinct advantages, e.g., it not only combines concepts of optical flow estimation from several previous methods, e.g. Horn-Schunck [12] and Lucas Kanade [13], but also has good insensitivity of parameter variations. Moreover, this new method is very robust to noise and light variations. Thus, it has been applied in our study to extract the optical flow.
Data Smooth
( , ) ( , ) ( , )
E u v E u v aE u v (2)
where u and v represent image pixels corresponding to optical flows in the horizontal and vertical orientation respectively, and a represents the weight of the regularization term. E(u, v) is total energy that is the weighted sum between the data term and the smooth term. The minimize energy is found by the u and v functions.
Multi-scale Histogram Optical Flow (MHOF) not only describes more temporal contextual information than traditional HOF [14], but also contains the more precise motion energy information [15]. As Fig.1 shown, an orientation bin of MHOF is 45°, and a MHOF has 16 bins including two scales that are inner layer and outer layer. After estimating the movement information of each video frame, each pixel (x, y) can be quantized into a MHOF in each image block. The MHOF formula is shown below:
2 2 (x, y) ( , ) ( , ) ( , ) ( , ) arctan( ) ( , ) r u x y v x y u x y x y v x y ° ® ° ¯T (3) ( , ) round mod , ( , ) 2 ( , ) round mod , ( , ) ( , ) 2 1 8 ( 1) 45 , 45 r r p x y p r x y T p x y p p r x y T h x y p p x y p ª u º ½ ° «¬ S »¼ ° ° ° ° ª u º ° ° t ° ® «¬ S »¼ ¾ ° ° ° d d ° ° ° u d T d u ° ° ¯ 454545 ¿°°°° T T (4)
where r(x, y) and T(x, y) are corresponding to the motion energy and motion orientation of pixel (x, y) respectively, p
denotes 8 orientation bins, Tris the magnitude threshold (Tr=1). © 2 3 4 5 6 7 8 10 11 12 13 14 15 16 9
Foreground Optical Flow Mapping
outer layer inner layer
Figure 1. A MHOF for a block
C. SVM classfier
Support vector machine (SVM) is a kind of machine analysis algorithm based on statistical learning theory [9]. It has dominant advantages in solving pattern recognition problems with small sample, non-linear and high dimension features. It has good classification effect while maintaining high test accuracy during the test phase. If sample data are nonlinear data, SVM uses a kernel function mapping low dimension samples into a high-dimension feature space, such that it can find an optimum hyper-plane to deal with the nonlinear data. Dividing the training data (x1,y1), (x2,y2),…, (xn,yn) into two categories, i.e., feature
vectors xiRnand classificationlabels yR{-1,+1}. These
two categories of data sets are separated into two-side planes by using the hyper-plane (wTux+b)=0, and the
hyper-plane can be found by SVM algorithm. Margin distance between samples and two-side planes is defined by the (wuxi+b)/__w__, and the max margin is 1/__w__. The
optimum hyper-plane [16] should be found by maximizing the margin [17].
kernel methods of nonlinear data applications had made great progress, such as Gaussian kernel [17, 18], polynomial kernel and sigmoidal kernel, and they have similar performances [19]. Thus, Gaussian kernel was chosen to process feature vectors, see equation (4).
2 2 2
( , ) exp
,( , )
i x x i i jk x x
x x
x x
ª º « » « V » ¬ ¼ u
(5)where Vdenotes the scale factor at which the data should be clustered, and xi, xj arethe data vectors in the original
data space X.
The decision function is expressed as the following: , 1 ( ) sgn ( ) 1 ( ) 0 1 ( ) 0 i i i N i f x a y k x x b f x S f x ½ ® ¾ ¯ ¿ t ® ¯
¦
0 ˈ ˈ (6)where ai represents Lagrange multipliers, b is the optimal
classification hyper-plane vector parameter, xi represents
the histogram characteristic of training samples, and x
denotes the histogram descriptor of test samples in this study. S is equal to 1, which indicates that the sample is a normal sample, and S is equal to -1 indicating an abnormal sample.
III. EARLY DETECTION OF CROWD EVENTS
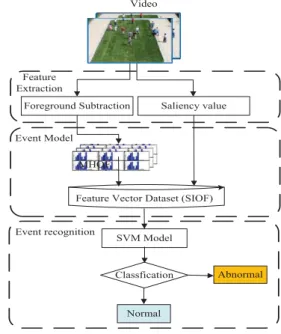
In this section, a novel integrated solution based on the salient feature information and foreground optical flow is presented for real-time and effective detection crowed anomaly events. Fig.3 shows the overall workflow of this solution.
1) Feature extraction: Each video frame is divided into n
overlapping blocks. The overlapping proportion of two adjacent blocks is 50% [11]. The main difficulty of the movement information extraction from images is that it is susceptible to be influenced by the background, so ViBe background subtraction algorithm is adopted to extract the foreground image. In each local image block, the movement optical flow feature of a foreground image is computed by the high accuracy optical flow algorithm, and the saliency information is calculated by the human visual sensitivity and amplitude spectrum of an image block by using equation (1).
2) Event Model: Optical flow feature (Hi) and salient
values (SIi) are integrated into a SIOF descriptor to
represent the global movement feature of each video frame.
3) Event recognition: Taking (Hi, SIi) as the feature vector
of frame i, which is labeled as normal or abnormal sample. The labeled training data are the input of the devised SVM algorithm to obtain the SVM model that can determine whether the current frame is abnormal or not in the online detection phase.
^
`
^
`
^
`
1, 1 1 SVM model 1 ... , .. ... ... ... training n i n train i n n D H SI H SI Sp Sp Sp S S S o o (7)The result of Si is equal to ‘1’ that represents the normal
frame, and ‘-1’ represents the abnormal frame.
4) State change: If the classification results are changed
from ‘normal’ to ‘abnormal’ or from ‘abnormal’ to ‘normal’ among consecutive several frames, and the crowd state can be considered as the state change.
Video
Abnormal Normal
MHOF
Classfication Feature Vector Dataset (SIOF)
Saliency value Foreground Subtraction Event Model Feature Extraction SVM Model Event recognition
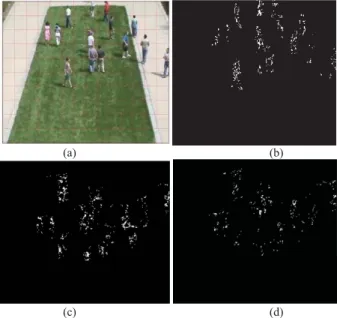
A. Extraction of Spatial and temporal features
This section focuses on discussion how to extract spatial and temporal features for generating instances of SIOF descriptor. We divide the input images into partially 40u40 overlapping image blocks to detect saliency information of the crowd scene [14]. The result of the saliency information shows in Fig.3. Fig.3(a) shows the extracted saliency information of a normal frame from the ped2 scene of an anomaly detection database UCSD. This database defines only pedestrians as normal events and takes non pedestrian entities as abnormal events. Fig.3.(b) shows the extracted saliency information of an abnormal frame from the ped2 of UCSD. Fig.3(b) has obvious difference of saliency values between people and the car on the sidewalk. In these Figures, we can see that the brighter color of the saliency information may indicate the greater probability of abnormity.
(a) (b)
Figure 3. (a) the saliency information of a normal frame (b) the saliency information of an abnormal frame
ViBe background subtraction algorithm has high operation speed while requiring less initialization time [20], so it outperforms other mainstream background subtraction techniques. Thus, the ViBe algorithm is used to extract foreground images in the proposed solution (see Fig.4). Fig.4(a) shows a scene of a group of pedestrians with a truck on the sidewalk. Fig.4(b) illustrates the foreground image, and its background area has been removed by the Vibe algorithm.
(a) (b)
Figure 4. (a) an original image from the UCSD ped2 (b) the result of a ViBe background subtraction
This solution applied the algorithm of high accuracy optical flow estimation to extract crowd motivation features between adjacent frames. This optical flow extraction process is based on foreground image without consideration of the background, such that the amount of computation can be greatly reduced. Fig.5(a) shows an original image acquired from unusual crowd activity database created by University of Minnesota (UMN). Fig.5(b) presents the global of optical flows extracted from the foreground image between the 5 and 6 video frames
from UMN. The pixel points in the Fig.5(b) reflects the magnitude of optical flows of the foreground image, and its horizontal and vertical component can be filtered out by using the high accuracy optical flow algorithm, see Fig.5(c) and (d) respectively.
(a) (b)
(c) (d)
Figure 5.(a) an original image from the UMN (b) the optical flow of a foreground image (c) the horizontal orientation of optical flow (d) the
vertical orientation of optical flow
B. Event model
The speed and orientation of a foreground image are calculated by the high accuracy optical flow algorithm. Each pixel of a foreground image should be voted into 16 orientation bins which form a bi-dimensional MHOF histogram (see Fig.1 and Fig.6). A MHOF contains both magnitude and orientation of optical flows. This histogram is much better than the method of summarizing statistics. In our experiments, an image has been divided into several blocks, e.g., 1u 1, 2 × 2, 2 × 3, 3 × 4, et al., and a block is similar with a HOG. The histogram extracted from an image frame is displayed in Fig.6.
(a) (b)
Figure 6. (a) a MHOF representation of a normal frame (b) a MHOF representation of an abnormal frame
This solution integrates the MHOF feature (Hi) of 16
dimensions and salient feature (SIi) of 165 dimensions into
a new spatial and temporal feature descriptor (SIOF), such that it can hold not only color and intensity of saliency information but also orientation and magnificent of the optical flow. Thus, this comprehensive descriptor merges the spatial differences between the target and its neighbors
as well as the global movement information of any video frame, i.e. it can preserve both local and global features, so as to improve the detection rate of crowd anomaly behaviors.
Multiple spatial and temporal features are combined into the features of video sequence, so that an instance of the SIOF descriptor can have a temporal-spatial feature vector with 181 dimensions (see equation (9)).
1 w2 i
i Hi
SIOF uw uSI (8)
C. Event recognition
SVM based anomaly behavior detection methods include two phases, i.e., training and testing:
1) The training phase:
9 The instances of SIOF descriptor from the 1 to Kth
frame are calculated for serving as a training data set (Dtain).
9 Every data element in the training data set (Dtain)
will be marked with a label (normal behavior is ‘1’ and abnormal behavior is "-1").
9 The labeled training data can serve as input training vectors for SVM model. An optimum SVM model with optimum parameters (C is defined in equation (9), and V is defined in equation(5)) can be obtained through finding an optimum hyper-plane (see equation (9)), and then it can be used to classify video stream samples.
, 1 ( ) i i ( i ) 0 N i i d x
¦
a y k x x b d da C (9)where C denotes a penalty factor.
2) After the SVM model with the optimum parameters (C,V) has been trained during the training phase, it can classify a test video frame into the normal or abnormal frame.
IV. EXPERIMENTAL RESULTS AND EVALUATION
The BEHAVE database was selected to test and evaluate the devised solution, which contains a lot of video images of various crowd activities on outdoor scenes with resolution 640u480, e.g., group fighting, meeting, walking and running [21]. It divides the image from BEHAVE database into 80u80 overlapping blocks.
The experiments were implemented by using Visual Studio 2013 and MATLAB software running on pure CPU (i7, 4 threads). In these experiments, human walking or loiter are defined as normal events while crowd running or fighting on sidewalks are considered as abnormalities.
The accuracy and recall ratio are used in these experiments to evaluate and analyze efficiency and validity of the integrated solution. In equation (10):
9 True Positive (TP) is an abnormal sample that is correctly classified as an abnormal one by the SVM; 9 True Negative (TN) is a normal sample that is correctly
classified as a normal one by the SVM model;
9 False Positive (FP) is a normal sample that is improperly classified as an abnormal one;
9 False Negative (FN) is an abnormal sample that is improperly classified as normal one.
9 Precision is the proportion of TP in the abnormal samples which are classified.
9 Recall is the proportion of TP in real abnormal samples.
= Re = FP precision TP FP TP call TP FN TP TN Accyract TP TN FP FN (10)
In these experiments, video frames from 1 to 2000 were used as normal testing samples, and from 54704 to 55111 are used as abnormal testing samples. Fig.7(a) and (d) shows the 47540 normal frame and the 55049 abnormal frame respectively. Fig.7 (b) and (e) shows the saliency information of the frame (a) and (d), and the brightness of saliency information (i.e., crowd running) in Fig.7(b) is higher than (e). Two histograms representing instances of the SIOF descriptor for frame (a) and (d) respectively are generated in Fig.7(c) and (f). The height of histogram from 1 to 16 dimensions in (f) is higher than (c) in general, and it indicates that the movement intensity and saliency values in (f) is higher than (c).
(a) (b) (c)
(d) (e) (f) Figure 7. (a) an original image of a normal frame, (b) the saliency information of frame (a), (c) the histogram representation of a SIOF descriptor instance for frame (a). (d) an original image of an abnormal
frame, (e) the saliency information of frame (d), (f) the histogram representation of a SIOF descriptor instance for frame (d).
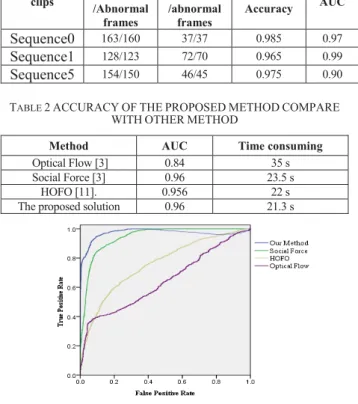
The BEHAVE database has been divided into 8 sequences. The Sequence0, Sequence1and Sequence5 are selected to serve as input samples (i.e., normal and abnormal data sets). The area under the ROC curve (AUC) of the three sequences is 0.97, 0.99 and 0.90, which denotes the classification recognition rate, i.e. the larger area of AUC, the better classification recognition rate. Table.2 shows the comparisons between the proposed solution and other traditional methods, i.e., Optical Flow, Social Force and HOFO. It can be found that this solution is better than other classic methods in terms of accuracy and time consuming. For example, although the accuracy of the proposed solution is equal to the Social Force
method㸪the corresponding time consuming is two seconds faster than Social Force. The ROC (Receiver Operating Characteristic Curve, ROC) curves of all algorithms are illustrated in Fig.8. The AUC of the proposed solution is superior to other traditional methods㸪 i.e. the proposed solution has both higher detection rate and higher computational speed.
TABLE 1EXPERIMENTAL RESULTS FOR THE PROPOSED SOLUTION
clips Actual Normal /Abnormal frames recognition Normal /abnormal frames Total Accuracy AUC Sequence0 163/160 37/37 0.985 0.97 Sequence1 128/123 72/70 0.965 0.99 Sequence5 154/150 46/45 0.975 0.90 TABLE 2ACCURACYOFTHEPROPOSEDMETHODCOMPARE
WITHOTHERMETHOD
Method AUC Time consuming
Optical Flow [3] 0.84 35 s Social Force [3] 0.96 23.5 s
HOFO [11]. 0.956 22 s The proposed solution 0.96 21.3 s
Figure 8. Roc curves of experiments
V. CONCLUSIONS
In this paper, an integrated solution for crowd analysis and the early detection of crowd abnormality based on video spatial and temporal features is presented. In this solution, a novel image descriptor through merging saliency information and the MHOF diagrams, which plays a key role and is formulated during the feature extraction phase. It preserves both local and global features of an image frame recording a crowd, which significantly improves the detection rate of crowd abnormal behaviors during operation. In the event recognition phase, the trained SVM model with optimum parameters (C,V) supports to recognize the abnormal behaviors automatically with higher accuracy and computation performance. The experimental results show this solution has good performance and can be readily transferred to the actual scenes. One drawback of this solution resides with the tendency of losing low-level features (e.g. size and form) and will be tackled in the next phase of this research.
ACKNOWLEDGMENT
This work is supported by the NSFC (61203172), the STD of Sichuan (2017JY0011 and 2014GZ0007), and Shenzhen STPP (GJHZ20160301164521358).
REFERENCES
[1] T. Li, H. Chang, M. Wang, B. Ni, R. Hong, and S. Yan, "Crowded Scene Analysis: A Survey," IEEE Transactions on Circuits & Systems for Video Technology, vol. X, pp. 367-386, 2015.
[2] J. C. S. Jacques Junior, S. Raupp Musse, and C. R. Jung, "Crowd Analysis Using Computer Vision Techniques," Signal Processing Magazine, IEEE, vol. 27, pp. 66-77, 2010. [3] R. Mehran, A. Oyama, and M. Shah, "Abnormal crowd
behavior detection using social force model," in IEEE Computer Society Conference on Computer Vision and Pattern Recognition, 2009, pp. 935-942.
[4] D. M. Blei, A. Y. Ng, and M. I. Jordan, "Latent dirichlet allocation," Journal of Machine Learning Research, vol. 3, pp. 993-1022, 2003.
[5] X. Wang, "Understanding collective crowd behaviors: Learning a Mixture model of Dynamic pedestrian-Agents," in Computer Vision and Pattern Recognition, 2012, pp. 2871-2878.
[6] N. Dalal and B. Triggs, "Histograms of Oriented Gradients for Human Detection," in Computer Vision and Pattern Recognition, 2005. CVPR 2005. IEEE Computer Society Conference on, 2005, pp. 886-893 vol. 1.
[7] H. Mousavi, H. K. Galoogahi, A. Perina, and V. Murino, Detecting Abnormal Behavioral Patterns in Crowd Scenarios: Springer International Publishing, 2016.
[8] Y. Fang, W. Lin, B. S. Lee, C. T. Lau, Z. Chen, and C. W. Lin, "Bottom-Up Saliency Detection Model Based on Human Visual Sensitivity and Amplitude Spectrum," IEEE Transactions on Multimedia, vol. 14, pp. 187-198, 2012. [9] V. Vapnik and A. Lerner, "Pattern recognition using
generalized portrait method," Automation & Remote Control, vol. 24, pp. 774-780, 2008.
[10]V. Gopalakrishnan, Y. Hu, and D. Rajan, "Salient Region Detection by Modeling Distributions of Color and Orientation," IEEE Transactions on Multimedia, vol. 11, pp. 892-905, 2009.
[11]T. Brox, A. Bruhn, N. Papenberg, and J. Weickert, "High Accuracy Optical Flow Estimation Based on a Theory for Warping," vol. 3024, pp. 25-36, 2004.
[12]B. K. P. Horn and B. G. Schunck, "Determining optical flow," Artificial Intelligence, vol. 17, pp. 185-203, 1981.
[13]J. Y. Bouguet, "Pyramidal implementation of the Lucas Kanade feature tracker description of the algorithm," Opencv Documents, vol. 22, pp. 363-381, 1999.
[14]T. Wang and H. Snoussi, "Histograms of Optical Flow Orientation for Visual Abnormal Events Detection," in IEEE Ninth International Conference on Advanced Video and Signal-Based Surveillance, 2012, pp. 13-18.
[15]Y. Cong, J. Yuan, and J. Liu, "Sparse reconstruction cost for abnormal event detection," vol. 32, pp. 3449-3456, 2011. [16]C. Piciarelli, C. Micheloni, and G. L. Foresti,
"Trajectory-Based Anomalous Event Detection," Circuits & Systems for Video Technology IEEE Transactions on, vol. 18, pp. 1544-1554, 2008.
[17]B. E. Boser, I. M. Guyon, and V. N. Vapnik, "A training algorithm for optimal margin classifiers," in The Workshop on Computational Learning Theory, 1996, pp. 144-152. [18]N. Cristianini and J. Shawe-Taylor, An introduction to
support Vector Machines: and other kernel-based learning methods: Printed in the United Kingdom at the University Press, 2000.
[19]B. Schölkopf and A. Smola, "Learning with Kernels: Support Vector Machines, Regularization, Optimization, and Beyond," Journal of the American Statistical Association, vol. 16, pp. 489-489, 2003.
[20]O. Barnich and M. V. Droogenbroeck, "ViBe: A Universal Background Subtraction Algorithm for Video Sequences," IEEE Transactions on Image Processing A Publication of the IEEE Signal Processing Society, vol. 20, p. 1709, 2011. [21]Laghaee, A. (2013). BEHAVE Interactions Test Case Scenarios. Retrieved February 9, 2013,from http://groups.inf.ed.ac.uk/vision/BEHAVEDATA/INTERACTI ONS/