San Jose State University
SJSU ScholarWorks
Master's Projects Master's Theses and Graduate Research
Spring 5-26-2017
Predicting Pancreatic Cancer Using Support Vector
Machine
Akshay Bodkhe
San Jose State University
Follow this and additional works at:https://scholarworks.sjsu.edu/etd_projects
Part of theArtificial Intelligence and Robotics Commons, and theOther Computer Sciences Commons
This Master's Project is brought to you for free and open access by the Master's Theses and Graduate Research at SJSU ScholarWorks. It has been accepted for inclusion in Master's Projects by an authorized administrator of SJSU ScholarWorks. For more information, please contact
Recommended Citation
Bodkhe, Akshay, "Predicting Pancreatic Cancer Using Support Vector Machine" (2017).Master's Projects. 535. DOI: https://doi.org/10.31979/etd.9w5j-j4ax
& &!&&&!&!&
% & !#& "&
!!&& !$& "&
!!&& !$& "&
uyk^Ā Āý Ā Ā Ā ²Ā ĀÞĀ ĀĀĀ $Ā ĀĀ$Ā õĀ ĀĀĀĀĀ
tnj{oĀ
!*)&**
Robert Chun
Digitally signed by Robert ChunDN: cn=Robert Chun, o=San Jose State University, ou=Computer Science, [email protected], c=US Date: 2017.05.19 18:01:53 -07'00'
Akshay Bodkhe
Predicting Pancreatic Cancer Using Support Vector Machine
Digitally signed by Leonard Wesley (SJSU) DN: cn=Leonard Wesley (SJSU), o=San Jose State University, ou,
[email protected], c=US Date: 2017.05.26 09:17:25 -07'00' Dr. Leonard Wesley 5/19/2017 Dr. Robert Chun 5/26/2017 5/19/2017 Dr. Jenny Lam
Page
1
of
42
CS 298 Final Project Report
PANCREATIC CANCER PREDICTION USING SUPPORT VECTOR MACHINE
A Project Report
Presented to
The Department of Computer Science
San Jose State University
In Partial Fulfillment
Of the Requirements for the
Computer Science Degree
by
Akshay Bodkhe
Page
2
of
42
© 2017
Akshay Bodkhe
Page
3
of
42
The Designated Project Report Committee Approves the Project Report Titled
Pancreatic Cancer Prediction Using Support Vector Machines
by
Akshay Bodkhe
APPROVED FOR THE DEPARTMENT OF COMPUTER SCIENCE
SAN JOSE STATE UNIVERSITY
May 2017
Dr. Leonard Wesley Signature: ______________________________
Department of Computer Science
Dr. Robert Chun Signature: ______________________________
Department of Computer Science
Dr. Jenny Lam Signature: ______________________________
Department of Computer Science
Page
4
of
42
ABSTRACT
This report presents an approach to predict pancreatic cancer using Support Vector Machine Classification algorithm. The research objective of this project it to predict pancreatic cancer on just genomic, just clinical and combination of genomic and clinical data. We have used real genomic data having 22,763 samples and 154 features per sample. We have also created Synthetic Clinical data having 400 samples and 7 features per sample in order to predict accuracy of just clinical data. To validate the hypothesis, we have combined synthetic clinical data with subset of features from real genomic data. In our results, we observed that prediction accuracy, precision, recall with just genomic data is 80.77%, 20%, 4%. Prediction accuracy, precision, recall with just synthetic clinical data is 93.33%, 95%, 30%. While prediction accuracy, precision, recall for combination of real genomic and synthetic clinical data is 90.83%, 10%, 5%. The combination of real genomic and synthetic clinical data decreased the accuracy since the genomic data is weakly correlated. Thus we conclude that the combination of genomic and clinical data does not improve pancreatic cancer prediction accuracy. A dataset with more significant genomic features might help to predict pancreatic cancer more accurately.
Page
5
of
42
ACKNOWLEDGEMENTS
I am exceptionally appreciative to my Project Advisor Dr. Leonard Wesley for his steady support and consolation all through the Master's venture. His basic data sources helped me concentrate on the correct way to finish this venture.
I might likewise want to thank my advisory group individuals Dr. Robert Chun and Dr. Jenny Lam, for their important time and proposals amid this venture.
Page
6
of
42
Table of Contents
1. INTRODUCTION ……….9
2. LITERATURE REVIEW ………...10
2.1 Towards Prediction of Pancreatic Cancer Using SVM Study Model ………..10
2.2 Machine learning of clinical performance in a pancreatic cancer database ……….11
2.3 Prediction of pancreatic cancer survival through automated selection of predictive model ………13
2.4 Data Mining Techniques for Prognosis in Pancreatic Cancer ………..16
2.5 Premalignant Pancreatic Cancer Diagnosis Using Proteomic Pattern Analysis ………...17
2.6 Combining PubMed knowledge and EHR data to develop a weighted Bayesian network for Pancreatic cancer prediction ……….19
3. RESEARCH HYPOTHESIS AND OBJECTIVES ………21
4. EXPERIMENTAL DESIGN ………..22
5. APPROACH AND METHOD ………...22
5.1. QCMG Data Set ………...22
5.2. TCGA Data Set ………26
5.3. PLCO Data Set ………28
5.4. Clinical Synthetic Data …...………...………..31
6. RESULTS ………...33
6.1 PLCO Dataset Results ………..33
6.2 Synthetic Clinical Data Results …..………..36 6.3 Real Genomic and Clinical Synthetic Data Results ……….37
7. DISCUSSION ………38
8. CONCLUSION AND FUTURE WORK ………..38
\9. PROJECT SCHEDULE ………39
Page
7
of
42
List of Figures
Figure 1: Comparison of ROC curves of the weighted BNI, the conventional BNI, KNN and SVM ………...20
Figure 2: Heat Map of features ………...23
Figure 3: Heat Map of features ……….24
Figure 4: Heat Map of features ……….25
Figure 5: Heat Map of features ……….26
Figure 6: TCGA dataset features Heat Map ………...27
Figure 7: PLCO dataset features Heat Map ………..29
Figure 8: TCGA dataset Correlation Matrix ………...30
Figure 9: Synthetic dataset features Heat Map ……….32
Page
8
of
42
List of Tables
Table 1: Classification accuracy for nine-month survival dataset ………....15
Table 2: LOOCV Results Summary ………...18
Table 3: Detailed Results by Output Class ………...19
Table 4: PLCO Data Results for Subset of Features ………...33
Table 5: PLCO Data Results for Subset of Features ……….34
Table 6: PLCO Data Results with UnderSampling ………...34
Table 7: Results with Genomic Data ………35
Table 8: Results with Weighted Classification ……….35
Table 9: Results with Synthetic Clinical Data ………..36
Table 10: Clinical Data and only Individual Genomic features ………...37
Page
9
of
42
1. INTRODUCTION
Pancreatic Cancer is an ailment in which harmful cells shape in the tissues of the pancreas. Cells in the body begin to grow uncontrollably. Pancreas is located behind the stomach and produce hormones that control sugar. Most of pancreatic cancers commence in the cells that produce these hormones [Journal of Clinical Oncology and Research, 2014].
Different cancers have different symptoms. But having a symptom, or even several symptoms, does not mean that one will get the disease. Few of the Clinical symptoms for Pancreatic Cancer are Jaundice, Floating Bowels, Unintentional Weight Loss, Smoking, Family History of Cancer while genomic symptoms are gene mutation in following genes: KRAS, TP53, CDKN2A, SMAD4, genetic gain in chromosome 8q, genetic loss in chromosome 9p, presence of genes MLL315, ATM15, KDM6A12 because of structural variations and gene mutation.
Prostate cancer is a common and frequent cause of cancer death. In the United States, prostate cancer is the most commonly diagnosed visceral cancer; in 2016, there are expected to be approximately 181,000 new prostate cancer diagnoses and approximately 26,100 prostate cancer deaths [e.Siegel RL, Cancer statistics, 2016. - PubMed - NCBI"]. Prostate cancer is second only to skin cancer and lung cancer as the leading cause of cancer and cancer death, respectively, in United States men. Worldwide, in 2012 there were estimated to be 1,112,000 new cases of prostate cancer and 308,000 prostate cancer deaths, making it the second most commonly diagnosed cancer in men and the fifth leading cause of male cancer death [e.Torre LA, Global cancer statistics, 2012].
The mortality rate of pancreatic cancer patients is approaching 100%. Only 4% of the patients survive 5 years or more after being diagnosed. All these grim statistics of pancreatic cancer necessitates the urgent development of methods to facilitate their early detection and prevention [AB, et al, 2004]. Despite the advancement of knowledge in recent years regarding the pathophysiology of pancreatic cancer [D, et al, 2004] [M, et al, 2004], there is no effective method to diagnose this cancer type early enough to impact the treatment outcomes.
Prostate Cancer is a very complex disease, and the decision-making process is challenging because it requires a fine balance among expected clinical benefit, life expectancy and potential treatment-related adverse events [A, et al, 2009]. The prediction of clinical outcomes is therefore critical. Accurate estimates of stage and of the likelihood of cancer diagnosis, clinical significance, treatment success, and complications are important for patient counseling and informed decision-making. By understanding the most probable
Page
10
of
42
endpoint of a patient’s clinical course, physicians may modify treatment and post-treatment strategies in order balance benefits and adverse events of treatment. Prediction also allows patients to choose responsibly among the different treatment strategies proposed by the clinicians. Properly informing the patient of these
likelihoods could improve the patient’s satisfaction after treatment [Shariat, 2009]. Thus early prediction of
Prostate Cancer will help reduce its mortality.
2. LITERATURE REVIEW
2.1 Towards Prediction of Pancreatic Cancer Using SVM Study Model:
Goal of this paper is to Predict Pancreatic Cancer using Support Vector Machine. Some studies [CK, et al,
1982] [Riboli E, et al, 1983] indicate that tumor variation is a strong symptom of pancreatic cancer. This suggests that histological tumor differentiation and lymph node metastasis could be a good predictor for pancreatic cancer. Thus this work aims at evaluating following biological properties and provide predictive
information of cancer cell behavior pre-operatively: “Lymph node metastasis” and “Tumor metastasis” in
Pancreatic Cancer. This work makes use of accumulated leftover laboratory data which involves many features. The clinical tests are considered as an n-dimensional pathological feature set, where n refers to the number of clinical tests. By taking the n samples and grouping them by a particular status, this data is used to train a classifier, which can then be assessed by the cross-validation technique.
Dataset
In this study, 174 surgically resected and histologically confirmed common type pancreatic cancer cases at the National Cancer Center Hospital in Japan are utilized for the analysis. Tumor differentiation status and lymph node metastatic status (N0; negative nodal metastasis or N+; positive nodal metastasis), are used as the basis of classification.
Following two data sets are prepared based on the above classification criteria: Set Diff (tumor differentiation between poorly differentiated vs. others) and the Set N1 (N+ vs. N0). For Set Diff, poorly to moderately differentiated tumor samples are considered as positive samples, well differentiated tumor samples are taken as negative samples. For Set N1, N0 are defined as negative findings while the rest as positive, with a total of 86 positive samples. Following clinical laboratory data from the same cancer cases is also used: CEA, CA19-9, Glucose, Elastase I, Serum Amylase, C-reactive protein (CRP), Serum Glucose (GLU), Fibrin degradation product (FDP), Fibrinogen (FIBG) and Antithrombin III (ATIII). We also use
Page
11
of
42
data regarding age, sex, tumor location, tumor size (TS mm), number of lymphocytes (LymphNum) and lymphocyte ratio (LymphCell).
Methodology
To identify important features, feature ranking is done using several available feature selection criteria like
“entropy”, “t-test”, “ROC”, “bhattacharyya” After feature ranking, “FIBG”, “CA19-9”, “CEA” and “Elastase I” are selected as top four features. All the features used for analysis are initially converted into
several groups: “low”, “normal” and “high” based on the definition of the normal ranges provided by National Cancer Center Hospital described in detail in [12]. In order to quantize the features, numbers -1, 0 and 1 are used to indicate low group, normal range and high group respectively. As a result, 59 data instances are used to train the SVM. Integrating the four significant features, a data set of size 59-by-4 (59 patients and 4 features) is created.
Results and Discussion
Classification performance of the model used in this paper is compared with other Machine Learning techniques like Decision Trees (DT) and K Nearest Neighborhood (KNN). The accuracy of SVM is 70% which is better than DT (65%) and KNN (69%). Average Specificity of SVM is 70% which is slightly less than DT (79%) and KNN (99%). Average Sensitivity is 70% which shows that this model is very good in predictions. AUC values are compared to find out how effective the models are. The proposed model was employed to predict new pancreatic cancer samples and the accuracy of this experiment was 72% which is quite remarkable. Thus the approaches used for feature selection and outlier detection help in classifying correctly.
2.2 Machine learning of clinical performance in a pancreatic cancer database:
Approach
The majority of predictive models in modern oncology literature are generated by regression algorithms,
particularly linear regression, logistic regression, and Cox’s proportional hazard model [Y, et al, 2003] [R, et
al, 2002] [JF, 2004]. Author has used both the traditional algorithms (linear and logistic regression), and machine learning classification algorithms (Bayesian nets, decision trees, k -nearest-neighbor, neural networks, among others) to generate prediction models. A clinical database consisting of 91 patient treatments over the course of several years was constructed. The accuracies of machine learning prediction models were statistically compared to those generated by traditional methods over this clinical database. Set
Page
12
of
42
of prediction target attributes for which to develop prediction models were selected which include tumor size, T-staging, N-staging, vasculature involvement, tumor histology, malignancy, survival rates, and ECOG scores at 6-month, 9-month, and 12-month follow-up intervals. For each of these target attributes, performance of the prediction algorithms was tested on a data set extracted from the clinical database by removing the value of the selected target attribute from each patient treatment instance. Predicted values of the target attribute based on the remaining attributes were compared with the value of the target attribute in the full database.
Dataset
Pancreatic cancer patients seen over a three-year period at the Dept. of Surgical Oncology at the University of Massachusetts Memorial Hospital in Worcester, MA were considered. Complete screening, treatment,
and follow-up records were retrospectively compiled from the hospital’s Meditech electronic record system
into this clinical database. Supervision by the medical staff was provided for the interpretation of ambiguous or incomplete records. A total of 91 evaluations for pancreatic cancer treatment were done between April 2003 and May 2006, representing 87 unique patients. Among the patients, 49 (56%) were female. Among the tumors evaluated, 75 (82%) were deemed potentially resectable, 7 (8%) locally advanced/unresectable, and 9 (10%) metastatic or equivocal. A total of 74 (81%) resections were subsequently performed with a surgical success rate (complete excision of tumor) of 96%. Radiotherapy was assigned in 37 (41%) evaluations, chemotherapy in 39 (43%) evaluations, and palliative measures in 11 (12%) evaluations. One of the challenges with the data set was a relatively small number (91) of patient instances were available for this study. Studies are often constrained by the number of patients seen at an institution, or the rarity of certain disease etiologies [M, et al, 1997]. The number of patients available in this study has proved sufficient in other pancreatic cancer studies [R, et al, 2002] [J, et al, 2004]
Methodology
Weka Machine Learning workbench [I, et al, 2005] is used for all classification and regression algorithm implementation. The algorithms used are ZeroR (numeric mode or majority class prediction), linear regression (minimizes sum of squared errors between linear combination of attribute values and prediction target) [H, 1974] [JL, 1995] and logistic regression [S, et al, 1992]. Data preprocessing methods used are Minimum Description Length (MDL) discretization and correlation-based feature selection. MDL discretization transforms numeric attributes into nominal attributes by binning the attribute values relative to changes in the target classification, as measured by the minimum description length (MDL) principle [UM, et al, 1993]. Correlation-based feature selection (CFS) heuristically selects a subset of attributes such that
Page
13
of
42
attributes in the subset exhibit high correlation to the target class and low correlation to each other [MA 2000]. Clinical prediction models are then generated using classification for nominal targets and regression for numeric targets. Metrics of predictive performance are evaluated over 10 iterations of 10-fold cross-validation with random re-seeding. Performance of classification models is evaluated via the mean classification accuracy (percentage correct) across these 100 repetitions. Regression models are evaluated by calculating r-squared values which define percentage of response variance accounted for by the prediction model.
Result and Analysis
Classification performance of the data mining techniques apparently is equivalent or better than that of conventional logistic regression. This distinction has a tendency to be most noteworthy over the original data with no preprocessing. When preprocessing is connected as CFS feature selection and MDL attribute discretization, logistic regression execution enhances extraordinarily. Performance of the data mining methods also improves with preprocessing. However, in several experiments the accuracy difference between typical data mining performance values and logistic regression performance is no longer large enough to be statistically significant at the level p<0.05. The author has compared the performance of 1240 generated data mining predictive models against logistic regression. The overall classification performance of the data mining methods is generally comparable or statistically superior to logistic regression.
Conclusion and Future Work
The present paper has described the application of machine learning models to data mining over a database of cancer patient clinical performance with a view toward predicting specific outcomes, including patient survival and quality of life. The data mining methods considered here delivered comparable or superior predictive performance to that of traditional multivariate regression methods for nearly all prediction targets. Future work should consider further advantages of data mining, particularly the expressiveness of the resulting models and their potential usefulness to clinicians in understanding the factors that influence disease state and in making clinical decisions. One technical gap to consider in future work is the trade-off between smaller feature-rich data set, and other available data sets which provide larger numbers of patients but comparatively less individual detail.
2.3 Prediction of pancreatic cancer survival through automated selection of predictive models:
Page
14
of
42
The quality of the predictions produced by a given machine learning method varies across patients. In particular, the method that provides the best predictive model for one patient will not necessarily be optimal for another patient. The latter fact suggests that overall predictive performance across all patients could be improved if it were possible to reliably predict, for each patient, what machine learning method will provide the best performance for that particular patient. The selected method can then be used to make predictions for the patient in question. This is the approach described in this paper.
Dataset
A clinical database containing retrospective records of 60 patients treated by resection for pancreatic adenocarcinoma at the University Of Massachusetts Memorial Hospital in Worcester was created. Each patient record is described by 190 fields comprising information about preliminary outlook, personal and family medical history, diagnostic tests, tumor pathology, treatment course, surgical proceedings, and length of survival. The attributes are divided into three major categories: 111 pre-operative attributes, 78 peri-operative attributes, and the target attribute. The prediction target (or target attribute) of this analysis is survival time, measured as the number of months between diagnosis and death. All patients considered in this study have known dates of death, hence the potential statistical issue of data censoring
that is, prematurely “cut off ” data, does not occur.
Experimental Protocol
Select Level 0 Classifiers: Each of the machine learning strategies is connected under thought with and without highlight determination to the dataset and recorded the subsequent precision detailed by the 10 reiterations of 10-overlap cross approval technique is recorded. For each of the machine learning systems, the majority of the element choice methodologies are tried with a changing number of ascribes to be chosen. As a rule, highlight determination expanded the precision of the machine learning strategies. At that point the main 3 most precise models among all models are chosen: the ones with and the ones without highlight choice. Select the Level 1 Classifier: Once the main 3 performing level 0 models are distinguished, creator tentatively figured out what subset of those 3 beat models together with what level 1 machine realizing method would yield the model-selector meta-classifier with the most noteworthy prescient precision. As over, all machine learning strategies with and without highlight choice (and permitting the extent of the chose credit set to shift) are considered for level 1 show development. Take note of that for this situation, include determination is connected to the level 1 dataset, not to the first dataset. The model selector meta-classifier with the most noteworthy prescient exactness is then revealed.
Page
15
of
42
Results and Analysis
The naıve Bayes (NB) classifier clearly benefits from attribute selection in this study: its classification accuracy is higher when trained over a relatively small number of selected attributes. On the other hand, the Bayes Network (BN) classifier performs best when allowed to operate over a larger set of attributes that has undergone little or no selection. The different results in the two cases are explained by the fact
that the naıve Bayes technique, unlike Bayes Networks, is based on the assumption of conditional independence among the non-class attributes given the class. Attribute selection extracts a smaller set of less-correlated predictive attributes, thus bringing the attribute set closer to satisfying the conditional independence assumption.
Table 1: Classification accuracy for nine-month survival dataset
This paper has presented a new approach to combining predictive methods through automated meta-learning, and an evaluation of this technique for the prediction of pancreatic cancer survival using a database of retrospective patient records. The experimental evaluation presented in this paper focuses on predicting survival time of pancreatic cancer patients based on attributes such as demographic information, initial symptoms, and diagnostic test results. Individual predictors considered include various machine learning techniques as well as logistic regression. The evaluation results show that the proposed technique of model selection meta-learning produces predictions that are better than those of the individual predictive methods. Also, the proposed technique outperforms the standard meta-learning techniques of bagging, boosting, and stacking in the experiments conducted for this paper.
Page
16
of
42
2.4 Data Mining Techniques for Prognosis in Pancreatic Cancer: Approach
Goal of this paper [Floyd, et al., 2007] is to predict expected survival time of the patient. Instead of comparing the accuracies of models constructed using Machine Learning algorithms, this paper says that since the collaborators know the patients in the dataset, asking them to predict a patient's survival given a set of attributes from this dataset would likely not be representative of their ability to predict the expected survival of a new patient. Therefore, Logistic Regression and ZeroR are used as benchmark algorithms.Gain Ratio, Principal Components, ReliefF, and Support Vector Machines are used for feature selection. These algorithms rank the most important features so are run several times, varying the condition on the number of features to return. This method is used to determine the optimal feature for a given machine learning algorithm. Baseline algorithms are compared with several other machine learning algorithms, including artificial neural networks, Bayesian networks, decision trees, naïve Bayes networks, and support vector machines. For each dataset, the best combination of feature selection and machine learning algorithm is identified. These combinations are compared with ZeroR and logistic regression. An attempt is made to improve the classification accuracy by experimenting with both bagging, boosting, stacking, and model selector described in the paper. The primary focus in this study is on improving the classification accuracy by combining multiple machine learning models generated by the best pairs of feature selection and machine learning algorithm.
The classification accuracy for all experiments is calculated by running ten repetitions, each repetition with a different initial random seed, of tenfold cross validation. The models with the highest classification accuracy are then selected for further comparison. The classification accuracy of these models is compared to the classification accuracy of a model built using logistic regression. Once the best combinations of feature selection and machine learning algorithm is found, Bagging is evaluated on each of these combinations as a method to reduce the standard deviation of the classification accuracy, as decreasing the standard derivation may increase the statistical significance. Boosting is evaluated to increase the classification accuracy of each combination.
Results
The highest classification accuracy obtained by constructing models with no feature selection is 47.5%. There is an overall increase in the classification accuracies as the number of attributes is
Page
17
of
42
increased from 10 to 30. When 30 attributes are selected there are several models with classification accuracies above 47.5% including ones constructed using artificial neural networks with one hidden unit, artificial neural networks with two hidden units, Bayesian networks with one parent, and logistic regression. After this peak at 30 attributes most models show a gradual decrease in classification accuracy as the number of attributes selected increases. The classification accuracy of this model continues to increase until it peaks when 60 attributes are selected. The best model with no feature selection resulted from a model constructed using a Bayesian network with a maximum of two parents.
2.5 Premalignant Pancreatic Cancer Diagnosis Using Proteomic Pattern Analysis: Approach
The goal of this paper [Htike, et al., 2015] is to predict, given a mass spectrum derived from a serum sample, whether or not the sample comes from a patient with early pancreatic cancer. Two steps are performed in pre-processing: base-line correction and smoothing. Base-line correction is done because a major of the m/z ratios have non-zero intensity values or spurious peaks because of systematic error, background noise, and chemical noise. Therefore, the true mass spectrum without the contaminants is
estimated. A ‘top-hat’ filter to perform baseline correction is proposed. It entails subtracting the observed spectrum its morphological opening. Spectrum smoothing is then performed next in order to alleviate very high frequency components [Coombes, et al, 2005]. A wavelet noise removal technique is also proposed. It entails dividing the mass spectrum into components of different scales and estimating the wavelet coefficients [Alpaydin, 2010]. Coefficients corresponding to high frequency components are then discarded in order to smoothen the spectrum.
Feature Extraction and Classification
RELIEF is used as a Feature Selection algorithm. It is used select 300 best m/z ratios that best discriminate pancreatic cancer. A proteomic mass spectrum is now represented by a 300-dimensional feature vector [Kononenko, et al, 1997]. A hybrid technique called a logistic model tree [Landwehr, et al, 2005] to classify 300-dimensional feature vector is used. The proposed logistic model tree applies LogitBoost with simple regression functions as base learners in order to fit the logistic models.
Page
18
of
42
Experiments
Dataset from University of Pennsylvania is used [Hingorani, et al, 2003]. Dataset contains 181 serum samples where 80 samples are pancreatic intraepithelial neoplasia samples and the remaining 101 samples are healthy or control samples. The mass spectrum of each serum sample contains 6771 m/z ratios that range from 800 to 11992.91. Leave-one-out cross-validation is used where one sample was held out as the validation data while the remaining samples served as training data. The whole process was repeated multiple times such that each sample got held out exactly once as the validation data. The results were then averaged to produce an estimator to the accuracy of the proposed pancreatic cancer diagnosis system. Throughout all the experiments, minimum number of boosting iterations of 50, the maximum number of boosting iterations of 1500, and the heuristic threshold value of 60 as parameters of the logistic model tree were used. Table 2 lists the summary of the leave-one-out cross-validation results.
Table 2: LOOCV Results Summary
134 out of 181 samples are predicted accurately giving an accuracy of 75 %. Cohen coefficient value is 0.47. Root Mean Square Error is found to be 0.4470 which is quite less. Table 4 displays the results. The true positive rate of the disease class is lower than that of the control class. Moreover, the false positive rate for the tumor class is likewise lower than that of the control class. This implies the framework creates more negative forecasts than positive expectations. As per the author, this maybe because of the imbalanced class distribution.
Page
19
of
42
Table 3: Detailed Results by Output Class
Conclusion
Given the mass spectrum of a serum sample, the system predicts whether the serum shows signs of premalignant pancreatic cancer. This system has achieved an accuracy of 74.0331% in early premalignant pancreatic cancer detection for this dataset. The accuracy is not that high because this is a very challenging problem owing to the fact that in the early stages of cancer, there are only miniscule differences in the proteomes. However, the preliminary experimental results are quite promising. As future work, the author mentions that he will perform optimization of the system parameters to further boost the performance of the system. He would also like to test this framework on a wide range of other types of cancer.
2.6 Combining PubMed knowledge and EHR data to develop a weighted Bayesian network for
pancreatic cancer prediction Approach
In this paper [Zhao, et al., 2011], PubMed knowledge and Electronic Health Records is combined to develop a weighted Bayesian Network Inference model for pancreatic cancer prediction. 20 variables that are used to design the BNI models are: age, alcohol or cigarette abuse, abdominal pain, fatigue or asthenia, nausea, vomiting, weight loss, depression, appetite loss, diabetes mellitus, jaundice, carbohydrate antigen 19-9 (CA 19-9), carcinoembryonic antigen (CEA), gamma-glutamyl transferase (GGT), glucose, alanine aminotransferase (ALT), aspartate aminotransferase (AST), alkaline phosphatase (ALP), albumin and bilirubin. Learning from rule based method designed by Chen et al. to calculate associations among biological terms [H, et al, 2004], Keyword-based
Page
20
of
42
method was used to automatically extract and classify PubMed abstracts that mentioned both any of the risk factors and pancreatic cancer together to calculate the weight of each risk factor. Each PubMed abstract was classified into one of the following three categories according to the association between the selected variable and pancreatic cancer: positive, negative, or neutral association. To ensure high accuracy in the abstract classification phase, the machine classification results were further reviewed manually and corrected as appropriate, although the manual review was greatly enhanced by the text-mining algorithm since the sentences containing the keywords were automatically highlighted to ease the manual review. For each risk factor, only the abstracts containing positive and negative associations between the risk factor and pancreatic cancer were used to calculate the original weights for each risk factor. Each risk factor is treated as a binary variable without considering the severity, degree, accumulative length, or other quantitative
information of the risk factor. The value “true” represents the presence of a factor and the value
“false” represents the absence of a risk factor.
Results and Discussion
The top three variables associated with pancreatic cancer, ranked by importance, were: weight loss, abnormal glucose, and abnormal CA 19-9. In contrast to the PubMed weighting results, the top three most frequent variables appearing in pancreatic cancer patients EHR were: glucose, albumin, and nausea. Accuracy indicated by weighted BNI (91%) is significantly higher than conventional BNI (80.6%), KNN (71.8%) and SVM (72.7%). As shown in Figure 2, ROC curve of the weighted BNI is higher than that of the conventional BNI, KNN and SVM, indicating a better performance is achieved by the weighted BNI for pancreatic cancer prediction.
Page
21
of
42
3. RESEARCH HYPOTHESIS AND OBJECTIVES
Research Objective:
Given the technical gaps discussed previously, the work reported here begins to bridge this gap by utilizing extra components: family history, acquired hereditary disorders, endless pancreatitis, cirrhosis of the liver, stomach issues, abstain from food, physical dormancy, caffeine intake alongside existing elements. For example, age, liquor or cigarette use, stomach agony, weariness or asthenia, weight reduction, diabetes mellitus, jaundice, sugar antigen 19-9 (CA 19-9), carcinoembryonic antigen (CEA), gamma-glutamyl transferase (GGT), glucose, alanine aminotransferase (ALT), aspartate aminotransferase (AST), basic phosphatase (ALP), HGVSp_Short, cDNA_position, CDS_position, ENSP, UNIPARC, EXON to make clinical and genomic dataset comprising of subset of these elements. Then use Support Vector Machine classifier on these datasets first individually and later by combining
both the datasets to make predictions about pancreatic cancer. Based on the technical Gap, Null and
Alternate Hypothesis are stated below
Alternate Hypothesis:
Support Vector Machine as a classification algorithm will improve prediction accuracy of pancreatic cancer model by approximately 5% if combination of subset of features mentioned above in the research objective is used.
Null Hypothesis:
Support Vector Machine as a classification algorithm will not improve prediction accuracy of pancreatic cancer by 5% if combination of subset of features mentioned above in the research objective is used.
Page
22
of
42
4. EXPERIMENTAL DESIGN
The experiments defined below are intended to test the hypothesis posited above. All experiments will measure the effect of carrying out the experiments by employing the metrics described below.
1. Calculate accuracy of Pancreatic Cancer Prediction Model on Clinical Dataset
2. Calculate accuracy of Pancreatic Cancer Prediction Model on Genomic Dataset
3. Create Synthetic dataset of Clinical features
4. Derive features using various combinations of features in Synthetic Clinical dataset
5. Derive features using various combinations of features in Genomic dataset
6. Make Predictions on the combination of Synthetic Clinical and Genomic datasets
5. APPROACH AND METHOD
For conducting the experiments, four real datasets and one synthetic dataset are used. 5.1. QCMG Data Set
This data is obtained from “cbioportal”. Data set consists of both clinical as well as genomic
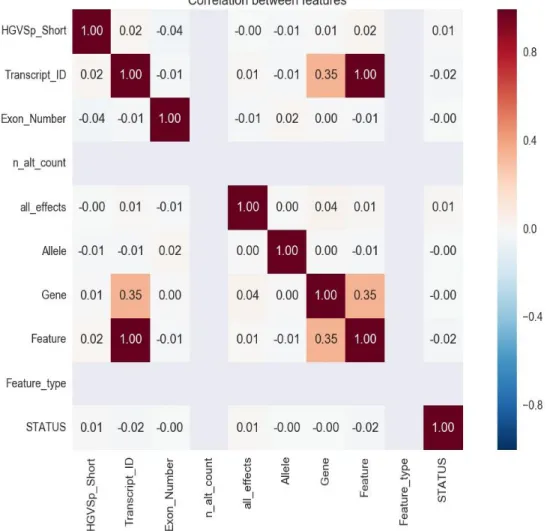
data. It has 383 clinical samples. Mutation data file consists of 22763 samples and 115 features per sample. There are two separate files for clinical and genomic data each. Clinical data consists of features like patient_id, ethnicity, sex, age, smoker, country, etc. Genomic data file consists of features like Gene_Id, Chromosome, Variant_type, start_position, end_position, reference_allele, etc.
In the dataset, 60 features from 115 features consisted of more than 50% missing values so these features are removed. Also removed missing values for remaining features in the dataset. After processing, the dataset size is 8994 x 53.
Visualized combination of various features using heat map in order to identify important features related to the dependent variable i.e. pancreatic cancer. Following heat map shows the correlation between various features. As it can be seen from the heat maps that none of the features are strongly correlated to the dependent variable i.e. STATUS
Page
23
of
42
Page
24
of
42
Page
25
of
42
Page
26
of
42
Figure 5: Heat Map of features
5.2. TCGA Data Set
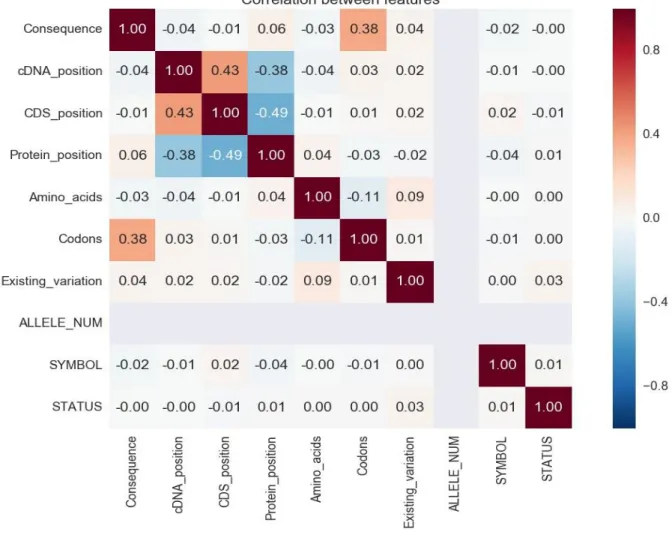
This dataset is obtained from “cbioportal”. Dataset consists of separate files for mutation and clinical data. Clinical data has 184 samples with 23 features for each sample. Clinical dataset has features like Gender, Race, Ethnicity, Alcohol_History, Diabetes, Family_History_of_Cancer. Genomic dataset consisted of similar features as mentioned above in QCMG data.
The dataset did not contain any missing values. Before visualizing the data, converted the
categorical features to numeric using LabelEncoder. Visualized clinical data using heat map as
shown below. It can be seen from the heat map that none of the features is strongly correlated with
Page
27
of
42
Figure 6: TCGA dataset features Heat Map
Page
28
of
42
5.3. PLCO Data Set
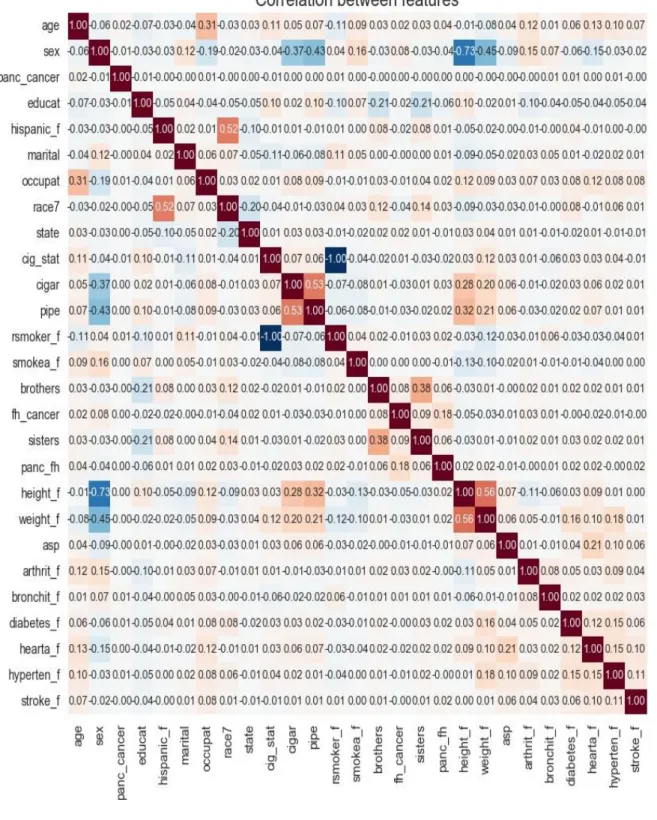
This dataset is obtained from NCI Cancer Data Access System. It is a clinical dataset of 1,54,897 patients and 154 features per patient. Features consists of age, sex, panc_cancer, marital, cigarette_status, family_cancer_history, diabetes, liver_comorbity, etc.
The important features that are identified from list of 154 features based on the hypothesis are Age, Participant's current cigarette smoking status, The total number of years the participant smoked, # of Cigarettes Smoked Per Day, Age Started Smoking, Has Family History of Any Cancer, Family History of Pancreatic Cancer, Diabetes, Liver Comorbidities, Age stopped smoking, Drink Alcohol, Caffeine, Glucose. Removed missing values for all the above mentioned features. Visualized the data using heatmaps to find out correlation between these features and dependent variable. Also plotted scatter plots to find relationship between variables. After carefully looking at the data, it is observed that the dataset is highly imbalanced. 98 % records belong to class 0 (Non Cancer) and 2 % belong to class 1 (Cancer).
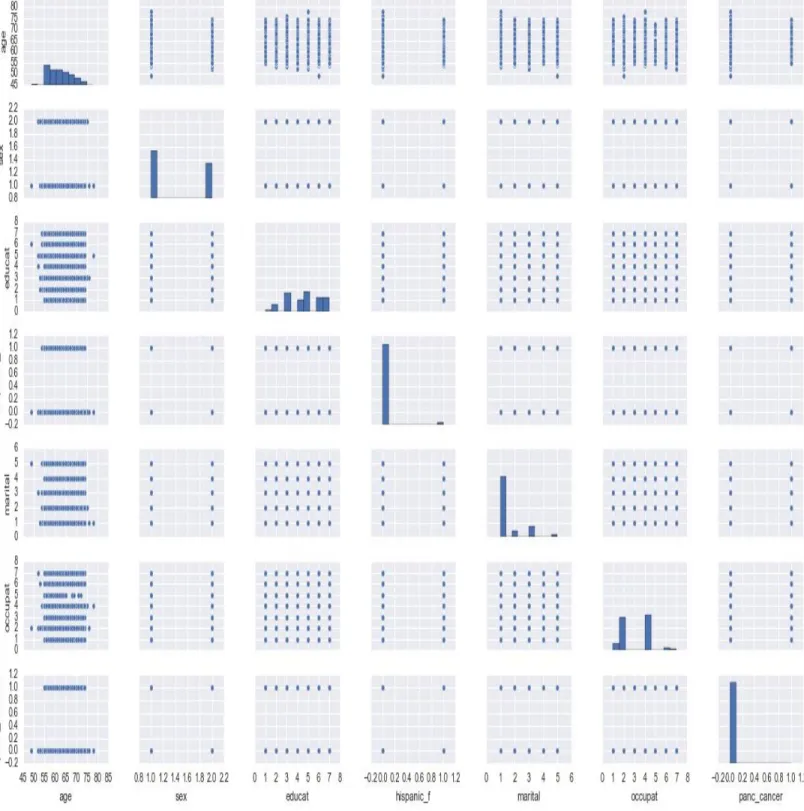
Plotted the data on a scatter plot to identify relationship between variables. As shown in the scatter plot below, the relationship between variables is not linear.
Heat map is used in order to identify important variables related to dependent variable i.e. Pancreatic Cancer status. It can be inferred from the heat map below that none of the variables is highly correlated to the dependent variable.
Page
29
of
42
Page
30
of
42
Page
31
of
42
5. APPROACH AND METHOD
5.4. Clinical Synthetic Data:
Since none of the datasets mentioned above helped in predicting Pancreatic Cancer, Synthetic dataset of clinical features is created as mentioned below:
o Unexpected Weight Loss: 1 – No, 2 – Moderate, 3 – Significant
o Smoking: 0 – Non smoker, 1 – Light, 2 – Heavy
o Jaundice: 0 – No, 1 – Yes
o Floating Bowels: 0 – No, 1 – Yes
o Itchy Skin: 0 – No, 1 – Moderate, 2 – High
o Blood clot in leg: 0 – No, 1 – Small, 2 – Big
o Liver Enlargement: 0 – No, 1 – Yes
These are strong clinical symptoms of Pancreatic Cancer. Since pancreatic cancer is hard to detect, any one symptom is not a very strong indicator of cancer. Hence various
combinations of these features along with their individual
contribution are considered. 90 % of data belongs to class 0 (Non pancreatic Cancer) and 10 % data belongs to class 1 (Pancreatic Cancer).
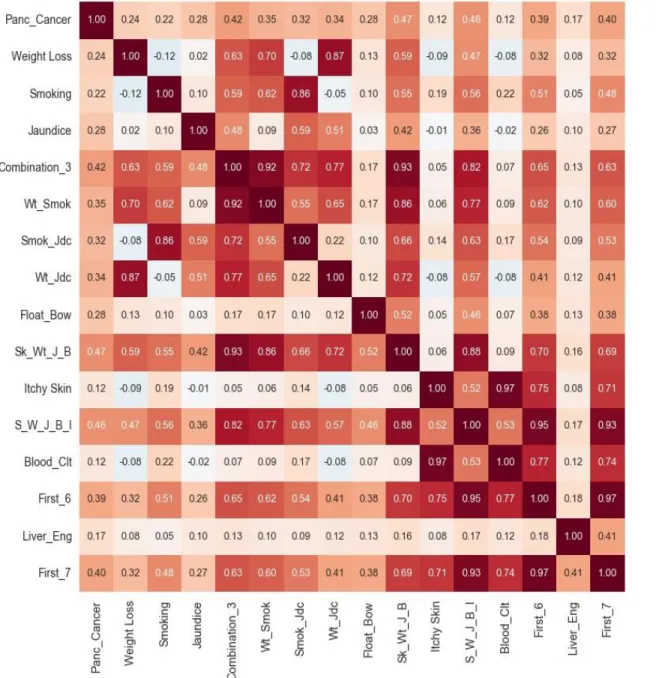
Data is visualized using heatmap in order to obtain importance of individual features and their combination. As it can be seen from the heatmap that the combination of features is strongly correlated to the dependent variable i.e. cancer than any individual feature.
Page
32
of
42
Figure 9: Synthetic dataset features Heat Map
Various features are derived as a combination of above mentioned features. For
example ‘Combination_Wieght_Smoking’ is a combined feature of ‘Weight’ and
‘Smoking’. Other derived features are ‘Combination_Weight_Jaundice’,
‘Combination_Smoking_Jaundice’, ‘Smoking_Weight_Jaundice_Bowels’, etc. The values
for any combined feature is calculated by taking mean of the individual features. And the
Page
33
of
42
predictor variables values are in favor of pancreatic cancer or not. In all the shape of the dataset is 400 x 16 i.e. 400 samples with 16 variables for each sample.
Support Vector Machine Binary Classifier is used to make predictions. Before building the model, the dataset was split into Training data (70 %) and Testing data (30 %). The predictor variables and dependent variable are separated in training and testing data.
Support Vector Machine ‘Linear’ kernel is used for building the model. The model is
trained on 70 % training data and validated on remaining 30 % data. The model has been evaluated on metrics like accuracy, precision, recall and area under curve (auc) score.
6. RESULTS
Experiments with multiple datasets are conducted as mentioned in the above section and below are the
results with each one of them. 6.1 PLCO Dataset Results
Since this dataset is highly imbalanced i.e. only 0.47 % belongs to class 1 (Pancreatic Cancer), following approaches are considered:
Subset of features:
Since the dataset consisted of 154 features, various subsets of features are considered. Since
abnormal weight loss is a prominent symptom of cancer, feature ‘weight difference’ is derived using
‘weight_at_20’ and ‘weight_at_50’ features. Support Vector Machine Classifier is used to make
predictions and result is as follows
Metric Value Explanation
Precision Class 0 0.99 Given a class 0 prediction from the classifier, how likely is it to be correct Class 1 0 Given a class 1 prediction from the classifier, how likely is it to be correct
Recall Class 0 1 Given a class 0 sample, how likely will the classifier detect it
Class 1 0 Given a class 1 sample, how likely will the classifier detect it
Accuracy 99.52% Ratio of correct predictions to total predictions
AUC
Score 0.5 Area Under Reciever Operating Characteristic Curve
Page
34
of
42
Since this feature is not correlated with Pancreatic Cancer, the results are not good. The accuracy is so high because the data set is highly imbalanced and it classifies almost every sample as class 0.
Smoking is another prominent symptom for pancreatic cancer. The dataset contained features
like ‘no. of years smoked’ and ‘no. of cigarettes smoked per day’. Using these a new feature
‘total cigarette smoked’ is derived and have made predictions using it. There is no correlation at all
between this feature and the dependent variable. Couple of other features like
‘family_history_cancer’, ‘liver_comorbidity’ along with ‘total cigarette smoked’ are also considered
and following are the results of SVM classifier:
Metric Value Explanation
Precision Class 0 0.99 Given a class 0 prediction from the classifier, how likely is it to be correct Class 1 0 Given a class 1 prediction from the classifier, how likely is it to be correct
Recall Class 0 1 Given a class 0 sample, how likely will the classifier detect it
Class 1 0 Given a class 1 sample, how likely will the classifier detect it
Accuracy 99.54% Ratio of correct predictions to total predictions
AUC
Score 0.5 Area Under Reciever Operating Characteristic Curve
Table 5: PLCO Data Results for Subset of Features
Dataset is balanced by undersampling the majority class features. The new dataset consists of 692 class 0 and 692 class 1 samples. Support Vector Machine classifier results are as follows:
Metric Value Explanation
Precision Class 0 0.55 Given a class 0 prediction from the classifier, how likely is it to be correct Class 1 0.58 Given a class 1 prediction from the classifier, how likely is it to be correct Recall Class 0 0.51 Given a class 0 sample, how likely will the classifier detect it
Class 1 0.62 Given a class 1 sample, how likely will the classifier detect it
Accuracy 56.73% Ratio of correct predictions to total predictions
AUC
Score 0.56 Area Under Reciever Operating Characteristic Curve
Page
35
of
42
In this case, the accuracy is less since the dataset consists of equal number of class 0 and class 1 samples. However the Precision and Recall values have improved as the probability of the classifier predicting the correct class for each sample is high.
Top correlating features with the dependent variable are: 'HGVSp_Short' ,'cDNA_position', CDS_position', 'ENSP', 'UNIPARC', 'EXON'. This subset of features is used to build a SVM model and make predictions. Results are as follows:
Metric Value Explanation
Precision Class 0 0.81 Given a class 0 prediction from the classifier, how likely is it to be correct Class 1 0.2 Given a class 1 prediction from the classifier, how likely is it to be correct Recall Class 0 0.99 Given a class 0 sample, how likely will the classifier detect it
Class 1 0 Given a class 1 sample, how likely will the classifier detect it
Accuracy 80.77% Ratio of correct predictions to total predictions
AUC
Score 0.5 Area Under Reciever Operating Characteristic Curve
Table 7: Results with Genomic Data
Weighted Classification:
Since the dataset is highly imbalanced, have assigned weights to the minority class samples i.e. class 1. This is achieved in Support Vector Machines by using the parameter
‘class_weight = balanced’. This replicates the smaller class until there are as many samples as
in the larger one but in an implicit way. Results for this are as follows:
Metric Value Explanation
Precision Class 0 0.99 Given a class 0 prediction from the classifier, how likely is it to be correct Class 1 0.01 Given a class 1 prediction from the classifier, how likely is it to be correct Recall Class 0 0.58 Given a class 0 sample, how likely will the classifier detect it
Class 1 0.54 Given a class 1 sample, how likely will the classifier detect it
Accuracy 58.04% Ratio of correct predictions to total predictions
AUC
Score 0.56 Area Under Reciever Operating Characteristic Curve
Page
36
of
42
6.2 Synthetic Clinical Data Results
This dataset consists of 400 samples and 16 features. It has 10 % data for class 1 i.e. having cancer and 90 % data for class 0 i.e. not having cancer. Have applied support vector machine classification and following are the results along with ROC plot for synthetic clinical data results:
Metric Value Explanation
Precision Class 0 0.93 Given a class 0 prediction from the classifier, how likely is it to be correct Class 1 1 Given a class 1 prediction from the classifier, how likely is it to be correct
Recall Class 0 1 Given a class 0 sample, how likely will the classifier detect it
Class 1 0.33 Given a class 1 sample, how likely will the classifier detect it
Accuracy 93.33% Ratio of correct predictions to total predictions
AUC
Score 0.67 Area Under Reciever Operating Characteristic Curve
Table 9: Results with Synthetic Clinical Data
Page
37
of
42
6.3 Real Genomic and Clinical Synthetic Data Results
Genomic data from QCMG and Synthetic Clinical data are combined. Features used from Genomic data
are: 'HGVSp_Short', 'cDNA_position', 'CDS_position', 'ENSP', 'UNIPARC', 'EXON'. A prediction model is built using Support Vector Machines Classifier and following are the results:
Metric Value Explanation
Precision Class 0 0.91 Given a class 0 prediction from the classifier, how likely is it to be correct Class 1 0 Given a class 1 prediction from the classifier, how likely is it to be correct
Recall Class 0 1 Given a class 0 sample, how likely will the classifier detect it
Class 1 0 Given a class 1 sample, how likely will the classifier detect it
Accuracy 90.83% Ratio of correct predictions to total predictions
AUC
Score 0.5 Area Under Reciever Operating Characteristic Curve
Table 10: Clinical Data and only Individual Genomic features
Metric Value Explanation
Precision Class 0 0.89 Given a class 0 prediction from the classifier, how likely is it to be correct Class 1 0 Given a class 1 prediction from the classifier, how likely is it to be correct
Recall Class 0 1 Given a class 0 sample, how likely will the classifier detect it
Class 1 0 Given a class 1 sample, how likely will the classifier detect it
Accuracy 89.16% Ratio of correct predictions to total predictions
AUC
Score 0.5 Area Under Reciever Operating Characteristic Curve
Page
38
of
42
7. DISCUSSION
From the results, it can be seen that it is important to have relevant features in order to predict Pancreatic Cancer. Also, no individual feature is a strong symptom of pancreatic cancer and we need a combination of features to make predictions. In the Synthetic data experiments, individual features like Jaundice, Weight Loss, etc. are not strongly correlated with the dependent variable. Hence one cannot make predictions based only on these variables. However a combination of these features like combination of Jaundice and Smoking, Combination of Smoking and Weight Loss, etc. is more strongly correlated to pancreatic cancer than individual features. As we combine more number of features, it is observed that the correlation increases. Thus we can say that a combination of more number of clinical features is a good predictor of Pancreatic Cancer than individual features.
The mutation data used in this work is not a good predictor of Pancreatic Cancer since none of the features is correlated to the dependent variable. Even when the weakly correlated genomic data is combined with strongly correlated synthetic clinical data, the results are not good. Thus it is necessary to have a good dataset of genomic features so that a combination of genomic and clinical data might have better prediction accuracy.
8. CONCLUSION AND FUTURE WORK
For Synthetic Clinical data, prediction results are good when a combination of features is used. For genomic data, the prediction results are not good since it is very weakly correlated to the dependent variable. Moreover the results degrade when synthetic clinical and real genomic features are combined together. Thus in the real world if a good combination of clinical and genomic features is considered then Pancreatic Cancer can be predicted accurately. However, based on the results obtained in this study, the Hypothesis that “Combination of Clinical and Genomic features will improve the prediction accuracy of Pancreatic Cancer by 5 %” is refuted.
In the future, plan to collect and conduct experiments on more significant real world genomic data. Also plan to incorporate additional clinical features to build a better model. Future work will also include calculating p-value to determine statistical significance in a hypothesis test. p-value will evaluate how well the sample data support that the null hypothesis is true. A high p-value suggests that the sample
Page
39
of
42
data provides enough evidence to accept null hypothesis for the entire population while a low p-value suggests evidence to reject null hypothesis.
9. PROJECT SCHEDULE
Complete project implementation took around 3-4 months. Inside this time allotment every one of the tasks specified in the strategy and approach area of the report were completed. A fundamental Pancreatic Cancer Prediction model was produced using Support Vector Machines before fifth week. Before 10 weeks' over every one of the tasks mentioned in the design of experiments were finished. Remaining time was spent for composing the report. A more point by point timetable is described in the table below.
EXPERIMENTS WEEK
DATA SET EXPLORATION 0-1
LOADING DATA SET AND MORE EXPLORATION 1-2
DATA PREPROCESSING AND FEATURE ENGINEERING
3-4
APPLYING SVM ON THIS MODEL 4-5
FINE TUNING SVM PARAMETERS 5-6
OTHER DATA SETS EXPLORATION 6-7
MORE DATA PROCESSING AND EXPERIMENTS WITH MULTIPLE DATASETS
7-9
Page
40
of
42
MODEL
PROJECT REPORT 10-12
REFERENCES
[1]Jemal A, Siegel R, Ward E, Hao Y, Xu J, Thun MJ. Cancer statistics, 2009. CA Cancer J
Clin. 2009;59:225–49. [PubMed]
[2]Shariat, Shahrokh F., et al. "Critical review of prostate cancer predictive tools." Future oncology 5.10
(2009): 1555-1584.
[3]e.Siegel RL, "Cancer statistics, 2016. - PubMed - NCBI", Ncbi.nlm.nih.gov, 2017. [Online]. Available:
https://www.ncbi.nlm.nih.gov/pubmed/26742998. [Accessed: 22- Jan- 2017].
[4]e. Torre LA, "Global cancer statistics, 2012. - PubMed - NCBI", Ncbi.nlm.nih.gov, 2017. [Online].
Available: https://www.ncbi.nlm.nih.gov/pubmed/25651787. [Accessed: 22- Jan- 2017].
[5]--Lowenfels AB, Maisonneuve P: Epidemiology and prevention of pancreatic cancer.
Jpn J Clin
Oncol
2004, 34: 238–244. 10.1093/jjco/hyh045[6]Li D, Xie K, Wolff R, Abbruzzese JL: Pancreatic cancer.
Lancet
2004, 363: 1049–1057.10.1016/S0140-6736(04)15841-8
[7]Jafari M, Abbruzzese JL: Pancreatic cancer: future outlook, promising trials, newer systemic agents, and
strategies from the Gastrointestinal Intergroup Pancreatic Cancer Task Force.
Surg Oncol Clin N
Am
2004, 13: 751–60, xi. 10.1016/j.soc.2004.06.009[8]--Chung CK, Zaino RJ, Stryker JA. Colorectal carcinoma: evaluation of histologic grade and factors
influencing prognosis. J Surg Oncol. 1982; 21: 143-148.
[9]--Berti Riboli E, Secco GB, Lapertosa G, Di Somma C, Santi F, Percivale PL. Colorectal cancer:
Page
41
of
42
[10]Fujino Y, Suzuki Y. Predicting factors for survival of patients with unresectable
pancreatic cancer: a management guideline. Hepatogastroenterology 2003;49:250–3.
[11]Strnad R, Ryska M. Are we able to predict survival rate after the radical resection of the pancreas for the pancreatic ductal adenocarcinoma?In: Joint meeting of the European Pancreatic Club (EPC) and the International Association of Pancreatology (IAP); 2002.
[12]Tseng JF. Resection of the superior mesenteric-portal vein for pancreatic
adenocarcinoma: Margin status and survival duration. In: 45th annual meeting of the Society for Surgery of the Alimentary Tract; 2004.
[13]Kukar M, Besic N, Kononenko I, Auersperg M, Robnik-Sikonia M. Prognosing the survival time of patients with anaplastic thyroid carcinoma with machine learning. In: Zupan B, Keravnou E, Lavrac N, editors. Intelligent data analysis in medicine and pharmacology. Dordrecht, The Netherlands: Kluwer
cademic Publishers; 1997. p. 116–29.
[14]Witten I, Frank E. Data mining: practical machine learning tools and techniques, 2nd ed, San Francisco, CA, USA: Morgan Kaufmann; 2005.
[15]Akaike H. A new look at the statistical model identification. IEEE Transactions on Automatic Control
1974;19(December (6)):716–23.
[16]Devore JL. Probability and statistics for engineering and the sciences, 4th ed., Belmont, CA, USA: Brooks/Cole Publishing Company; 1995.
[17]le Cessie S, van Houwelingen JC. Ridge estimators in logistic regression. Applied Statistics
1992;41(1):191–201.
[18]Fayyad UM, Irani KB. Multi-interval discretization of continuous-valued attributes for classification learning. In: Bajcsy R, editor. Proc. 13th Intl. Joint Conf. on Artificial Intelligence (IJCAI-1993), vol. 2.
San Mateo, CA, USA: Morgan Kaufmann; 1993. p. 1022–9.
[19]Hall MA. Correlation-based feature selection for discrete and numeric class machine learning. In:
Langley P, editor. Proc. 17th international conf. on machine learning. 2000.p. 359–66.
[20]DeWitt J, Devereaux B. Comparison of endoscopic ultrasonography and multidetector computed tomography for detecting and staging pancreatic cancer. Annals of Internal Medicine
2004;141(November (10)):753–63.
[21]Chen H H, Sharp B. Content-rich biological network constructed by mining PubMed abstracts. BMC Bioinform 2004;5(1):147.
[22]cid _prod, "What is pancreatic cancer?," 2017. [Online]. Available:
Page
42
of
42
cancer. Accessed: Jan. 14, 201Qiu, Yushan, et al. "Towards prediction of pancreatic cancer using SVM study model." Journal of Clinical Oncology and Research (2014).
[23]"Pancreatic Cancer Risk Factors", Cancer.org, 2017. [Online]. Available:
http://www.cancer.org/cancer/pancreatic-cancer/causes-risks-prevention/risk-factors.html. [Accessed: 22- Jan- 2017].
[24]Qiu, Yushan, et al. "Towards prediction of pancreatic cancer using SVM study model." Journal of Clinical Oncology and Research (2014).
[25]Hayward, John, et al. "Machine learning of clinical performance in a pancreatic cancer database." Artificial Intelligence in Medicine 49.3 (2010): 187-195.
[26]Floyd, Stuart, et al. "Prediction of Pancreatic Cancer Survival through Automated Selection of Predictive Models." International Joint Conference on Biomedical Engineering Systems and Technologies. Springer Berlin Heidelberg, 2010.
[27]Floyd, Stuart. Data Mining Techniques for Prognosis in Pancreatic Cancer. Diss. Boston College, 2007. [28]Htike, Zaw Zaw, and Shoon Lei Win. "Premalignant Pancreatic Cancer Diagnosis Using Proteomic Pattern Analysis." Journal of Medical and Bioengineering Vol 4.4 (2015).
[29]Leonard Wesley et al. American Journal of Biochemistry and Biotechnology 2016, DOI: 10.3844/ajbbsp.2016
[30]Zhao, Di, and Chunhua Weng. "Combining PubMed knowledge and EHR data to develop a weighted bayesian network for pancreatic cancer prediction." Journal of biomedical informatics 44.5 (2011): 859-868.